. 2022 Sep 1;132(17):e156501.
doi: 10.1172/JCI156501.

Human β-defensin-3 attenuates atopic dermatitis-like inflammation through autophagy activation and the aryl hydrocarbon receptor signaling pathway

Affiliations

Human β-defensin-3 attenuates atopic dermatitis-like inflammation through autophagy activation and the aryl hydrocarbon receptor signaling pathway

Ge Peng et al. J Clin Invest. .

Abstract

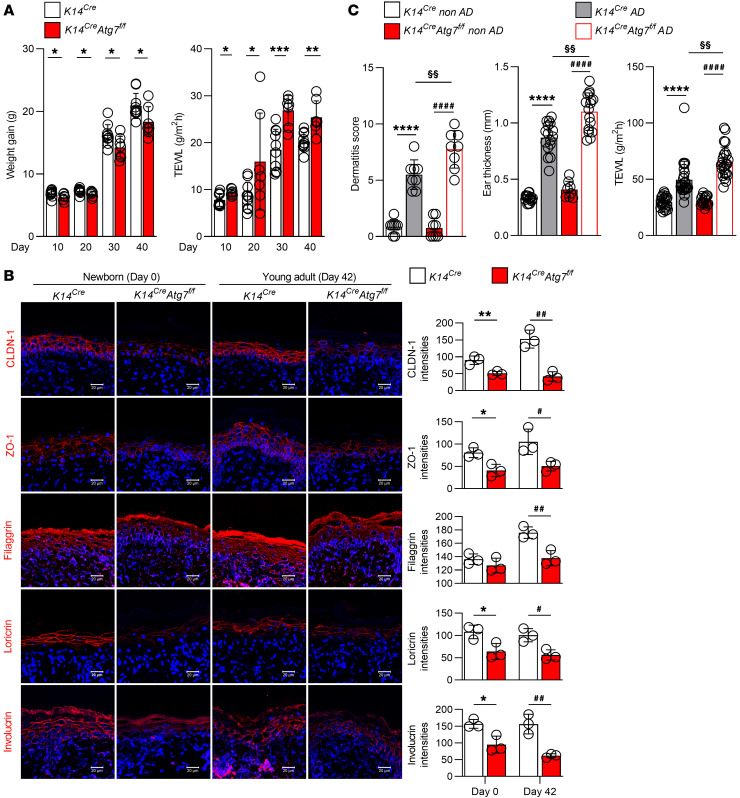
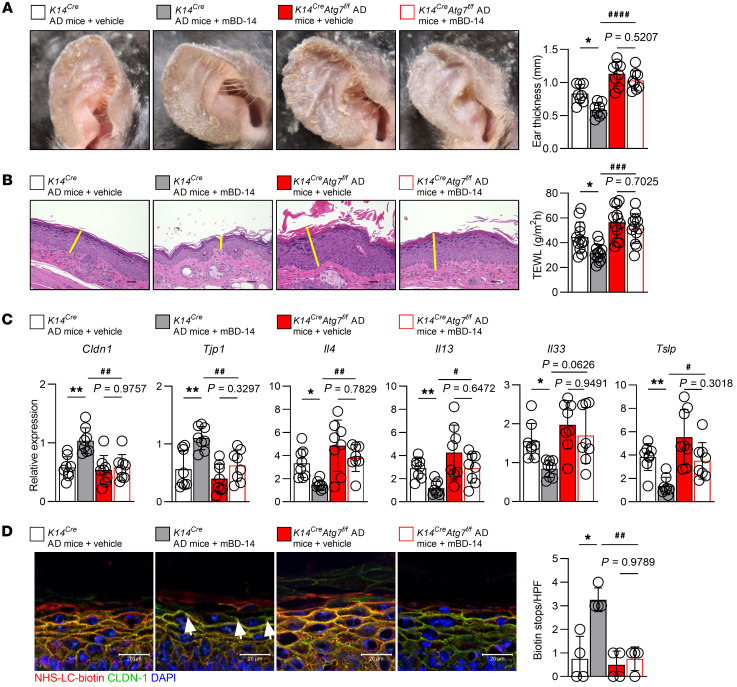
Human β-defensin-3 (hBD-3) exhibits antimicrobial and immunomodulatory activities; however, its contribution to autophagy regulation remains unclear, and the role of autophagy in the regulation of the epidermal barrier in atopic dermatitis (AD) is poorly understood. Here, keratinocyte autophagy was restrained in the skin lesions of patients with AD and murine models of AD. Interestingly, hBD-3 alleviated the IL-4- and IL-13-mediated impairment of the tight junction (TJ) barrier through keratinocyte autophagy activation, which involved aryl hydrocarbon receptor (AhR) signaling. While autophagy deficiency impaired the epidermal barrier and exacerbated inflammation, hBD-3 attenuated skin inflammation and enhanced the TJ barrier in AD. Importantly, hBD-3-mediated improvement of the TJ barrier was abolished in autophagy-deficient AD mice and in AhR-suppressed AD mice, suggesting a role for hBD-3-mediated autophagy in the regulation of the epidermal barrier and inflammation in AD. Thus, autophagy contributes to the pathogenesis of AD, and hBD-3 could be used for therapeutic purposes.

Keywords: Autophagy; Defensins; Dermatology; Inflammation; Tight junctions.


Conflict of interest statement

Conflict of interest: The authors have declared that no conflict of interest exists.

Figures

Figure 1
Figure 1. Autophagy-related proteins are dysregulated in AD skin lesions.
(A) Immunofluorescence staining of LC3 and p62 in the epidermis of patients with AD and normal participants. Representative immunofluorescence images of skin (left) and quantification of the staining intensity in the epidermis (right). The white dashed line indicates the basement membrane between the epidermis and dermis. Scale bars: 50 or 100 μm; n = 5 per group. (B) Immunofluorescence staining of LC3 and p62 in the epidermis of DNCB-treated AD mice and normal mice. Representative immunofluorescence images of skin (left) and quantification of the staining intensity in the epidermis (right). The white dashed line indicates the basement membrane between the epidermis and dermis. Scale bars: 20 μm; n = 3–6 per group. (C) Expression of p62 and LC3 in the back skins of DNCB-induced AD mice and normal mice; n = 6 per group. Representative immunoblots of the indicated proteins from mouse skin lysates (left) and quantification of the band intensities of LC3 and p62 (right). GAPDH was used as a loading control. (D) Representative electron microscopic images of keratinocytes in lesional skin from DNCB-induced AD mice and keratinocytes in normal mouse skin (left) and quantification of autophagic vacuoles (right). The yellow arrowheads indicate autophagic vacuoles. Scale bars: 5 μm. Mean ± SD. *P < 0.05, **P < 0.01, ***P < 0.001, #P < 0.05, ##P < 0.01, §§P < 0.01. Statistical significance was determined by 2-tailed Student’s t test. All of the data are representative of 3 independent experiments.
Figure 2
Figure 2. Th2-derived cytokines are involved in the inactivation of autophagy in AD keratinocytes.
(AC) Keratinocytes were stimulated for 12 hours with 100 ng/mL IL-4 or IL-13 alone or in combination in the presence (+) or absence (–) of 10 μg/mL E&P; n = 3 per group. Representative p62 and LC3 immunoblots (left) and quantification of band intensities (right). GAPDH was used as a loading control. (D) Keratinocytes were stimulated for 12 hours with or without IL-4 or IL-13 alone or in combination in the presence of 10 μM rapamycin (Rap); n = 5 per group. Representative immunofluorescence images (left) and quantification of LC3 puncta in keratinocytes (right). Scale bars: 10 μm. Mean ± SD. *P < 0.05, **P < 0.01, ****P < 0.0001, #P < 0.05, ###P < 0.001, ####P < 0.0001. Statistical significance was determined by 2-tailed Student’s t test or 1-way ANOVA with Tukey’s multiple-comparison test. All of the data are representative of 3 independent experiments.
Figure 3
Figure 3. Keratinocyte-specific deficiency of autophagy exacerbates AD.
(A) Body weight (left) and TEWL (right) of K14Cre mice and K14Cre Atg7fl/fl mice from day 10 to day 40. (B) Representative immunofluorescence images (left) and quantification of the indicated proteins (right) from newborn mice and young adult mice at day 42; n = 3 per group. Scale bars: 20 μm. (C) Evaluation of dermatitis score, ear thickness, and TEWL in mouse ears and backs on day 19. *P < 0.05, **P < 0.01, ***P < 0.001, ****P < 0.0001, #P < 0.05, ##P < 0.01, ####P < 0.0001, §§ P < 0.01. Statistical significance was determined by 2-tailed Student’s t test. All of the data are representative of 3 independent experiments.
Figure 4
Figure 4. hBD-3–induced autophagy improves TJ barrier function in keratinocytes through AhR signaling.
(A and B) Keratinocytes were treated with 10 μg/mL hBD-3 or vehicle control (–) for 9 hours. (A) Representative immunofluorescence images (left) and quantification of LC3 puncta (right); n = 4 per group. Scale bars: 5 μm. (B) Representative electron microscopic images (left) and quantification of autophagic areas (right); n = 10 per group. Scale bars: 10 μm. The yellow arrowheads indicate autophagic vacuoles. (C) Keratinocytes were transfected with adenoviruses carrying Atg3 or mutant Atg3C264S for 48 hours and then treated with 10 μg/mL hBD-3 for 9 hours. Representative immunofluorescence images (left) and quantification of claudin-1 and ZO-1 (right); n = 3 per group. Scale bars: 5 μm. (D) Keratinocyte layers grown on Transwell inserts were transfected with adenoviruses carrying Atg3 or mutant Atg3C264S for 48 hours and then treated with 10 μg/mL hBD-3 for 48 hours, and transepithelial electrical resistance (TER) was assessed by CellZscope. (E) Cells were pretreated with CH-223191 (CH) for 2 hours and then treated with 10 μg/mL hBD-3 for 9 hours. Representative immunoblots of the indicated proteins are shown. Quantification of the band intensities is shown in the right panel; n = 3 per group. (F and G) Keratinocytes were treated with 10 μg/mL hBD-3 or 0.01% acetic acid as a vehicle control for 9 hours. (F) Representative proximity ligation assay images (left) and quantification (right) of the AhR-LC3 and AhR-p62 interactions in keratinocytes with or without AhR siRNA transfection; n = 3 per group. Scale bars: 20 μm. (G) Representative Western blot images (left) and quantification of the band intensities (right) of AhR ubiquitination; n = 3 per group. Mean ± SD. *P < 0.05, **P < 0.01, #P < 0.05, ##P < 0.01, ###P < 0.01. Statistical significance was determined by 2-tailed Student’s t test (A, B, F, and G) and 1-way ANOVA with Tukey’s multiple-comparison test (CE). All of the data are representative of 3 independent experiments.
Figure 5
Figure 5. mBD-14 improves the symptoms of AD mice.
(A) Representative images of ears from mice (left) and quantification of ear thickness (right); n = 4 per group. (B) Representative histological sections of mouse ears stained with H&E (left) and the TEWL of the mouse ears on day 19 (right). The yellow lines indicate the epidermis. Scale bars: 20 μm. (C) Real-time PCR analysis of the indicated genes in mouse ear samples. (D) Representative immunofluorescence images (left) and quantification of biotin tracer stops indicated by white arrowheads in the mouse skin (right); n = 4 per group. Scale bars: 20 μm. (E) Representative immunofluorescence images (left) and quantification of LC3 intensities in the mouse epidermis (right). The white dashed line indicates the basement membrane between the epidermis and dermis; n = 4 per group. Scale bars: 20 μm. Mean ± SD. *P < 0.05, **P < 0.01, ***P < 0.001, ****P < 0.0001, #P < 0.05, ##P < 0.01, ###P < 0.001, ####P < 0.0001. Statistical significance was determined by 1-way ANOVA with Tukey’s multiple-comparison test. All of the data are representative of 3 independent experiments.
Figure 6
Figure 6. Autophagy is required for mBD-14–mediated improvement in AD mice.
(A) Representative images of mouse ears (left) and quantification of ear thickness (right). (B) Representative histological sections of mouse ears stained with H&E (left) and TEWL of mouse ears on day 19 (right). The yellow lines indicate the epidermis. Scale bars: 20 μm. (C) Real-time PCR analysis of the indicated genes in mouse ear samples. (D) Representative immunofluorescence images (left) and quantification of biotin tracer stops indicated by white arrowheads in the mouse skin (right); n = 4 per group. Scale bars: 20 μm. Mean ± SD. *P < 0.05, **P < 0.01, #P < 0.05, ##P < 0.01, ###P < 0.001, ####P < 0.0001. Statistical significance was determined by 1-way ANOVA with Tukey’s multiple-comparison test. All of the data are representative of 3 independent experiments.
Figure 7
Figure 7. AhR signaling is required for mBD-14–mediated improvement in AD mice.
(A) Representative images of mouse ears (left) and quantification of ear thickness (right). (B) Representative histological sections of mouse ears stained with H&E (left) and TEWL of mouse ears on day 19 (right). The yellow lines indicate the epidermis; n = 8 per group. Scale bars: 20 μm. (C) Real-time PCR analysis of the indicated genes in mouse ear samples; n = 8 per group. (D) Representative immunofluorescence images (left) and quantification of biotin tracer stops indicated by white arrowheads in the mouse skin (right); n = 4 per group. Scale bars: 20 μm. Mean ± SD. *P < 0.05, **P < 0.01, ***P < 0.001, #P < 0.05, ##P < 0.01, ####P < 0.0001. Statistical significance was determined by 2-way ANOVA with Tukey’s multiple-comparison test. All of the data are representative of 3 independent experiments.

References

    1. Langan SM, et al. Atopic dermatitis. Lancet. 2020;396(10247):345–360. doi: 10.1016/S0140-6736(20)31286-1. - DOI - PubMed
    1. Egawa G, Kabashima K. Multifactorial skin barrier deficiency and atopic dermatitis: essential topics to prevent the atopic march. J Allergy Clin Immunol. 2016;138(2):350–358. doi: 10.1016/j.jaci.2016.06.002. - DOI - PubMed
    1. Elias PM, Steinhoff M. “Outside-to-inside” (and now back to “outside”) pathogenic mechanisms in atopic dermatitis. J Invest Dermatol. 2008;128(5):1067–1070. doi: 10.1038/jid.2008.88. - DOI - PMC - PubMed
    1. Elias PM, et al. Basis for the barrier abnormality in atopic dermatitis: outside-inside-outside pathogenic mechanisms. J Allergy Clin Immunol. 2008;121(6):1337–1343. doi: 10.1016/j.jaci.2008.01.022. - DOI - PMC - PubMed
    1. Klionsky DJ, et al. Guidelines for the use and interpretation of assays for monitoring autophagy (4th edition) Autophagy. 2021;17(1):1–382. doi: 10.1080/15548627.2020.1797280. - DOI - PMC - PubMed

Publication types