

Polygenic and socioeconomic risk for high body mass index: 69 years of follow-up across life
- PMID: 35834443
- PMCID: PMC9282556
- DOI: 10.1371/journal.pgen.1010233
Polygenic and socioeconomic risk for high body mass index: 69 years of follow-up across life
Abstract
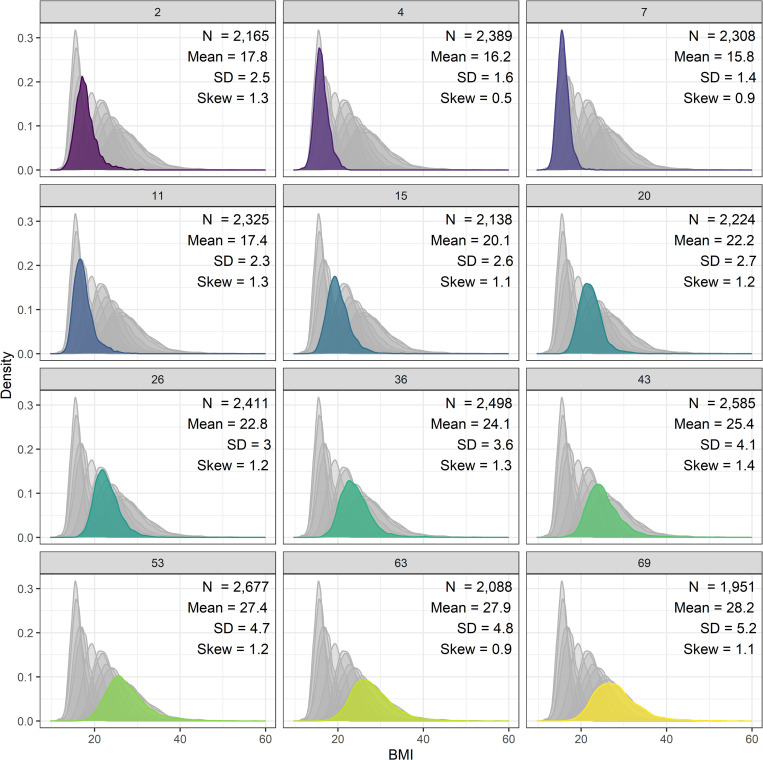
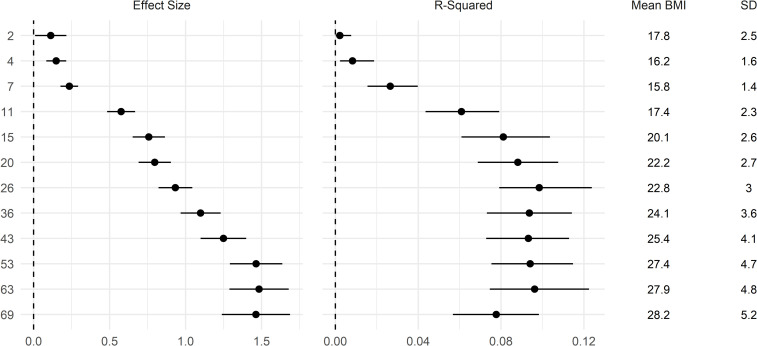
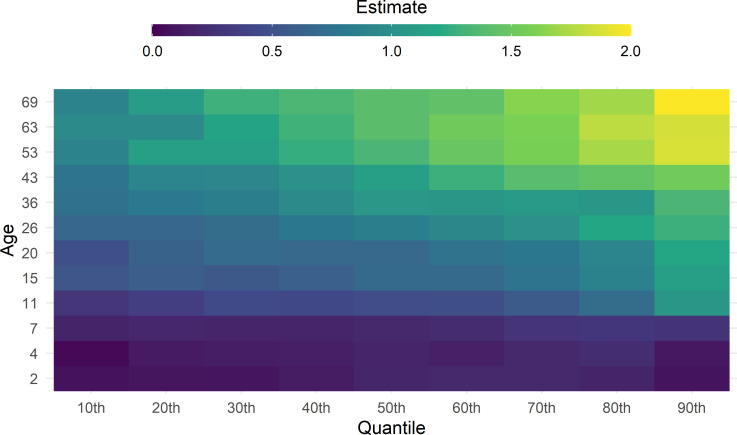
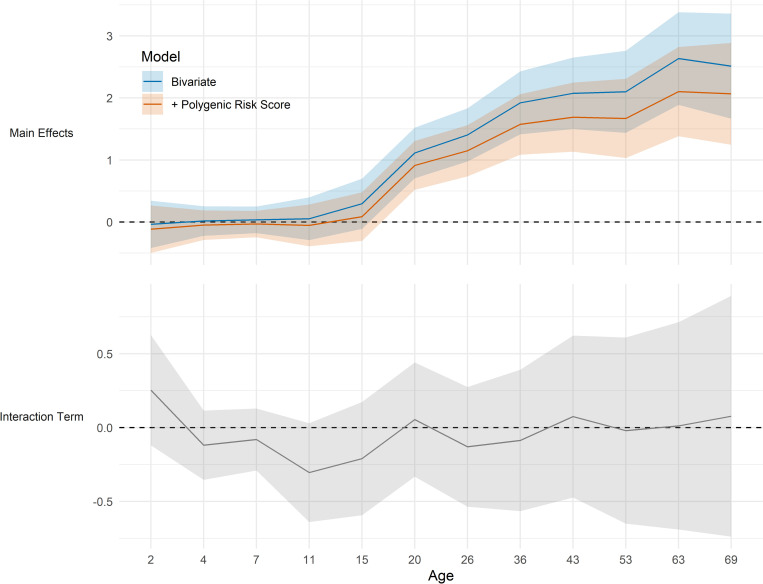
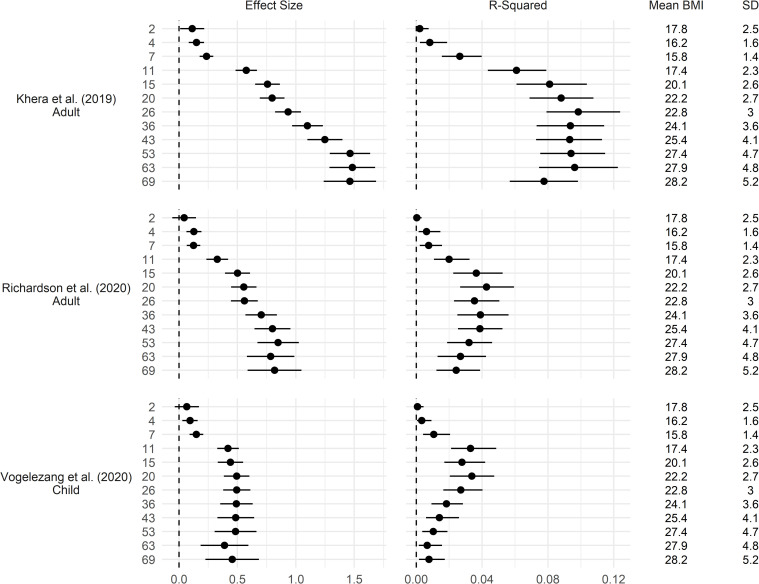
Genetic influences on body mass index (BMI) appear to markedly differ across life, yet existing research is equivocal and limited by a paucity of life course data. We thus used a birth cohort study to investigate differences in association and explained variance in polygenic risk for high BMI across infancy to old age (2-69 years). A secondary aim was to investigate how the association between BMI and a key purported environmental determinant (childhood socioeconomic position) differed across life, and whether this operated independently and/or multiplicatively of genetic influences. Data were from up to 2677 participants in the MRC National Survey of Health and Development, with measured BMI at 12 timepoints from 2-69 years. We used multiple polygenic indices from GWAS of adult and childhood BMI, and investigated their associations with BMI at each age. For polygenic liability to higher adult BMI, the trajectories of effect size (β) and explained variance (R2) diverged: explained variance peaked in early adulthood and plateaued thereafter, while absolute effect sizes increased throughout adulthood. For polygenic liability to higher childhood BMI, explained variance was largest in adolescence and early adulthood; effect sizes were marginally smaller in absolute terms from adolescence to adulthood. All polygenic indices were related to higher variation in BMI; quantile regression analyses showed that effect sizes were sizably larger at the upper end of the BMI distribution. Socioeconomic and polygenic risk for higher BMI across life appear to operate additively; we found little evidence of interaction. Our findings highlight the likely independent influences of polygenic and socioeconomic factors on BMI across life. Despite sizable associations, the BMI variance explained by each plateaued or declined across adulthood while BMI variance itself increased. This is suggestive of the increasing importance of chance ('non-shared') environmental influences on BMI across life.
Conflict of interest statement
The authors have declared that no competing interests exist.
Figures
Similar articles
-
Socioeconomic inequalities in childhood and adolescent body-mass index, weight, and height from 1953 to 2015: an analysis of four longitudinal, observational, British birth cohort studies.Lancet Public Health. 2018 Apr;3(4):e194-e203. doi: 10.1016/S2468-2667(18)30045-8. Epub 2018 Mar 21. Lancet Public Health. 2018. PMID: 29571937 Free PMC article.
-
Socioeconomic disadvantage and polygenic risk for high BMI magnify obesity risk across childhood: a longitudinal, population, cohort study.Lancet Glob Health. 2023 Mar;11 Suppl 1:S9-S10. doi: 10.1016/S2214-109X(23)00094-3. Lancet Glob Health. 2023. PMID: 36866486
-
Can adult polygenic scores improve prediction of body mass index in childhood?Int J Obes (Lond). 2022 Jul;46(7):1375-1383. doi: 10.1038/s41366-022-01130-2. Epub 2022 May 3. Int J Obes (Lond). 2022. PMID: 35505076
-
Early socioeconomic position and blood pressure in childhood and adulthood: the Cardiovascular Risk in Young Finns Study.Hypertension. 2006 Jan;47(1):39-44. doi: 10.1161/01.HYP.0000196682.43723.8a. Epub 2005 Dec 5. Hypertension. 2006. PMID: 16330678
-
Life course BMI trajectories from childhood to mid-adulthood are differentially associated with anxiety and depression outcomes in middle age.Int J Obes (Lond). 2023 Aug;47(8):661-668. doi: 10.1038/s41366-023-01312-6. Epub 2023 May 9. Int J Obes (Lond). 2023. PMID: 37161067 Free PMC article. Review.
Cited by
-
Common infections and neuroimaging markers of dementia in three UK cohort studies.Alzheimers Dement. 2024 Mar;20(3):2128-2142. doi: 10.1002/alz.13613. Epub 2024 Jan 22. Alzheimers Dement. 2024. PMID: 38248636 Free PMC article.
-
Utility of polygenic scores across diverse diseases in a hospital cohort for predictive modeling.Nat Commun. 2024 Apr 12;15(1):3168. doi: 10.1038/s41467-024-47472-5. Nat Commun. 2024. PMID: 38609356 Free PMC article.
-
Trans-ethnic polygenic risk scores for body mass index: An international hundred K+ cohorts consortium study.Clin Transl Med. 2023 Jun;13(6):e1291. doi: 10.1002/ctm2.1291. Clin Transl Med. 2023. PMID: 37337639 Free PMC article.
-
Causal effect of body mass index on herpes zoster and postherpetic neuralgia: A Mendelian randomization study.Medicine (Baltimore). 2025 Jun 6;104(23):e42775. doi: 10.1097/MD.0000000000042775. Medicine (Baltimore). 2025. PMID: 40489821 Free PMC article.
-
Lifestyle choices mediate the association between educational attainment and BMI in older adults in China: A cross-sectional study.Front Public Health. 2022 Oct 26;10:1000953. doi: 10.3389/fpubh.2022.1000953. eCollection 2022. Front Public Health. 2022. PMID: 36388355 Free PMC article.
References
-
- Ng M, Fleming T, Robinson M, et al., Murray CJ, Gakidou E. Global, regional, and national prevalence of overweight and obesity in children and adults during 1980–2013: a systematic analysis for the Global Burden of Disease Study 2013. Lancet. 2014;384(9945):766–81. doi: 10.1016/S0140-6736(14)60460-8 - DOI - PMC - PubMed
Publication types
MeSH terms
Grants and funding
LinkOut - more resources
Full Text Sources
