

Therapeutic induction of Bcl2-associated athanogene 3-mediated autophagy in idiopathic pulmonary fibrosis
- PMID: 35834635
- PMCID: PMC9282656
- DOI: 10.1002/ctm2.935
Therapeutic induction of Bcl2-associated athanogene 3-mediated autophagy in idiopathic pulmonary fibrosis
Abstract
Background: Exaggerated fibroblast proliferation is a well-known feature in idiopathic pulmonary fibrosis (IPF) which may be - in part - due to insufficient autophagy, a lysosome dependent cellular surveillance pathway. Bcl2-associated athanogene 3 (BAG3) is a pivotal co-chaperone of the autophagy pathway. Here, we studied whether therapeutic modulation of BAG3-mediated autophagy can rescue insufficient autophagy and impact IPF fibroblast proliferation.
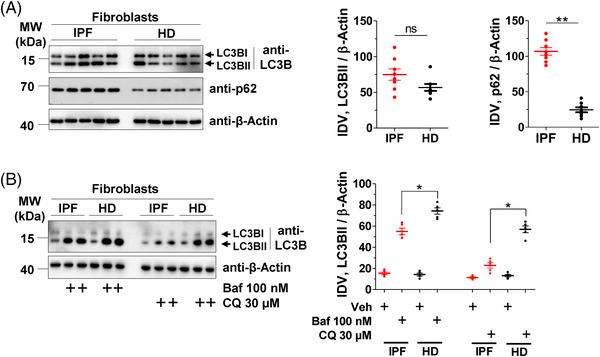
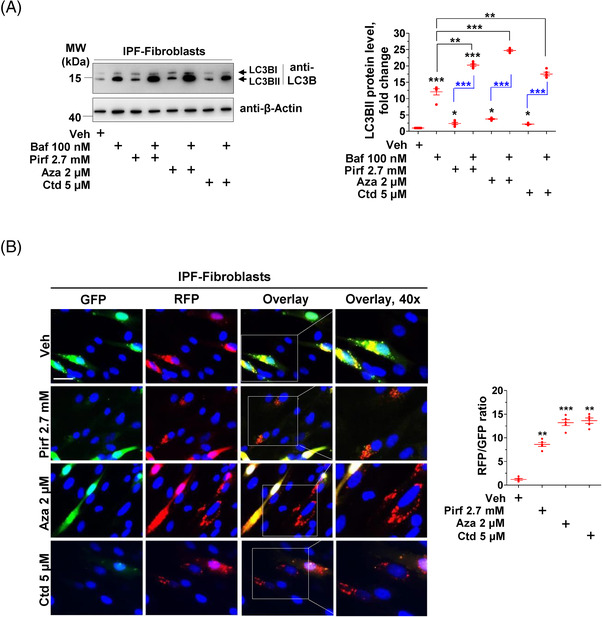
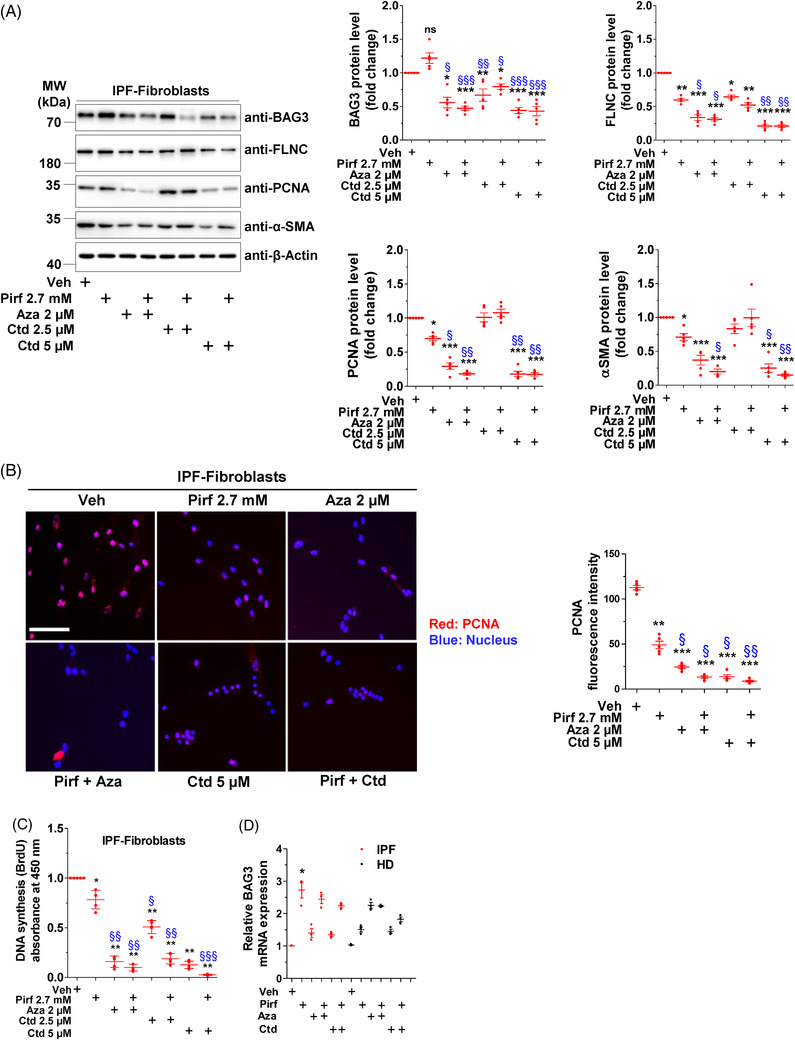
Methods: Primary interstitial fibroblasts or precision cut lung slices (PCLS) of IPF lungs were treated with (1) the antifibrotic drug pirfenidone (Pirf), (2) the demethylating agent 5-azacytidine (Aza), (3) the BAG3 modulator cantharidin (Ctd). Autophagy flux was measured following pretreatment with the autophagy inhibitors or by GFP-RFP-LC3B transfection followed by drug treatments. Proliferation was measured by 5-bromo-2'-deoxyuridine assay. BAG3, filamin C (FLNC), proliferating-cell-nuclear-antigen (PCNA), collagen1A1 (COL1A1) and autophagy proteins were assessed by immunoblotting or immunofluorescence. Loss of function experiments were performed by siRNA mediated knockdown of BAG3.
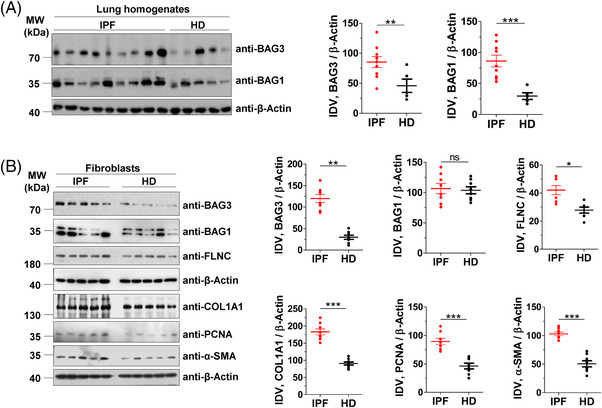
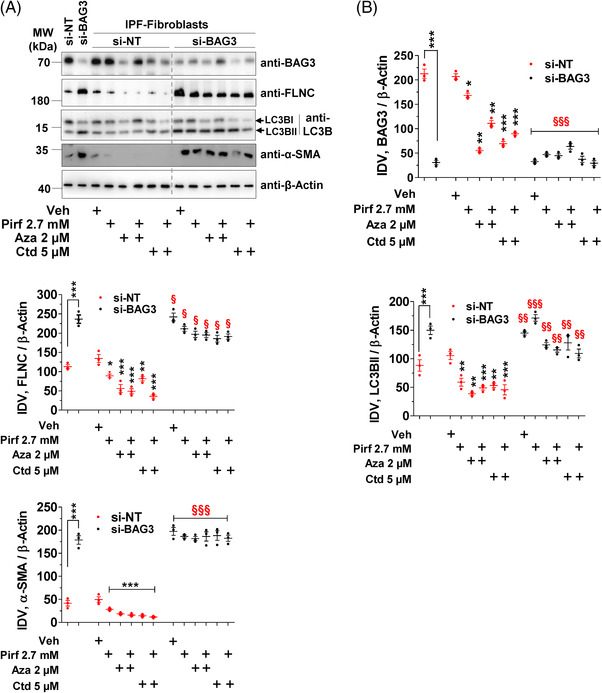
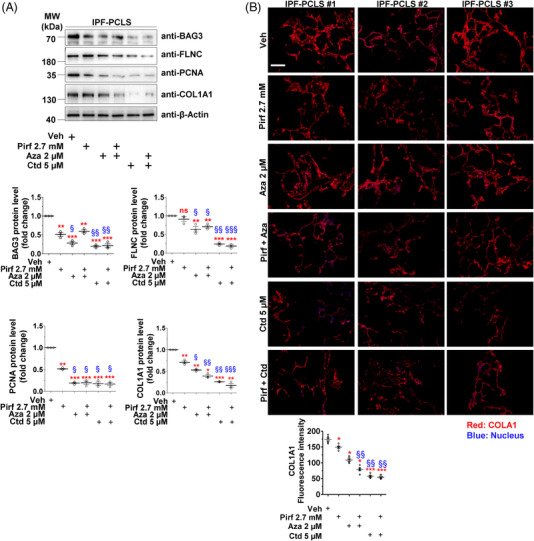
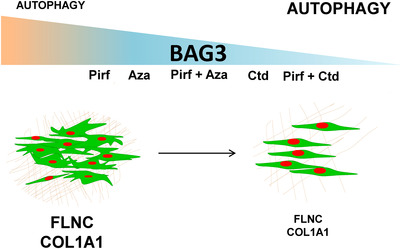
Results: In comparison with healthy donors, increased BAG3 protein was observed in IPF lung homogenates and IPF fibroblasts. In addition, the substrate of BAG3-mediated autophagy, FLNC, was increased in IPF fibroblasts, implying insufficient activation of BAG3-dependent autophagy. Therapeutic modulation of this pathway using Aza and Ctd alone or in combination with the IPF therapy drug Pirf rescued the insufficient BAG3-mediated autophagy and decreased fibroblast proliferation. Such effects were observed upon therapeutic modulation of BAG3 but not upon knock down of BAG3 per se in IPF fibroblasts. Similarly, PCLS of IPF patients showed a significant decrease in collagen deposition in response to these drugs, either alone or in a more potent form in combination with Pirf.
Conclusions: Our study reveals that repurposing drugs that modulate autophagy regulating proteins render therapeutic benefits in IPF. Fine tuning of this pathway may hence signify a promising therapeutic strategy to ameliorate antifibrotic properties and augment the efficacy of current IPF therapy.
Keywords: 5-azacytidine; BAG3; autophagy; cantharidin; fibroblasts; filamin C; idiopathic pulmonary fibrosis; pirfenidone.
© 2022 The Authors. Clinical and Translational Medicine published by John Wiley & Sons Australia, Ltd on behalf of Shanghai Institute of Clinical Bioinformatics.
Conflict of interest statement
The authors declare no conflicts of interest.
Figures
Similar articles
-
BAG3: An enticing therapeutic target for idiopathic pulmonary fibrosis.J Cell Biochem. 2024 Nov;125(11):e30446. doi: 10.1002/jcb.30446. Epub 2023 Jul 14. J Cell Biochem. 2024. PMID: 37450692
-
CD148 Deficiency in Fibroblasts Promotes the Development of Pulmonary Fibrosis.Am J Respir Crit Care Med. 2021 Aug 1;204(3):312-325. doi: 10.1164/rccm.202008-3100OC. Am J Respir Crit Care Med. 2021. PMID: 33784491 Free PMC article.
-
Comparison of the antifibrotic effects of the pan-histone deacetylase-inhibitor panobinostat versus the IPF-drug pirfenidone in fibroblasts from patients with idiopathic pulmonary fibrosis.PLoS One. 2018 Nov 27;13(11):e0207915. doi: 10.1371/journal.pone.0207915. eCollection 2018. PLoS One. 2018. PMID: 30481203 Free PMC article.
-
MicroRNA regulation of BAG3.Exp Biol Med (Maywood). 2022 Apr;247(8):617-623. doi: 10.1177/15353702211066908. Epub 2022 Jan 15. Exp Biol Med (Maywood). 2022. PMID: 35037515 Free PMC article. Review.
-
Oxidative/nitrosative stress, autophagy and apoptosis as therapeutic targets of melatonin in idiopathic pulmonary fibrosis.Expert Opin Ther Targets. 2018 Dec;22(12):1049-1061. doi: 10.1080/14728222.2018.1541318. Epub 2018 Nov 16. Expert Opin Ther Targets. 2018. PMID: 30445883 Review.
Cited by
-
Transcriptomic profiles of single-cell autophagy-related genes (ATGs) in lung diseases.Cell Biol Toxicol. 2025 Feb 7;41(1):40. doi: 10.1007/s10565-025-09990-w. Cell Biol Toxicol. 2025. PMID: 39920481 Free PMC article.
-
Cardiac fibroblast BAG3 regulates TGFBR2 signaling and fibrosis in dilated cardiomyopathy.J Clin Invest. 2025 Jan 2;135(1):e181630. doi: 10.1172/JCI181630. J Clin Invest. 2025. PMID: 39744939 Free PMC article.
-
BAG3 promotes autophagy and suppresses NLRP3 inflammasome activation in Parkinson's disease.Ann Transl Med. 2022 Nov;10(22):1218. doi: 10.21037/atm-22-5159. Ann Transl Med. 2022. PMID: 36544667 Free PMC article.
-
Construction and experimental validation of a macrophage cell senescence-related gene signature to evaluate the prognosis, immunotherapeutic sensitivity, and chemotherapy response in bladder cancer.Funct Integr Genomics. 2023 Jul 10;23(3):228. doi: 10.1007/s10142-023-01163-4. Funct Integr Genomics. 2023. PMID: 37423913
-
Different Levels of Autophagy Activity in Mesenchymal Stem Cells Are Involved in the Progression of Idiopathic Pulmonary Fibrosis.Stem Cells Int. 2024 Feb 15;2024:3429565. doi: 10.1155/2024/3429565. eCollection 2024. Stem Cells Int. 2024. PMID: 38390035 Free PMC article. Review.
References
Publication types
MeSH terms
Substances
LinkOut - more resources
Full Text Sources
Miscellaneous