. 2022 Aug 1;19(8):2776-2794.
doi: 10.1021/acs.molpharmaceut.2c00148. Epub 2022 Jul 14.

Effect of Paclitaxel Stereochemistry on X-ray-Triggered Release of Paclitaxel from CaWO4/Paclitaxel-Coloaded PEG-PLA Nanoparticles

Affiliations

Effect of Paclitaxel Stereochemistry on X-ray-Triggered Release of Paclitaxel from CaWO4/Paclitaxel-Coloaded PEG-PLA Nanoparticles

Kaustabh Sarkar et al. Mol Pharm. .

Erratum in

Abstract

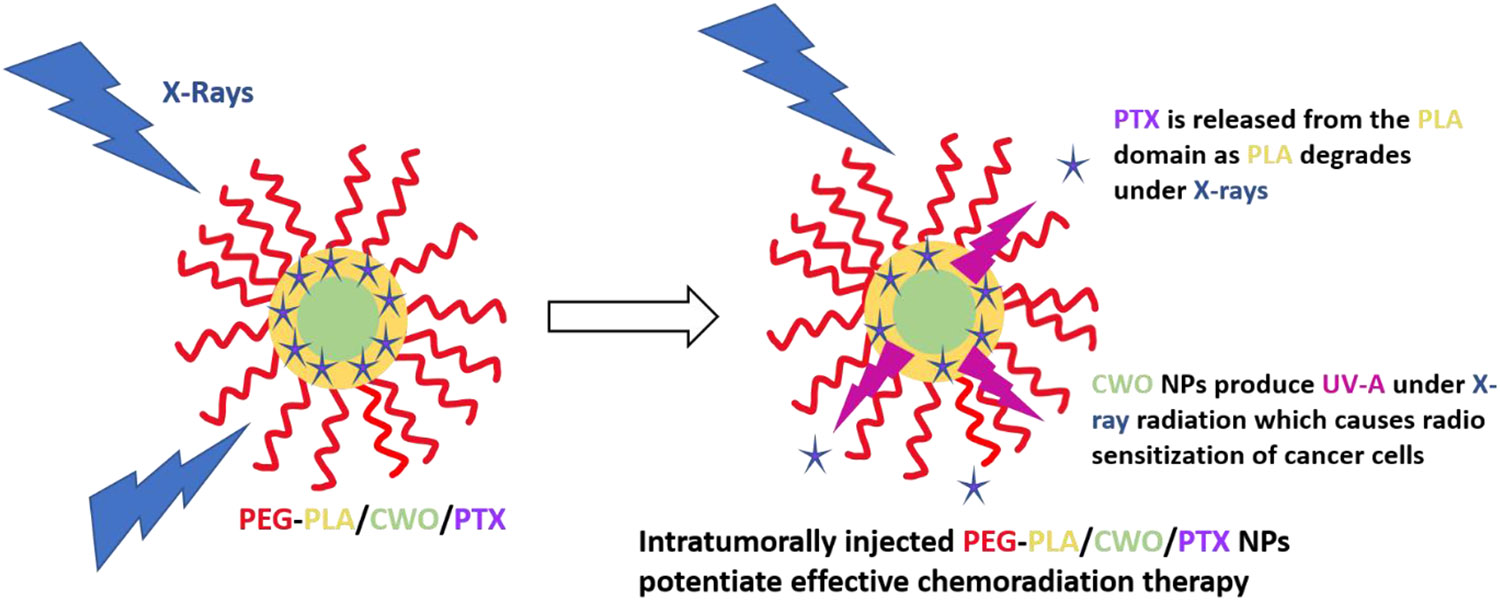
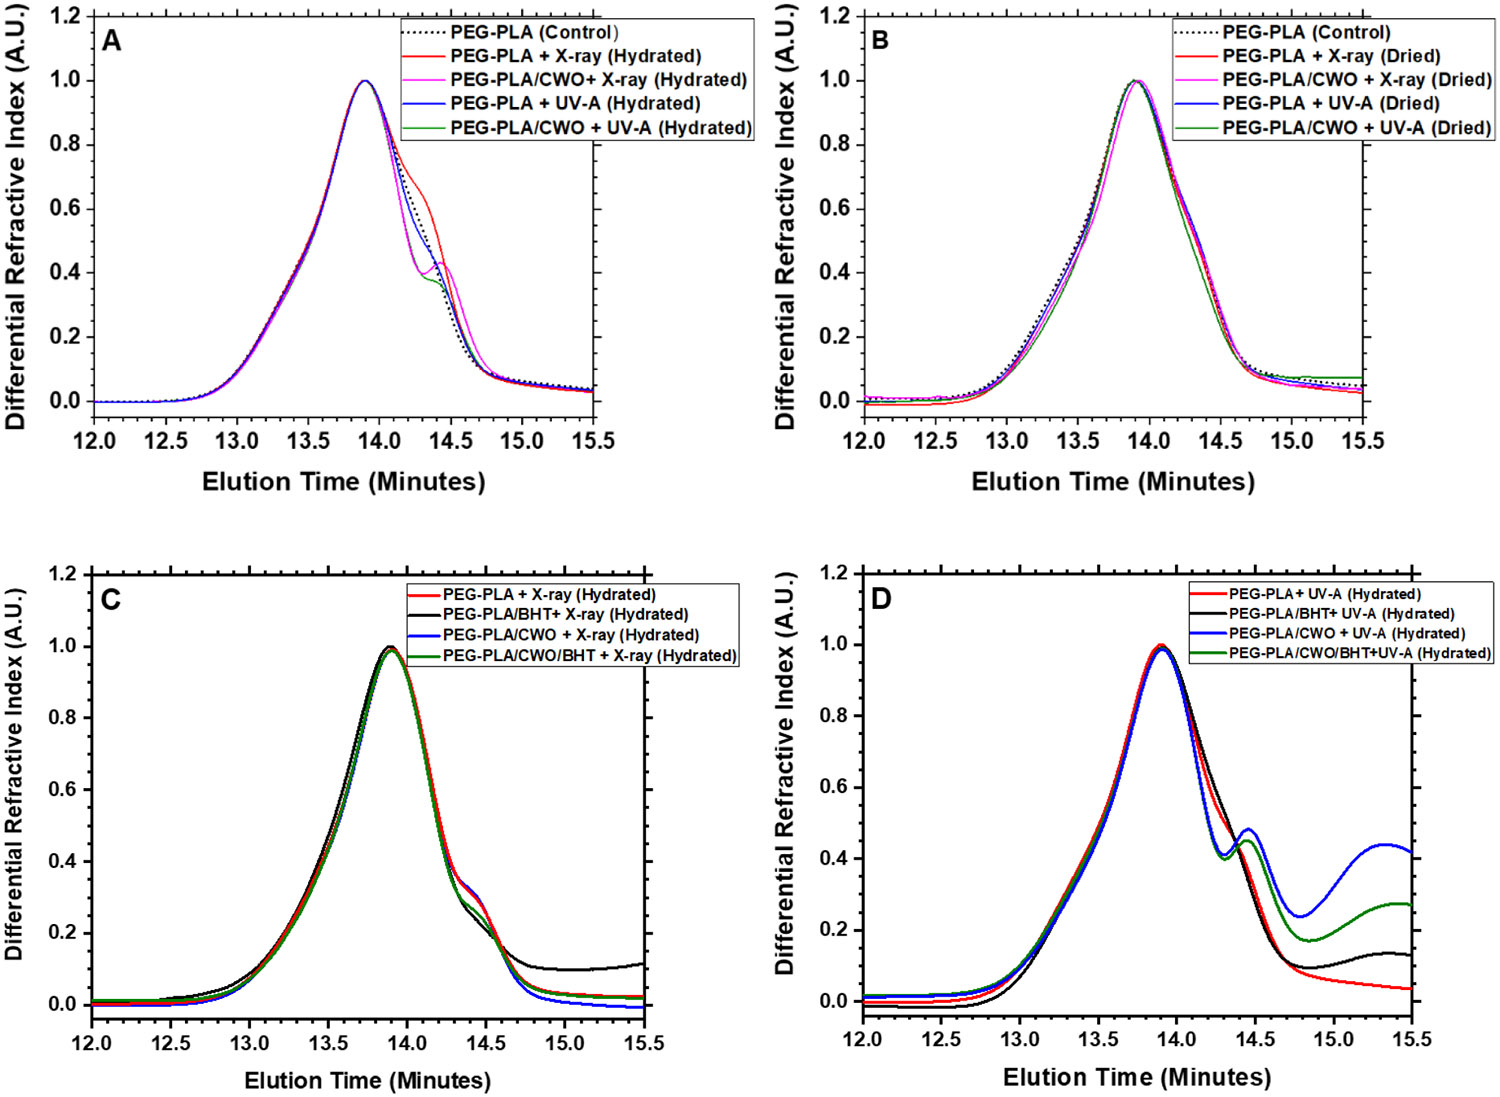
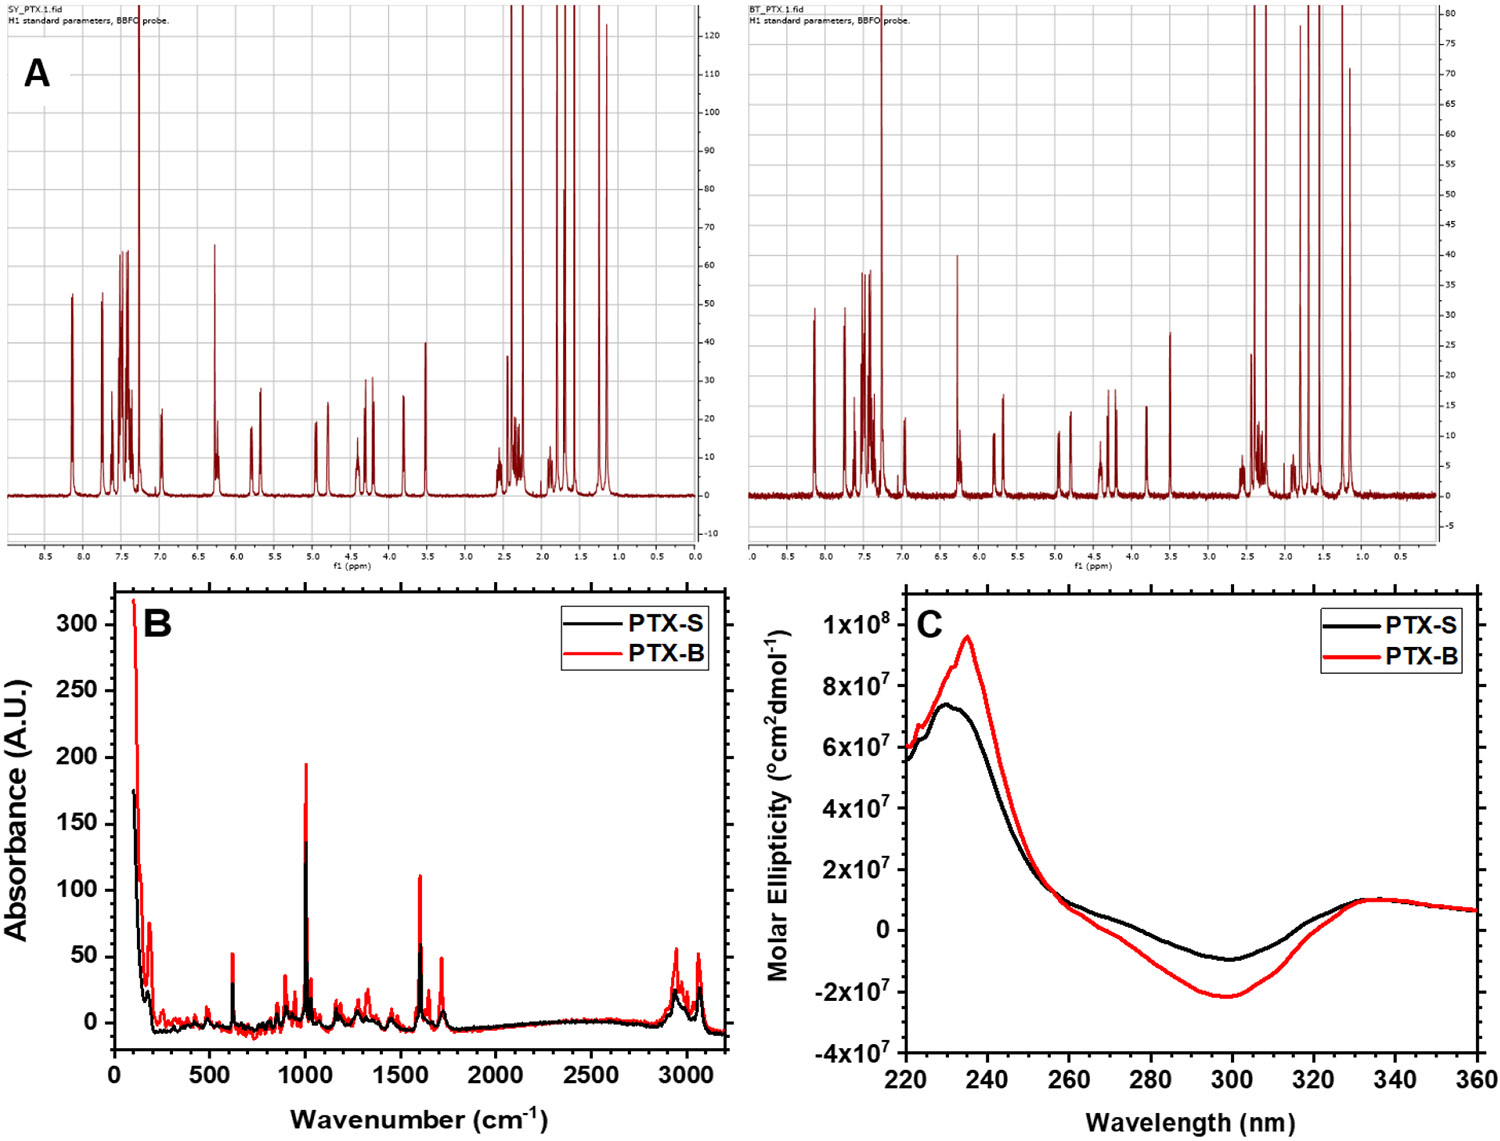
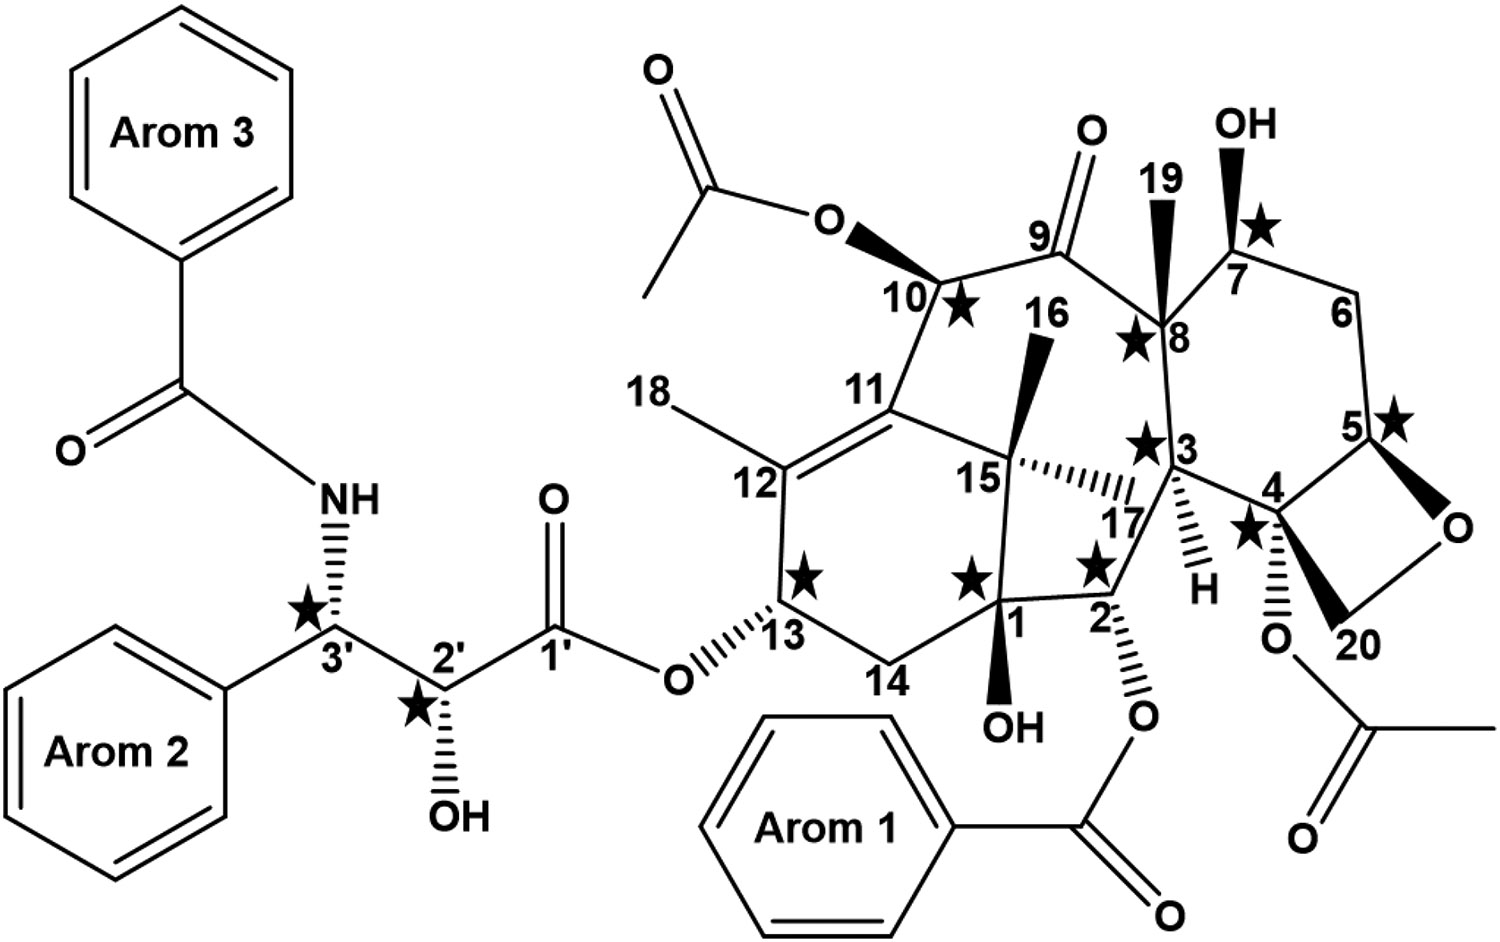
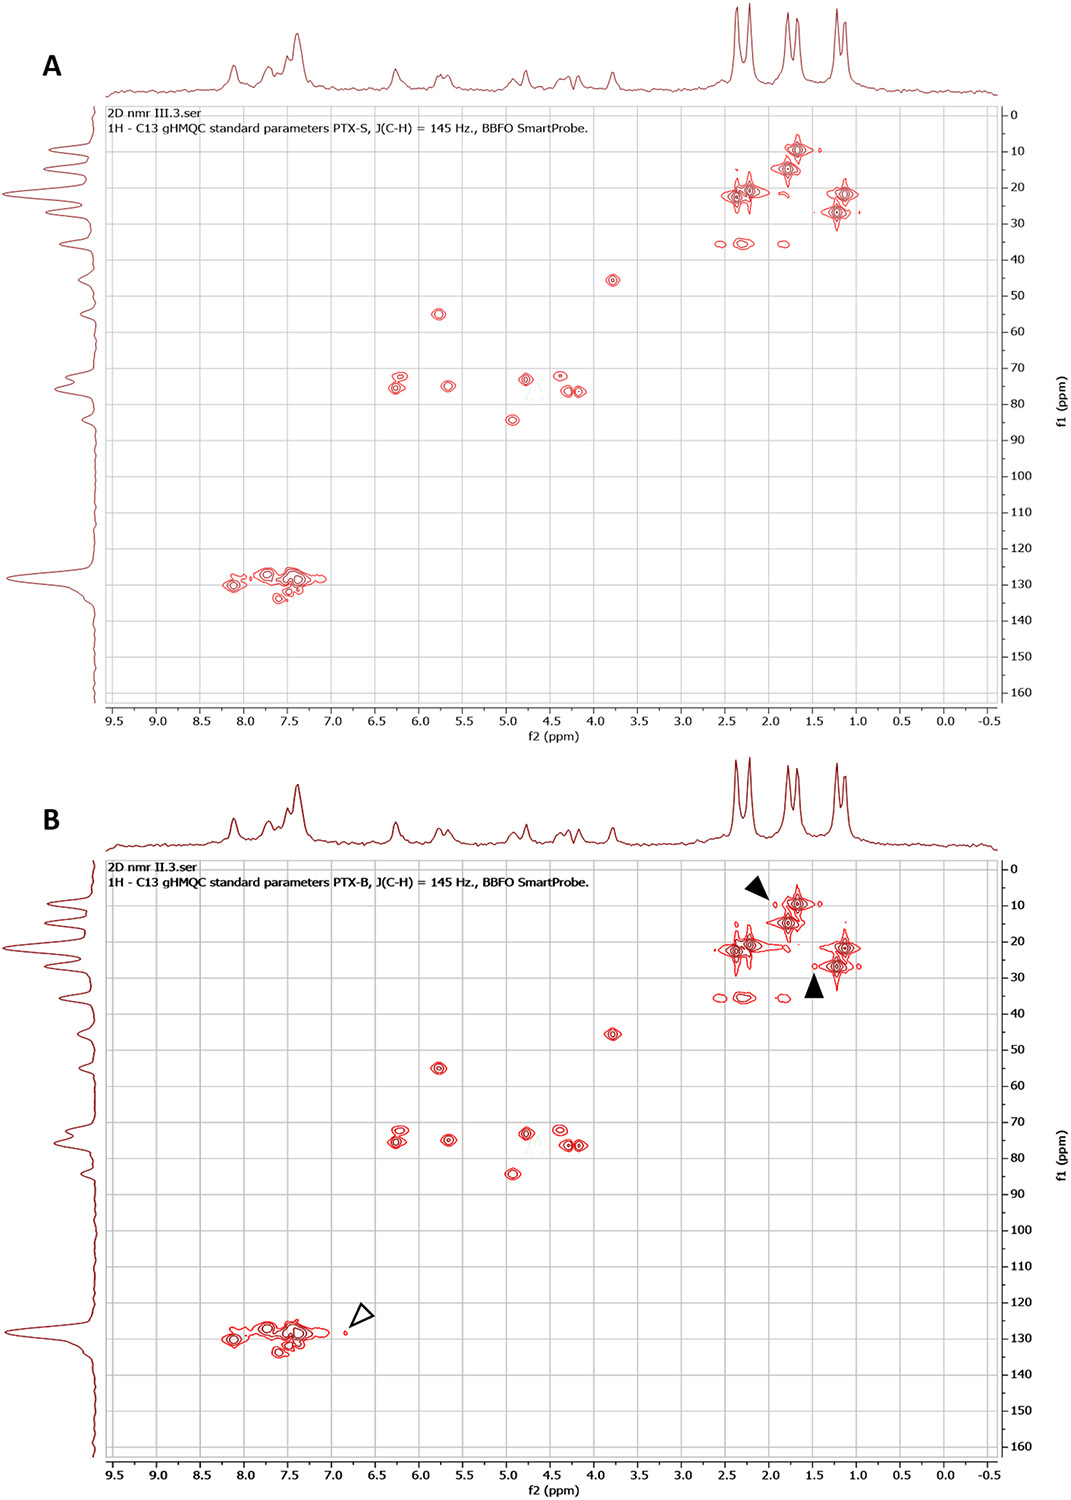
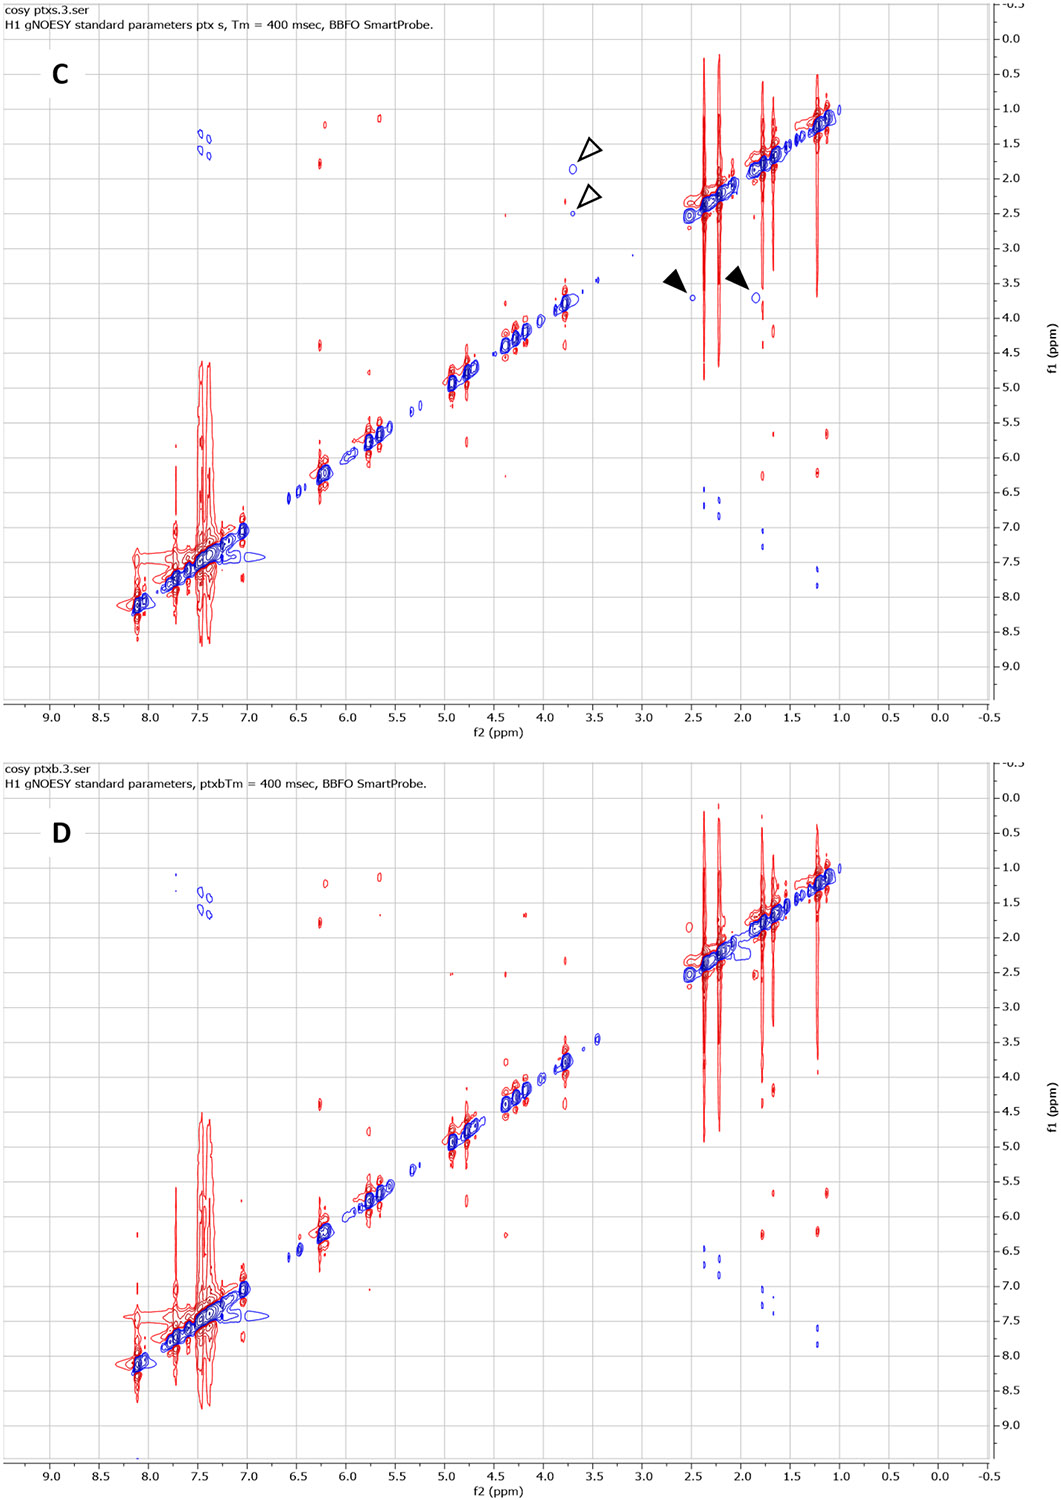
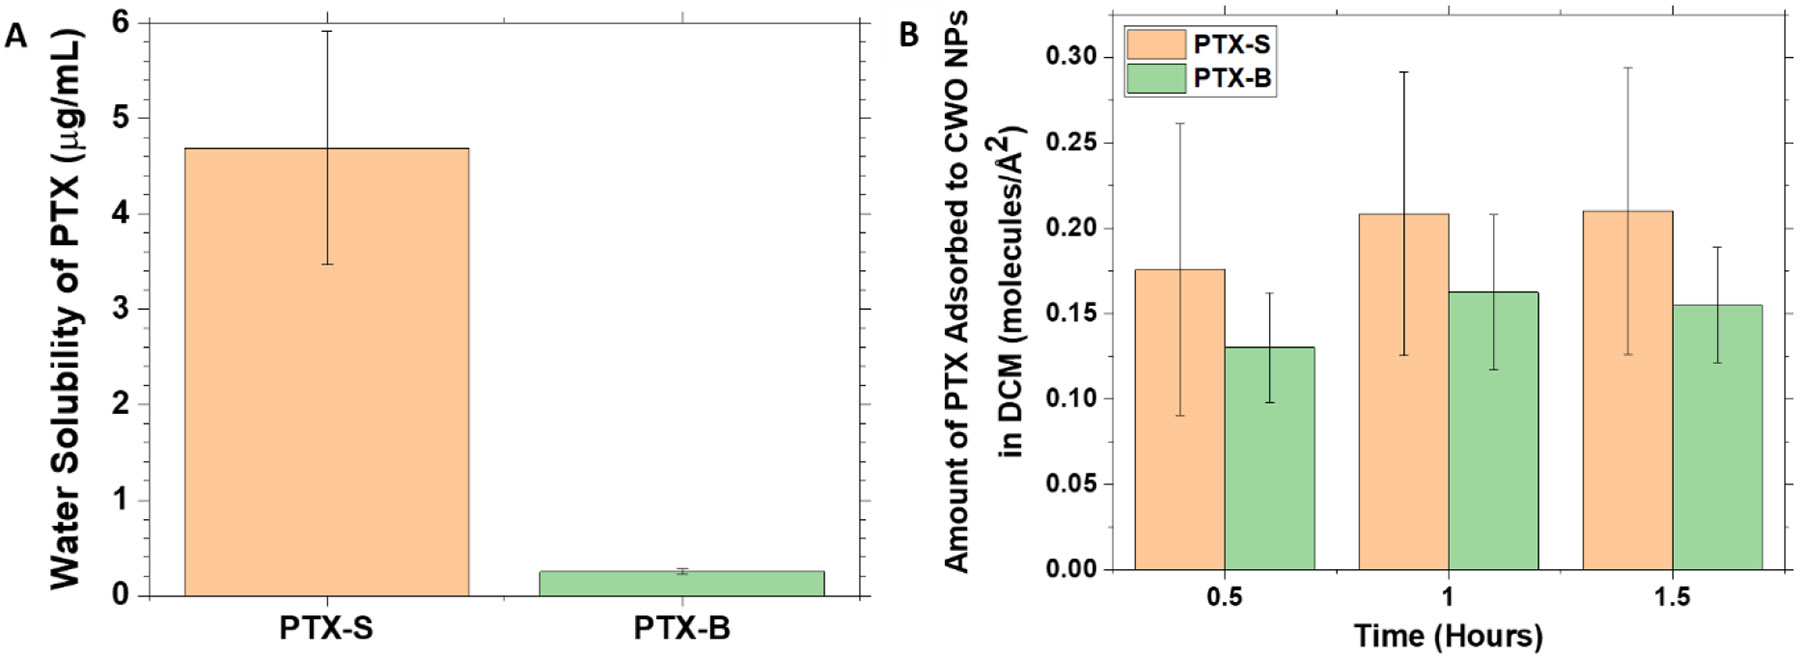
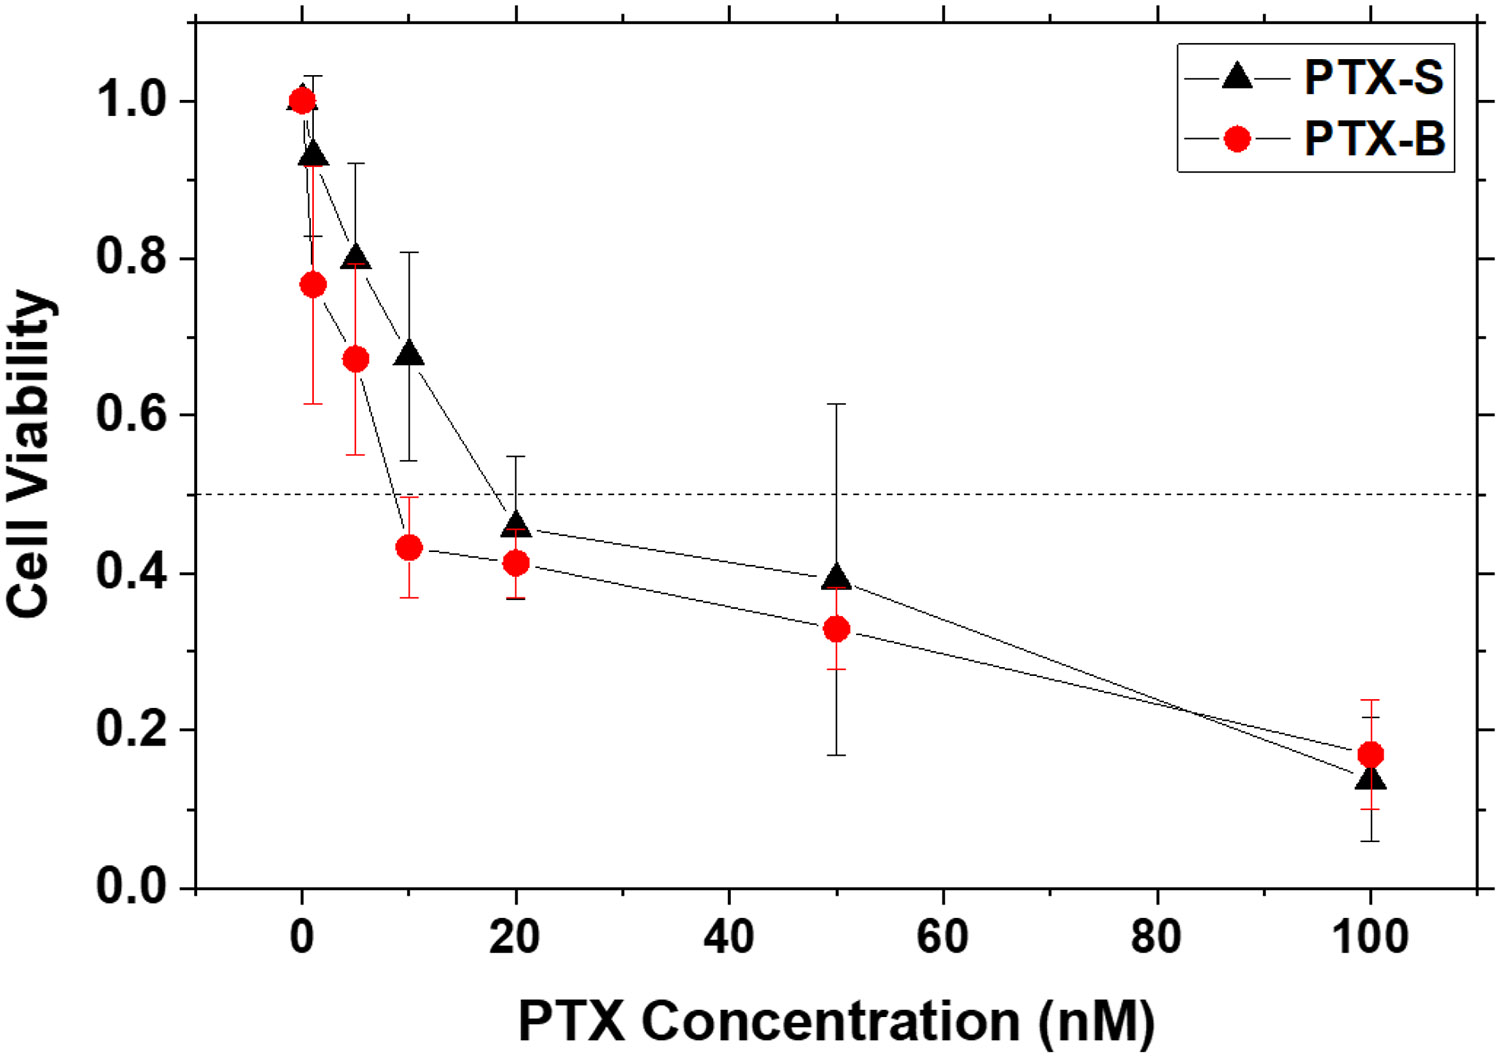
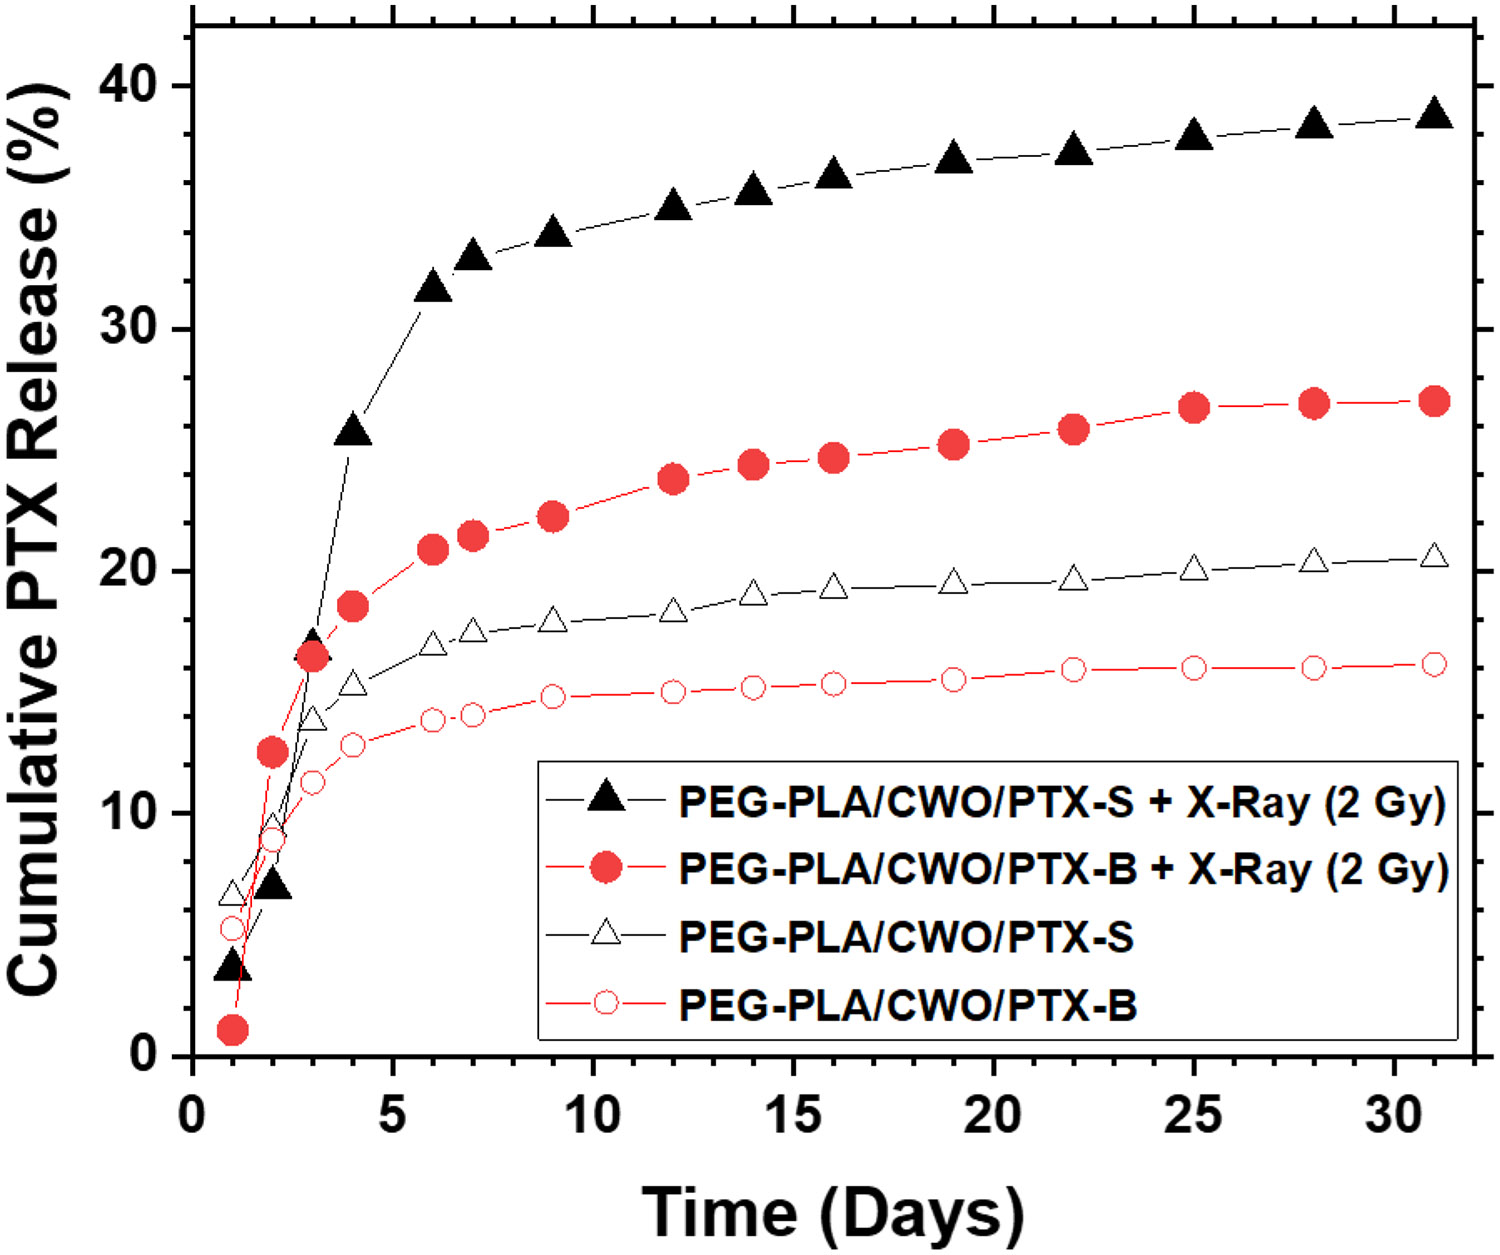
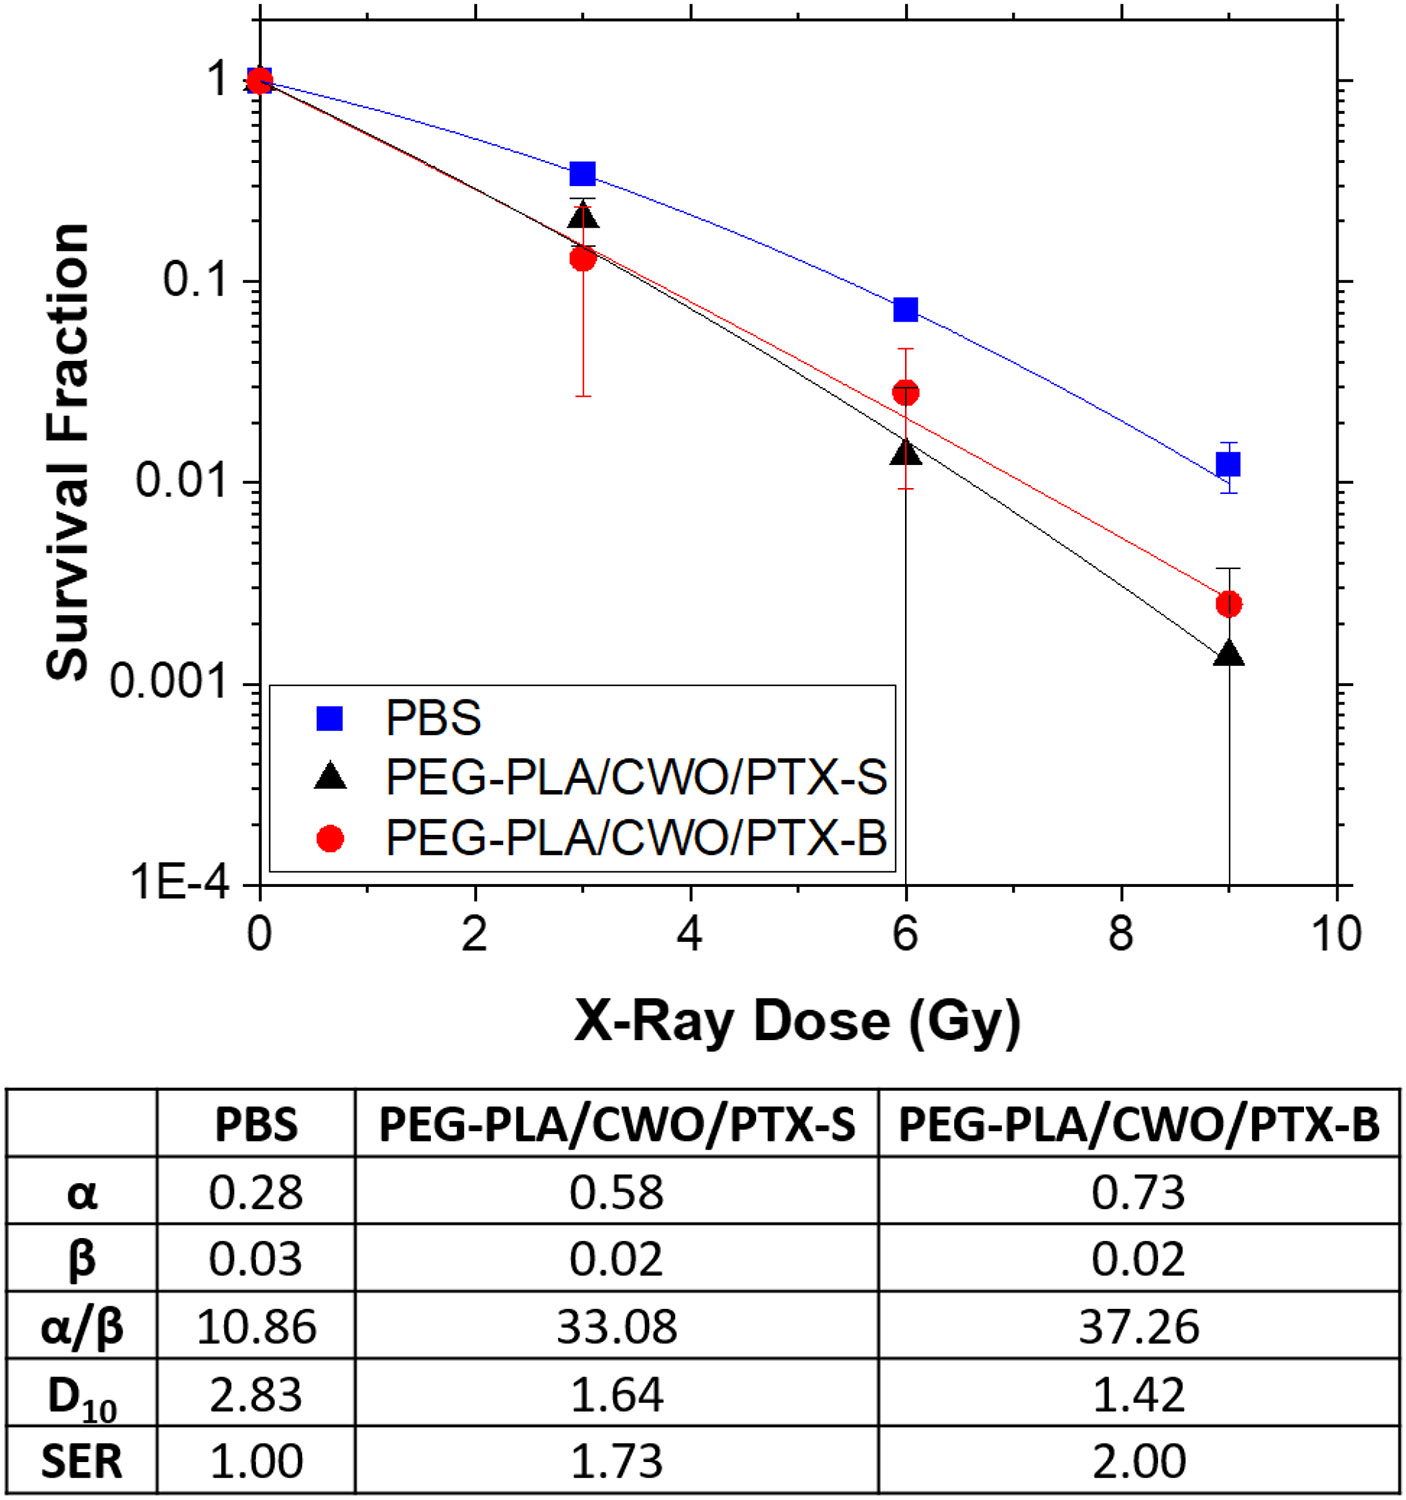
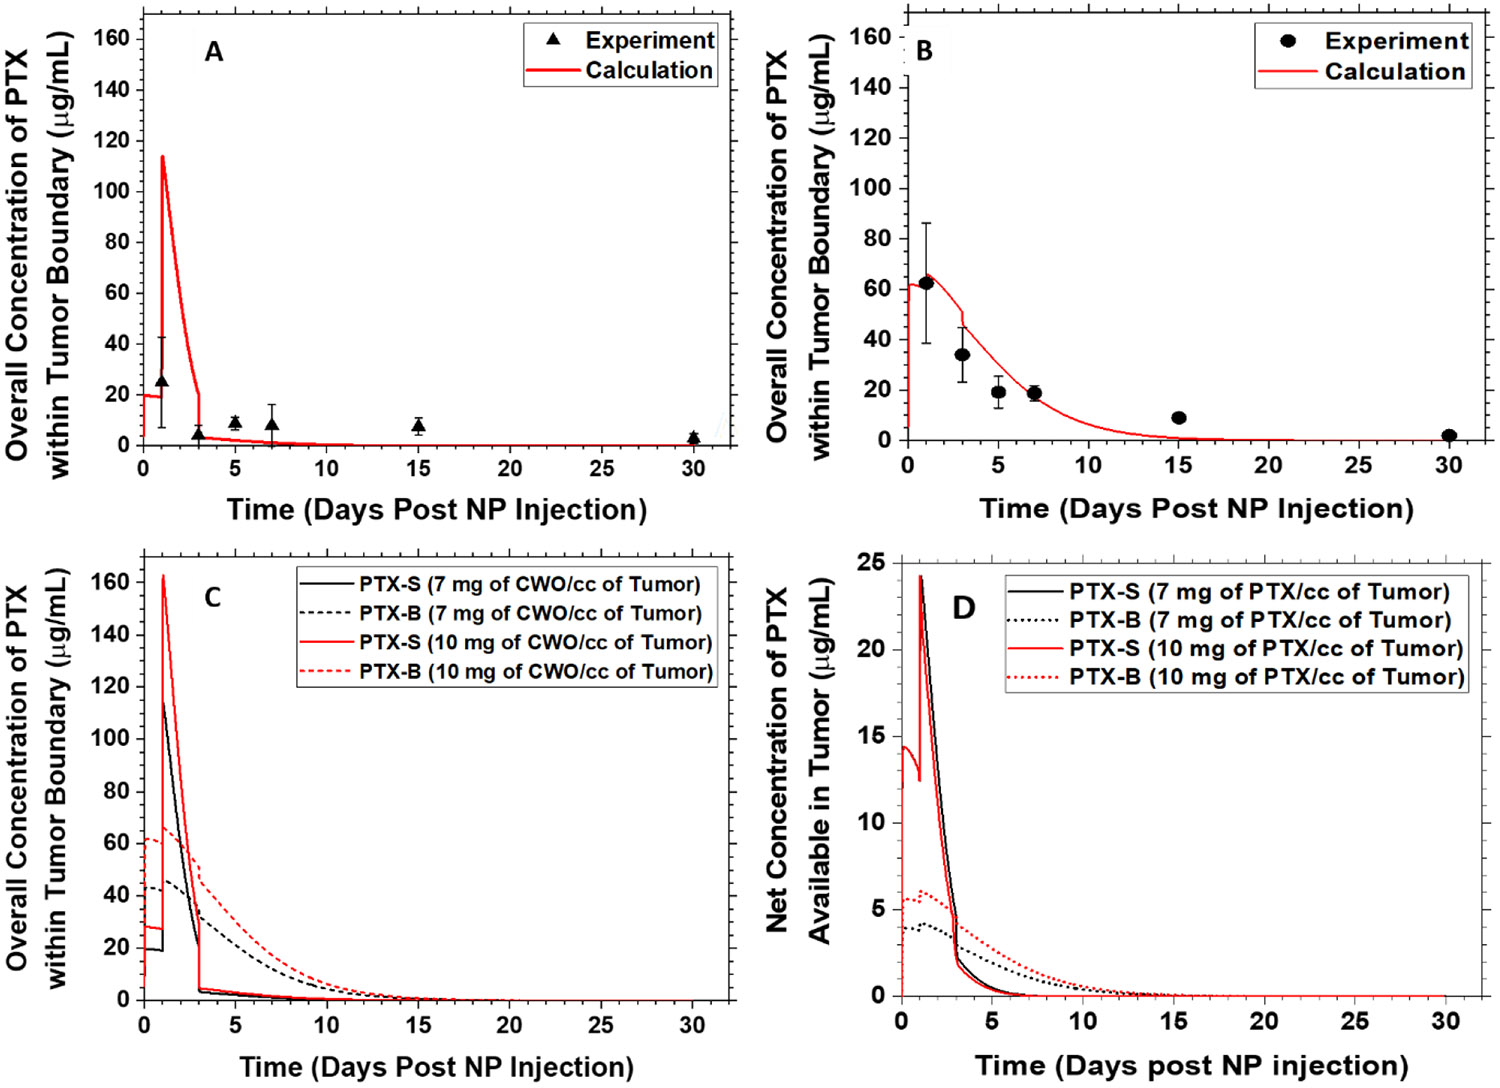
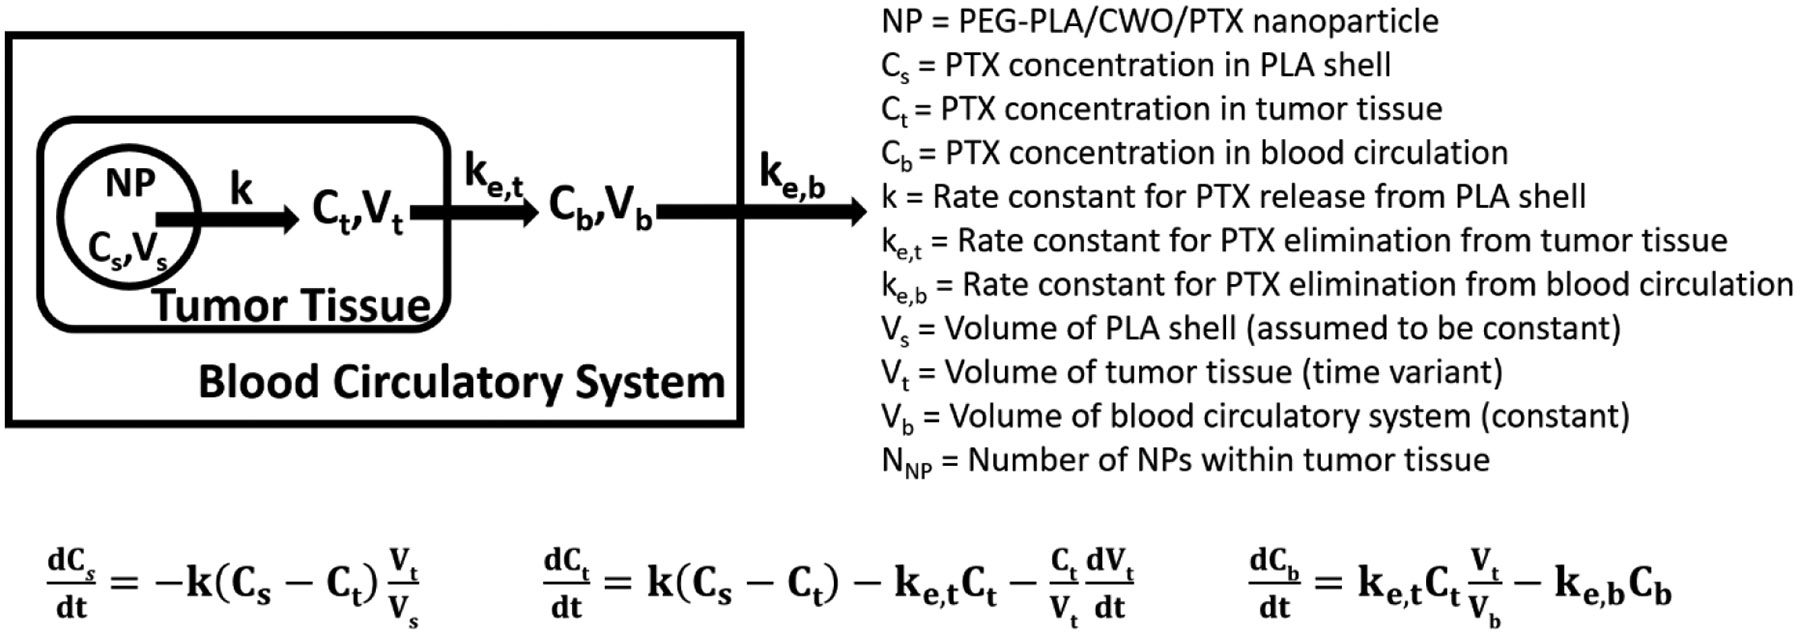
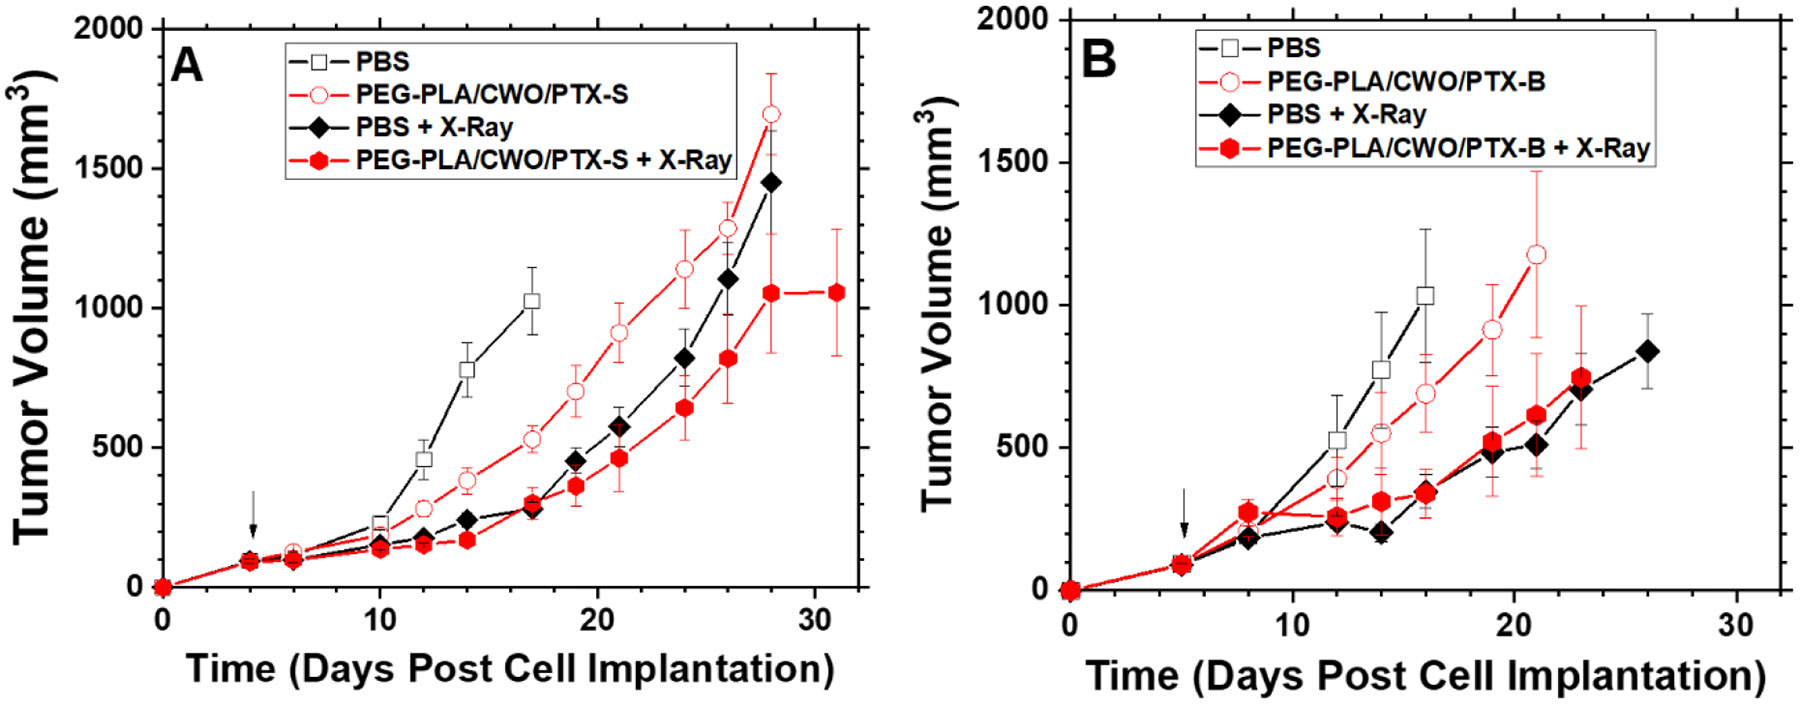
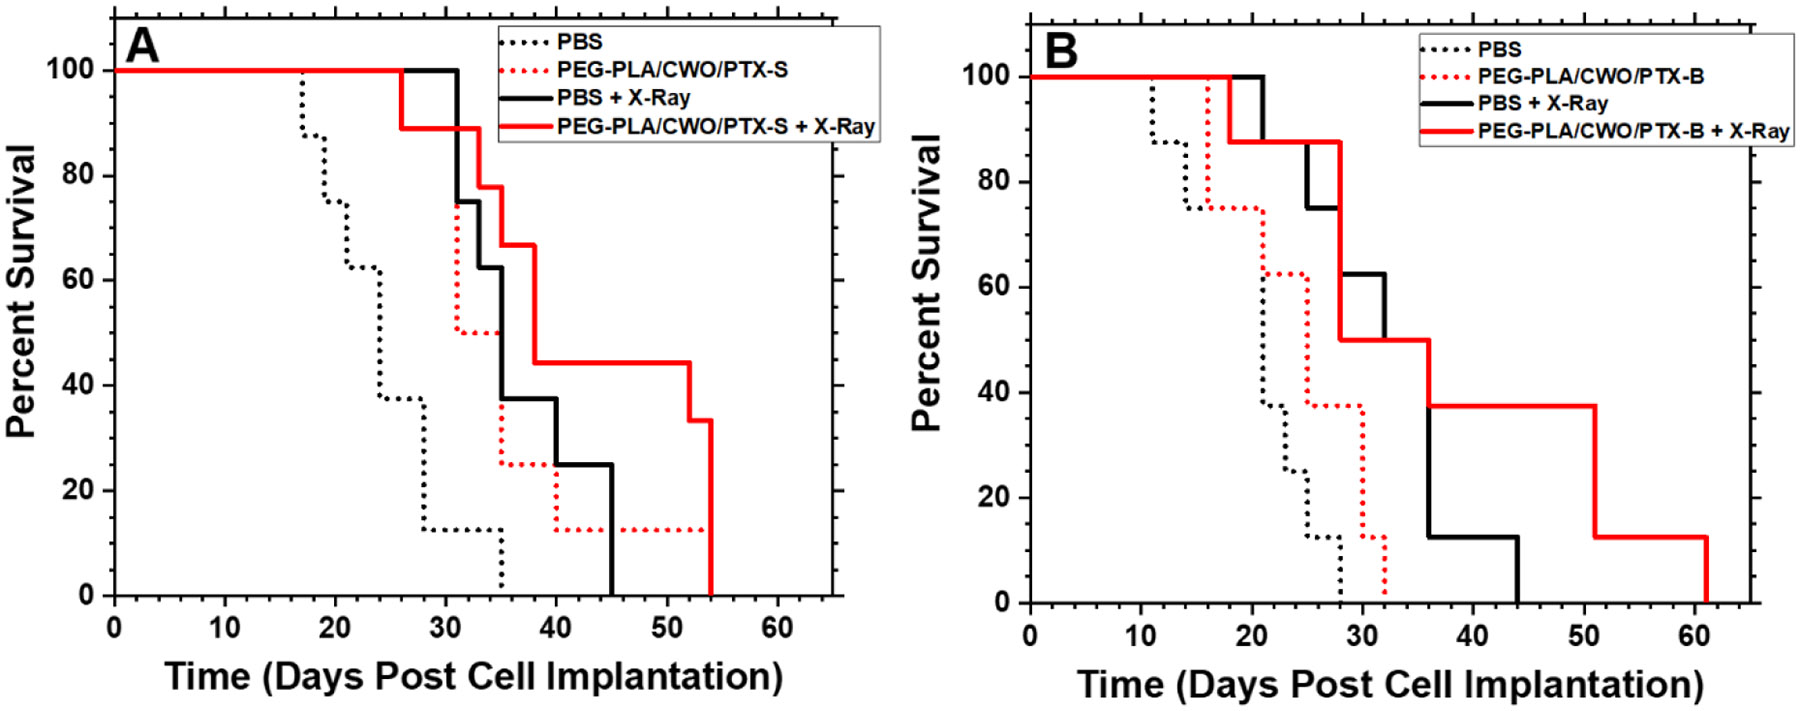
For many locally advanced tumors, the chemotherapy-radiotherapy (CT-RT) combination ("chemoradiation") is currently the standard of care. Intratumoral (IT) CT-based chemoradiation has the potential to overcome the limitations of conventional systemic CT-RT (side effects). For maximizing the benefits of IT CT-RT, our laboratory has previously developed a radiation-controlled drug release formulation, in which anticancer drug paclitaxel (PTX) and radioluminescent CaWO4 (CWO) nanoparticles (NPs) are co-encapsulated with poly(ethylene glycol)-poly(lactic acid) (PEG-PLA) block copolymers ("PEG-PLA/CWO/PTX NPs"). These PEG-PLA/CWO/PTX NPs enable radiation-controlled release of PTX and are capable of producing sustained therapeutic effects lasting for at least one month following a single IT injection. The present article focuses on discussing our recent finding about the effect of the stereochemical structure of PTX on the efficacy of this PEG-PLA/CWO/PTX NP formulation. Stereochemical differences in two different PTX compounds ("PTX-S" from Samyang Biopharmaceuticals and "PTX-B" from Biotang) were characterized by 2D heteronuclear/homonuclear NMR, Raman spectroscopy, and circular dichroism measurements. The difference in PTX stereochemistry was found to significantly influence their water solubility (WS); PTX-S (WS ≈ 4.69 μg/mL) is about 19 times more water soluble than PTX-B (WS ≈ 0.25 μg/mL). The two PTX compounds showed similar cancer cell-killing performances in vitro when used as free drugs. However, the subtle stereochemical difference significantly influenced their X-ray-triggered release kinetics from the PEG-PLA/CWO/PTX NPs; the more water-soluble PTX-S was released faster than the less water-soluble PTX-B. This difference was manifested in the IT pharmacokinetics and eventually in the survival percentages of test animals (mice) treated with PEG-PLA/CWO/PTX NPs + X-rays in an in vivo human tumor xenograft study; at short times (<1 month), concurrent PEG-PLA/CWO/PTX-S NPs produced a greater tumor-suppression effect, whereas PEG-PLA/CWO/PTX-B NPs had a longer-lasting radio-sensitizing effect. This study demonstrates the importance of the stereochemistry of a drug in a therapy based on a controlled release formulation.

Keywords: paclitaxel; poly(ethylene glycol)−poly(D,L-lactic acid); radiation-controlled drug release; radioluminescent CaWO4 nanoparticle; stereochemistry.


Figures

Figure 1.
Figure 1.. Schematic explanation of the working of the “PEG-PLA/CWO/PTX NP” radiation-controlled drug release system.
The formulation consists of a CaWO4 (CWO) nanoparticle (NP) core and a poly(ethylene glycol)-poly(D,L-lactic acid) (PEG-PLA) polymer micelle sheath. Chemotherapy drugs, paclitaxel (PTX), are loaded in the hydrophobic domain formed by the PLA blocks. Upon exposure to X-rays, the PEG-PLA coating layer degrades, and the PTX molecules are released from the NP system. The radioluminescent CWO NPs emit UV-A/blue light (350 – 525 nm) under X-ray excitation, which also produces radioenhancement/radiosensitization effects in tumor tissue. Concomitant PEG-PLA/CWO/PTX NPs enhance the effectiveness of chemoradiation for locally advanced tumors.
Figure 2.
Figure 2.. TEM micrographs of nanoparticles.
Representative TEM images of (A) uncoated CWO NPs (scale bar: 20 nm), (B) CWO/PEG-PLA/PTX-S NPs prepared using PTX from Samyang (“PTX-S”) (scale bar: 100 nm), and (C) CWO/PEG-PLA/PTX-B NPs prepared using PTX from Biotang (“PTX-B”) (scale bar: 100 nm). A filtered suspension containing pristine/formulated NPs in Milli-Q water was placed on a TEM grid, air dried, and negatively stained with 2% uranyl formate for TEM analysis. The mean diameter of pristine CWO NPs was determined by examining 25 uncoated primary NPs in TEM microscopic fields of view to be 19.2 nm with a coefficient of variation of 0.10.
Figure 3.
Figure 3.. GPC analysis of irradiated PEG-PLA.
GPC traces for PEG-PLA re-extracted from PEG-PLA micelles or PEG-PLA/CWO NPs exposed to X-rays or UV-A light in the (A) hydrated or (B) dried state in the absence or (C, D) presence of a free radical scavenger, butylated hydroxytoluene (BHT), co-loaded in the PLA domain. PEG-PLA micelles and PEG-PLA/CWO NPs were suspended in PBS at a concentration of 0.15 mg/mL (based on mass of PEG-PLA for PEG-PLA micelles and based on mass of CWO for PEG-PLA/CWO NPs) (“hydrated” samples). “Dried” samples were prepared by air-drying the hydrated samples. PEG-PLA micelles and PEG-PLA/CWO NPs were irradiated with 365-nm UV-A at a total fluence of 0.56 J/cm2 or 320-keV X-rays at a total dose of 7 Gy; the dried sample was re-dissolved in dichloromethane (DCM) after the irradiation. PEG-PLA was extracted from the irradiated solutions via liquid-liquid extraction with DCM. The extract was dried, and the polymer residue was dissolved in tetrahydrofuran (THF) for GPC analysis.
Figure 4.
Figure 4.. Comparison between Samyang PTX (PTX-S) and Biotang PTX (PTX-B).
(A) 1H NMR spectra for PTX-S (left) and PTX-B (right) in CDCl3. (B) Raman absorbances for PTX-S and PTX-B in the dry state. Data were obtained using a ReactRaman 785 spectrometer. (C) Circular dichroism (CD) spectra for PTX-S and PTX-B. 0.1 mM PTX/acetonitrile solutions were analyzed using a Jasco-1500 CD spectrophotometer to measure the molar ellipticity of PTX as a function of wavelength.
Figure 5.
Figure 5.. The structural formula of PTX.
There are 11 chiral centers in PTX (marked with five-pointed stars).
Figure 6.
Figure 6.. 2D heteronuclear 1H and 13C NMR spectroscopy for stereochemistry determination.
HMQC spectra for (A) PTX-S and (B) PTX-B. NOESY spectra for (C) PTX-S and (D) PTX-B. Data were obtained from 25 mg/mL PTX/CDCl3 solutions using a Bruker AV-III-400-HD NMR spectrometer. Arrow heads indicate distinct signals between PTX-S and PTX-B.
Figure 7.
Figure 7.. Water solubility and affinity of PTX to CWO.
(A) The solubility of PTX in water was determined as follows. 0.1 mL of a 1.0 mg/mL PTX suspension in water was filtered using a 450-nm PVDF filter. PTX was extracted from the filtrate with 0.1 mL of DCM. Upon drying, the extracted PTX was dissolved in 1.0 mL of ACN for HPLC analysis. (B) The amounts of PTX adsorbed to the surface of CWO NPs in DCM were determined as follows. 50 μL solutions containing 10 mg/mL of CWO NPs (19.2 nm mean diameter) and 0.25 mg/mL of PTX in DCM were prepared. At different time points, the solution was centrifuged at 5,000x g for 10 minutes, and the supernatant was collected. The supernatant solution was dried under vacuum, and the pellet was re-dissolved in 1 mL of ACN for determination of PTX concentration in the supernatant by HPLC. All data represent mean ± standard deviation (N = 3).
Figure 8.
Figure 8.. In vitro MTT cell viability assays.
HN31 cells in the exponential growth phase were seeded in a 96-well plate at a density of 0.5 x 10⁴ cells per well. After a 24-hour incubation period, the cells were exposed to different concentrations of PTX-S and PTX-B (in the range of 1 – 100 nM) (N = 3 per group); 20 μL of a PTX suspension in Cremophor-EL at an appropriate PTX concentration was added to each well containing 80 μL of culture medium; the viability measured with addition of 20 μL of pure Cremophor-EL was used as the normalization reference. After 48 hours of exposure to PTX, 10 μL of MTT reagent was added to each well. The cells were further incubated for 4 hours and then treated with 150 μL of DMSO. Afterwards, absorbances at 570 nm were measured using a SpectraMax iD3 Multi-Mode Microplate Reader. Error bars represent standard deviations. The horizontal dotted line at 50% viability is a guide to the eye.
Figure 9.
Figure 9.. PTX release profiles.
2.0 mL of a 5 mg/mL (based on CWO mass) PEG-PLA/CWO/PTX NP suspension in PBS was placed in a 50 kDa MWCO dialysis bag. The dialysis bag was placed in a beaker containing 100 mL of PBS media under magnetic stirring. The whole dialysis system (i.e., the PEG-PLA/CWO/PTX NP suspension and the release medium) was irradiated with 2 Gy of 320-keV X-rays (2.13 Gy/min) on Day 1. At regular time intervals, 100 mL of the bulk medium was taken out, and the identical volume of fresh PBS was added to maintain constant volume for the medium. PTX was extracted from 50 mL of the time sample with 50 mL of DCM, vacuum dried overnight, and re-dissolved in 2 mL of acetonitrile (ACN) for quantitation by HPLC. Note: Unfiltered nanoparticles were used for this study.
Figure 10.
Figure 10.. In vitro clonogenic cell survival assays.
HN31 cells were plated in 60-mm plates at 1 × 10³ (0 Gy), 2 × 10³ (3 Gy), 4 × 10³ (6 Gy) and 8 × 10³ (9 Gy) cells per plate (N = 3 per group). Cells were treated with PBS (control), PEG-PLA/CWO/PTX-S NPs (0.2 mg/mL CWO concentration) and PEG-PLA/CWO/PTX-B NPs (0.2 mg/mL CWO concentration) for 4 hours prior to X-ray irradiation (320 kV, 2.13 Gy/min). Data were fit to the standard exponential-quadratic decay formula, SF(D)=exp[(αD+βD2)], where SF is the survival fraction, D is the X-ray dose, and α and β are fitting parameters. Fitting results are summarized in the table underneath the figure; D10 and SER represent the radiatio dose at 10% clonogenic survival and the sensitization enhancement ratio (D10(PBS)D10(PEGPLACWOPTX)), respectively. Error bars represent standard deviations. Note: Unfiltered nanoparticles were used for this study.
Figure 11.
Figure 11.. In vivo intratumoral PTX pharmacokinetic (PK) profiles following intratumoral administration of PEG-PLA/CWO/PTX NPs into HNSCC xenografts in mice.
Subcutaneous HN31 xenografts were produced in Nod rag gamma (NRG) mice by inoculating 1 × 10⁶ HN31 cells into the upper right flank of each mouse (Days −5)). 100 μL of a (A) 7 mg/mL (based on CWO mass) PEG-PLA/CWO/PTX-S or (B) 10 mg/mL (based on CWO mass) PEG-PLA/CWO/PTX-B NP suspension in sterile PBS was injected twice over 2 days (Days 0 and 1) once the tumors reached a volume of 100 mm3. The control group was treated with blank PBS. The mice were subjected to a sub-therapeutic dose of 320-keV X-ray radiation (total 8 Gy given in daily fractions of 2 Gy per fraction over 4 days (Days 1, 2, 3 and 4). Tumor dimensions were measured using a digital caliper. Mice were euthanized at 1, 3, 5, 7, 15 and 30 days post NP injection (N = 6 for each time group). Whole tumor tissues were collected after euthanasia, homogenized via agitation with ceramic beads, and extracted with 2 mL of DCM. The extract was dried, re-dissolved in 2 mL of ACN, and analyzed by HPLC for the concentration of PTX in the tumor tissue; this measured overall concentration of PTX within the tumor boundary represents the sum of the amounts of PTX remaining in the polymer matrix plus PTX remaining in the tumor, and is thus equal to (NNPCsVs+CtVt)Vt, referring to the notations defined in Figure 12. Error bars represent standard deviations. Note: Unfiltered nanoparticles were used for this study. The PEG-PLA:CWO:PTX loading ratios were determined by TGA, AAS and HPLC to be 1.77:1.00:0.56 for PEG-PLA/CWO/PTX-S NPs and 2.44:1.00:0.55 for PEG-PLA/CWO/PTX-B NPs. Solid curves are predictions of the multi-compartmental PK model described in Figure 12. (C) Comparison of predicted PK profiles for PEG-PLA/CWO/PTX-B and PEG-PLA/CWO/PTX-S NPs at two different dose conditions. (D) Predicted net concentrations of PTX available in the tumor (Ct) as a function of time at two different dose conditions. Note: Unfiltered nanoparticles were used for this study.
Figure 12.
Figure 12.. Schematic depiction of the multi-compartmental pharmacokinetic (PK) model.
A multi-compartmental PK model was used to compute the data shown in Figure 11. See main text for discussion.
Figure 13.
Figure 13.. Effects of intratumoral chemoradiation on tumor growth in mice.
Tumor suppression efficacies of (A) PEG-PLA/CWO/PTX-S NPs ± X-rays and (B) PEG-PLA/CWO/PTX-B NPs ± X-rays. Subcutaneous HN31 xenografts were produced in Nod rag gamma (NRG) mice by injecting 1 x 10⁶ HN31 cells in 1 mL of sterile PBS into the upper right flank of the mice on Day 0. When tumors averaged 100 mm3, 100 μL of 15 mg/mL (based on PTX mass) PEG-PLA/CWO/PTX NPs in sterile PBS or blank sterile PBS (control) was directly injected into the tumor (N = 8 each group) over 2 days (A) on Days 3 and 4 or (B) on Days 4 and 5 (50 μL injected each day). Some mice were further treated with a sub-therapeutic dose of 320-keV X-ray radiation (total 8 Gy given in daily fractions of 2 Gy per fraction over 4 days ((A) on Days 4, 5, 6 and 7 or (B) on Days 5, 6, 7 and 8); the first day of radiation treatment is marked with an arrow. Tumor dimensions were measured using a digital caliper. Mice were euthanized when the tumors reached 2000 mm3 or mice lost more than 20% weight. For each group, tumor volume data are shown up to the day of the second euthanasia case. Error bars represent standard errors. Note: Unfiltered nanoparticles were used for this study. Statistical analysis was performed using one-way ANOVA on pairs of groups. The resulting p-values are summarized in Tables S1 and S2 of the SI.
Figure 14.
Figure 14.. Effects of intratumoral chemoradiation on survival of tumor-bearing mice.
Kaplan-Meier survival curves for HN31 xenograft-bearing mice treated with (A) PEG-PLA/CWO/PTX-S NPs + X-rays and (B) PEG-PLA/CWO/PTX-B NPs + X-rays in comparison with commercial PTX formulations (Genexol-PM and Taxol). Data were obtained from the same study as shown in Figure 13. Statistical analysis was performed using the log-rank test. The resulting p-values are summarized in Tables 1 and 2.

Similar articles

References

    1. Martin V, Overview of paclitaxel (TAXOL), Semin Oncol Nurs, 9 (1993) 2–5. - PubMed
    1. H.a.B. MAa.B. Sa.P. FHa.A. FJ, Nanopaclitaxel therapy: an evidence based review on the battle for next-generation formulation challenges, Nanomedicine, 14 (2019) 1323–1341. - PubMed
    1. M. Amanda Starling-Windhof and Asur Srinivasan and Tina Tomeo and Anne Marie Clark and Peter, Chapter 10 - Trends in the intellectual property (IP) landscape of drug delivery systems: 30 years of growth and evolution, (2020) 201–230.
    1. Song JI, Dumais MR, From yew to us: the curious development of taxol, Jama, 266 (1991) 1281. - PubMed
    1. Weaver BA, How Taxol/paclitaxel kills cancer cells, Molecular Biology of the Cell, 25 (2014) 2677–2681. - PMC - PubMed

Publication types