. 2022 Aug:287:121666.
doi: 10.1016/j.biomaterials.2022.121666. Epub 2022 Jul 4.

Fibrous aggregates: Amplifying aggregation-induced emission to boost health protection

Affiliations

Fibrous aggregates: Amplifying aggregation-induced emission to boost health protection

Zhenduo Qiu et al. Biomaterials. 2022 Aug.

Abstract

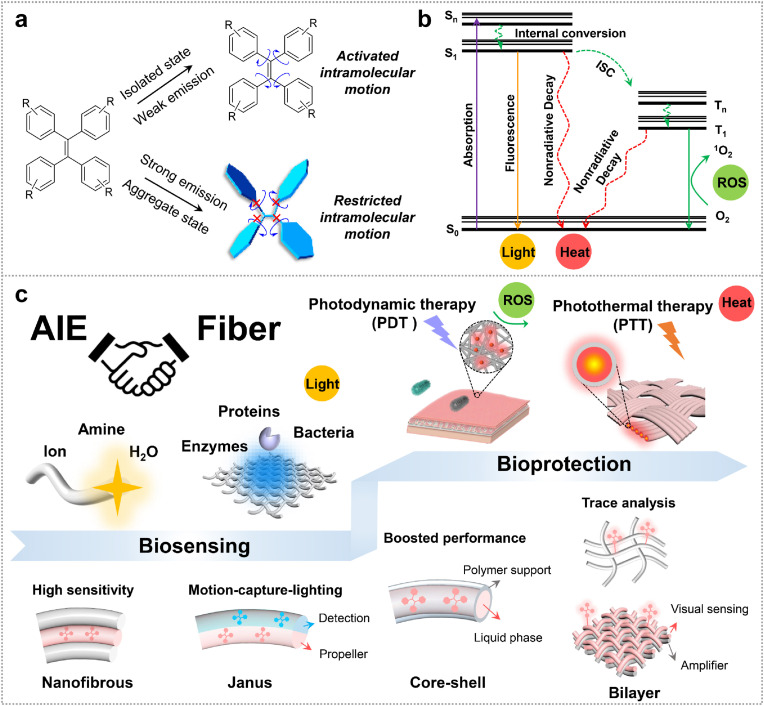
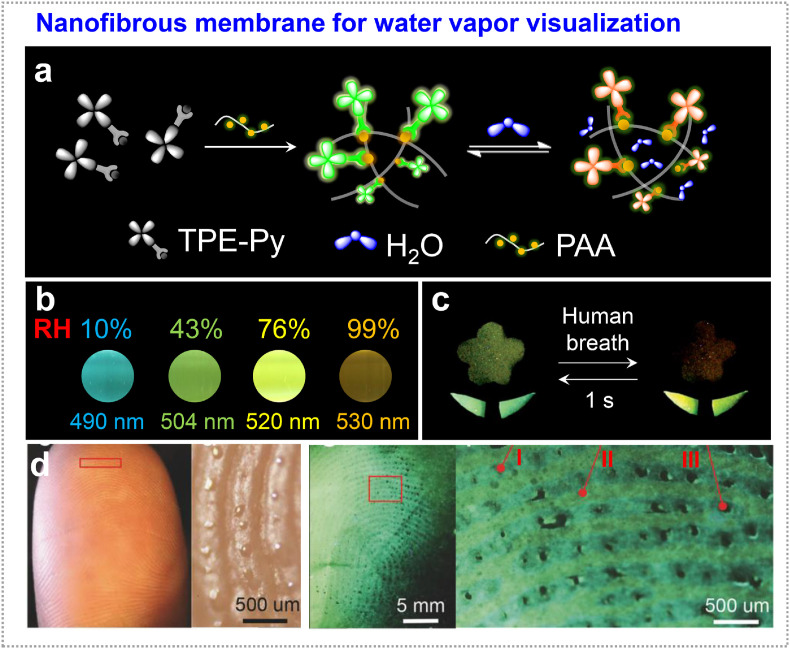
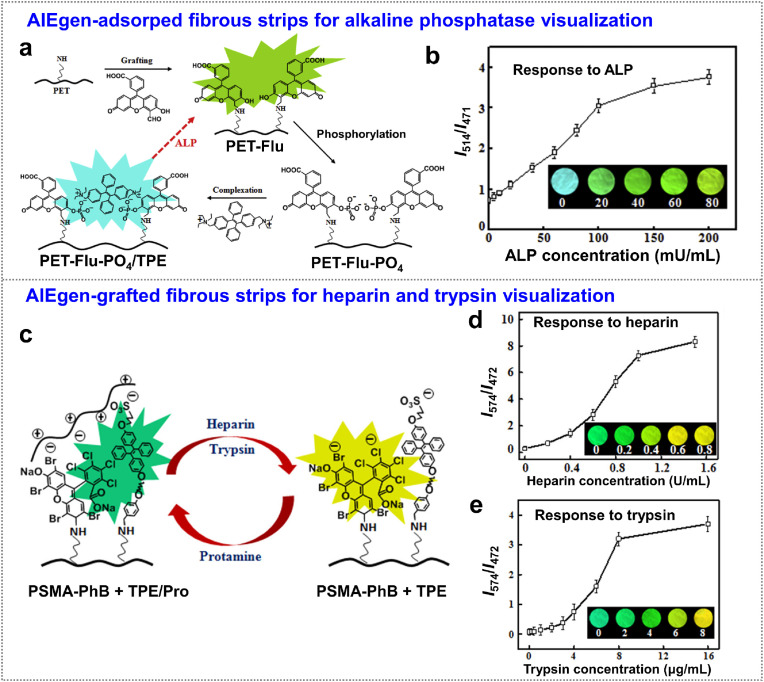
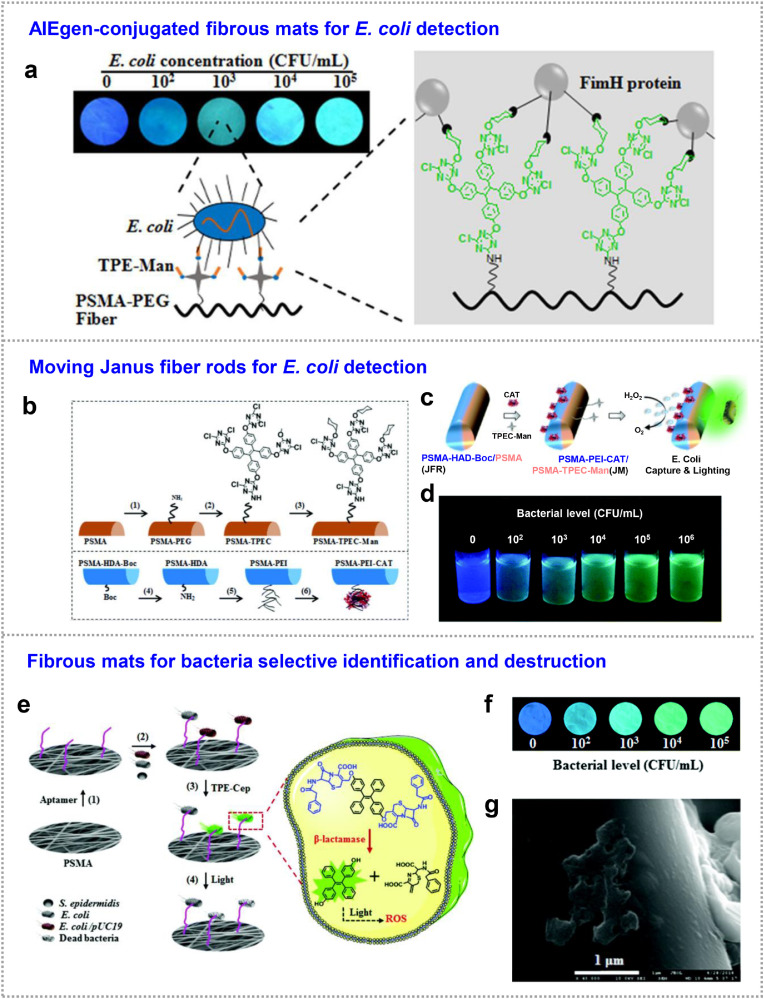
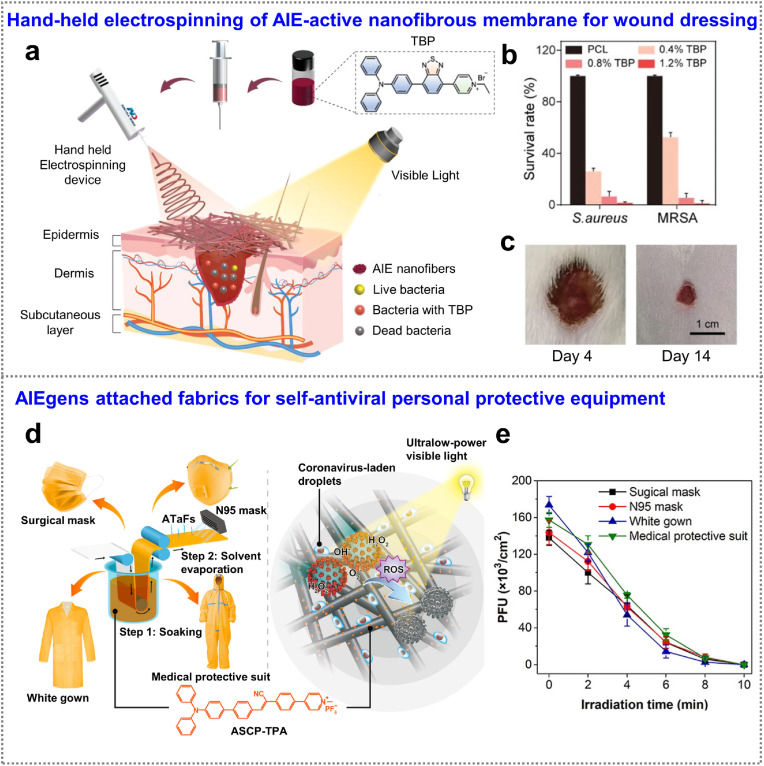
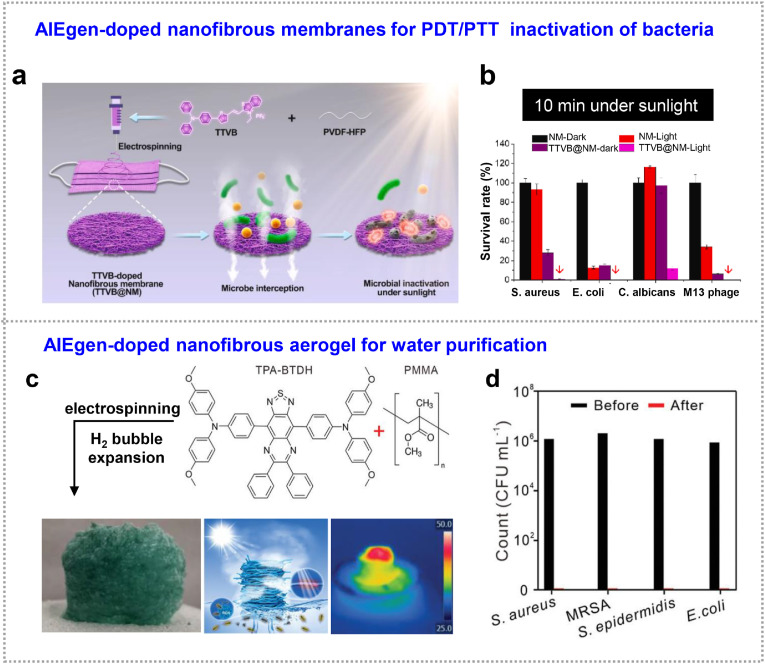
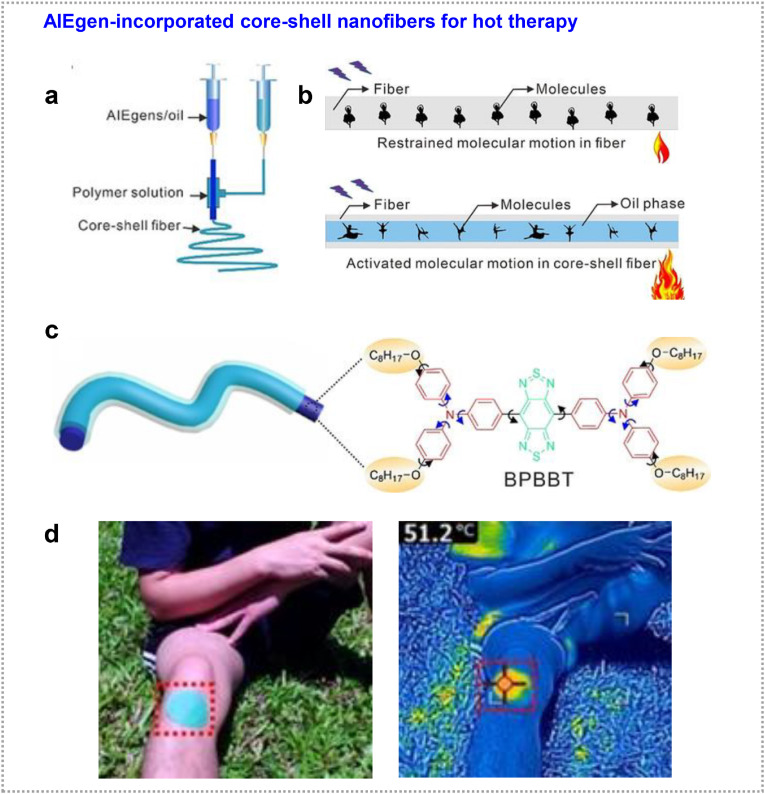
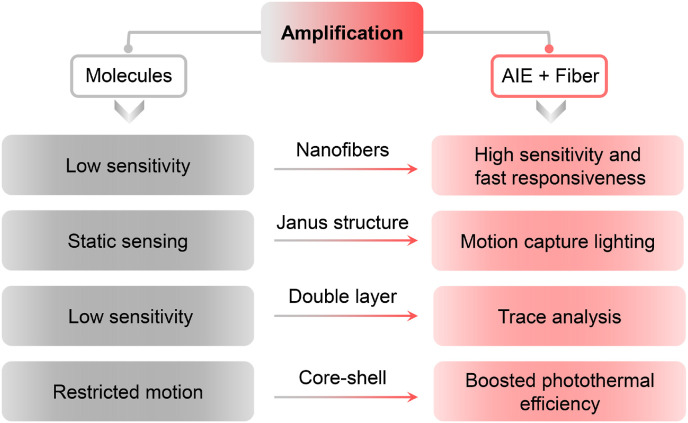
Environmental monitoring and personal protection are critical for preventing and for protecting human health during all infectious disease outbreaks (including COVID-19). Fluorescent probes combining sensing, imaging and therapy functions, could not only afford direct visualizing existence of biotargets and monitoring their dynamic information, but also provide therapeutic functions for killing various bacteria or viruses. Luminogens with aggregation-induced emission (AIE) could be well suited for above requirements because of their typical photophysical properties and therapeutic functions. Integration of these molecules with fibers or textiles is of great interest for developing flexible devices and wearable systems. In this review, we mainly focus on how fibers and AIEgens to be combined for health protection based on the latest advances in biosensing and bioprotection. We first discuss the construction of fibrous sensors for visualization of biomolecules. Next recent advances in therapeutic fabrics for individual protection are introduced. Finally, the current challenges and future opportunities for "AIE + Fiber" in sensing and therapeutic applications are presented.

Keywords: Aggregation-induced emission; Fibers; Health protection; Sensing; Therapy.


Conflict of interest statement

The authors declare that they have no known competing financial interests or personal relationships that could have appeared to influence the work reported in this paper.

Figures

Fig. 1
Fig. 1
Illustration of AIE working mechanism and applications of the “AIE + Fiber”. (a) Restriction of intramolecular motions of AIEgens for “light-up” in aggregate state. (b) Simplified Jablonski diagram of the electronic transition of AIEgens (radiative decay), AIE PSs (ISC process) and AIE PTAs (nonradiative decay). (c) An overview of “AIE + Fiber” for health protection in terms of biosensing and bioprotection.
Fig. 2
Fig. 2
Biogenic amine detection. (a) AIE handy pen for visual detection of amine vapor. (b) DQ2-immobilized sol-gel coatings on the SiO2 fiber. (c) Mechanism for amine detection by sol-gel coatings. Insets: Fibers exposed to 20 ppm amine for 0 and 30 min under UV lamp. Adapted and reproduced with permission from Ref. [41]. Copyright 2021 American Chemical Society. (d) Mesoporous AIEgen-organosilica embedded electrospun nanofibers for amine sensing; (e) Mechanism for amine detection by reversible protonation of AIE probes. (f) Nanofibrous sensor for shrimp spoilage monitoring. Adapted and reproduced with permission from Ref. [42]. Copyright 2021 American Chemical Society.
Fig. 3
Fig. 3
Metal ions and H2O2 detection. (a) TPE derivatives-grafted fibrous strip for Hg2+ detection. (b) The fitting relationship between emission intensity of the fibrous sensor and Hg2+ levels. Inset: The color of fibrous strips in response to different levels of Hg2+ under 365 nm UV light. Adapted with permission from Ref. [40]. Copyright 2019 Elsevier. (c) Bilayer fibrous mats (PET-Ch/TPE@PSMA-ChOX) for H2O2 and choline sensing. (d) The signal amplification by introduction of choline oxidase layer (PSMA-ChOX). Insets showing the corresponding fluorescence fading in response to H2O2 concentration (365 nm irradiation). Adapted and reproduced with permission from Ref. [32]. Copyright 2019 The Royal Society of Chemistry. (For interpretation of the references to color in this figure legend, the reader is referred to the Web version of this article.)
Fig. 4
Fig. 4
Glucose detection. (a) AIE-PEBA-PAN fibrous test strip for glucose testing. (b) Mechanism of colorimetric and fluorometric dual-response sensor. (c) Dual-mode of colorimetric and fluorometric visual glycosuria sensing at different glucose concentrations. Images taken under daylight and UV radiation, respectively. Adapted and reproduced with permission from Ref. [54]. Copyright 2021 Elsevier.
Fig. 5
Fig. 5
Water vapor detection. (a) Design of TPE-Py-doped polyacrylic acid (PAA) nanofibrous fluorescence sensors for water vapor visualization. (b) The fluorescence colors of TPE-Py-PAA film upon the relative humidity increasing from 0% to 99%. (c) Reversible and rapid response of nanofibrous film in a flower pattern (flower leaves: TPE-Py-PAA) to human exhalation. Photos taken under 365 nm UV irradiation. (d) The photos of the finger pulp and fingerprint mapping on the TPE-Py fibrous membrane. In the rightmost magnified image, the alternate blue and yellow lines correspond to the ridges (I) and valleys (II) of fingerprint, while the black points correspond to the sweat pores (III). Adapted and reproduced with permission from Ref. [61]. Copyright 2017 Wiley-VCH Verlag GmbH & Co. (For interpretation of the references to color in this figure legend, the reader is referred to the Web version of this article.)
Fig. 6
Fig. 6
Proteins detection. (a) Ratiometric fluorescence sensors for the detection of ALP. Schematic illustration of fluorescein carbaldehyde grafting, fluorescein phosphorylation, and electrostatic complexation of TPE-2N+. (b) I514/I471 ratios of fibrous mats in the presence of ALP at different concentrations, the insets are the corresponding fluorescence images of the strips irradiated under 365 nm UV light. Adapted and reproduced with permission from Ref. [64]. Copyright 2016 Elsevier. (c) Schematic illustration of the ratiometric color changes of fibrous sensor. The sensing of heparin or trypsin was occurred by removing the adsorbed protamine. (d, e) I574/I472 ratios of the fibrous sensor at different concentrations of (d) heparin and (e) trypsin, the insets are the corresponding fluorescence images of the strips under 365 nm UV light. Adapted and reproduced with permission from Ref. [65]. Copyright 2017 American Chemical Society. (For interpretation of the references to color in this figure legend, the reader is referred to the Web version of this article.)
Fig. 7
Fig. 7
Bacteria detection. (a) (left) TPE-Man-grafted PSMA-PEG nanofibrous sensor for E. coli detection and (right) the corresponding working mechanism. The fluorescence images showing the enhanced emission with an increase in E. coli concentration. Adapted and reproduced with permission from Ref. [71]. Copyright 2015 American Chemical Society. (b) Schematic illustration of specific grafting on two sides of Janus fiber rods. One side was grafted with AIE probes of TPEC-mannose, the other was conjugated with catalase to react with H2O2 for propelling fiber rods. (c) Fluorescence response of Janus micromotors after binding with E. coli. The decomposition of H2O2 fuels by catalase provided the propulsion force to enhance the specific binding between mannose moieties and E. coli, which initiated the AIE effect of TPE units and then “turn-on” the fluorescence of fiber rods. (d) Fluorescence photographs of Janus fiber rods suspensions at different E. coli. concentrations. Adapted and reproduced with permission from Ref. [33]. Copyright 2019 The Royal Society of Chemistry. (e) Schematic illustration of bacterial capture and destruction on fibrous mats modified by aptamer and then TPE-Cep. (f) Fluorescence images of fibrous color strips incubated with E. coli/pUC19 at various concentrations taken under 365 nm UV light. (g) SEM image of the destroyed structure of the captured bacteria on the surface of fiber. Adapted with permission from Ref. [72]. Copyright 2020 The Royal Society of Chemistry. (For interpretation of the references to color in this figure legend, the reader is referred to the Web version of this article.)
Fig. 8
Fig. 8
Photodynamic therapy. (a) Schematic illustration of hand-held electrospinning of TBP-incorporated antimicrobial dressing. (b) Antibacterial activity of the nanofibrous membrane with various TBP concentrations. (c) Healing ability of the nanofibrous wound dressing. Adapted with permission from Ref. [95]. Copyright 2022 Wiley-VCH Verlag GmbH & Co. (d) Schematic illustration of the construction of ATaFs and the photodynamic inactivation of the coronavirus. (e) Virucidal effects of four kinds of ATaFs (irradiation density: 3.0 mW cm−2). Adapted with permission from Ref. [96]. Copyright 2021 American Chemical Society.
Fig. 9
Fig. 9
Combined photodynamic and photothermal therapy. (a) Schematic illustration of the electrospinning of nanofibrous membrane TTVB@NM and its inactivation of bacteria, fungi and viruses upon sunlight irradiation. (b) Survival rates of different microbes after 10 min sunbathing. Adapted with permission from Ref. [104]. Copyright 2021 Elsevier. (c) Preparation and photograph of TPA-BTDH-doped fibrous foam, and their water purification mechanism. (d) The counts of bacterial clones in the simulated wastewater before and after water evaporation. Adapted and reproduced with permission from Ref. [105]. Copyright 2021 Wiley-VCH Verlag GmbH & Co.
Fig. 10
Fig. 10
Photothermal therapy. (a) Schematic illustration of coaxial electrospinning. (b) The restriction of intramolecular motion in polymer network of homogeneous fibers and the activation of intramolecular motion in oil phase of core-shell fiber. (c) Structure of a core–shell fiber and the activated molecular motion of BPBBT in oil phase. (d) The strong photothermal effect of the core-shell fibrous fabrics. Adapted with permission from Ref. [35]. Copyright 2020 Wiley-VCH Verlag GmbH & Co.
Fig. 11
Fig. 11
Amplification effect of “AIE + Fiber” for biosensing and bioprotection.

Similar articles

Cited by

References

    1. World Health Organization, United Nations Children's Fund . World Heal. Organ.; 2020. Water, Sanitation, Hygiene, and Waste Management for SARS-CoV-2, the Virus that Causes COVID-19: Interim Guidance, 29 July 2020.https://apps.who.int/iris/handle/10665/333560
    1. Fu W., Yan C., Guo Z., Zhang J., Zhang H., Tian H., Zhu W.-H. Rational design of near-infrared aggregation-induced-emission-active probes: in situ mapping of amyloid-β plaques with ultrasensitivity and high-fidelity. J. Am. Chem. Soc. 2019;141:3171–3177. doi: 10.1021/jacs.8b12820. - DOI - PubMed
    1. Pode Z., Peri-Naor R., Georgeson J.M., Ilani T., Kiss V., Unger T., Markus B., Barr H.M., Motiei L., Margulies D. Protein recognition by a pattern-generating fluorescent molecular probe. Nat. Nanotechnol. 2017;12:1161–1168. doi: 10.1038/nnano.2017.175. - DOI - PubMed
    1. Han X., Wang R., Song X., Yu F., Lv C., Chen L. A mitochondrial-targeting near-infrared fluorescent probe for bioimaging and evaluating endogenous superoxide anion changes during ischemia/reperfusion injury. Biomaterials. 2018;156:134–146. doi: 10.1016/j.biomaterials.2017.11.039. - DOI - PubMed
    1. Li H., Kim H., Han J., Nguyen V.-N., Peng X., Yoon J. Activity-based smart AIEgens for detection, bioimaging, and therapeutics: recent progress and outlook. Aggregate. 2021;2:e51. doi: 10.1002/agt2.51. - DOI