

Temporally dynamic antagonism between transcription and chromatin compaction controls stochastic photoreceptor specification in flies
- PMID: 35835116
- PMCID: PMC9378680
- DOI: 10.1016/j.devcel.2022.06.016
Temporally dynamic antagonism between transcription and chromatin compaction controls stochastic photoreceptor specification in flies
Abstract
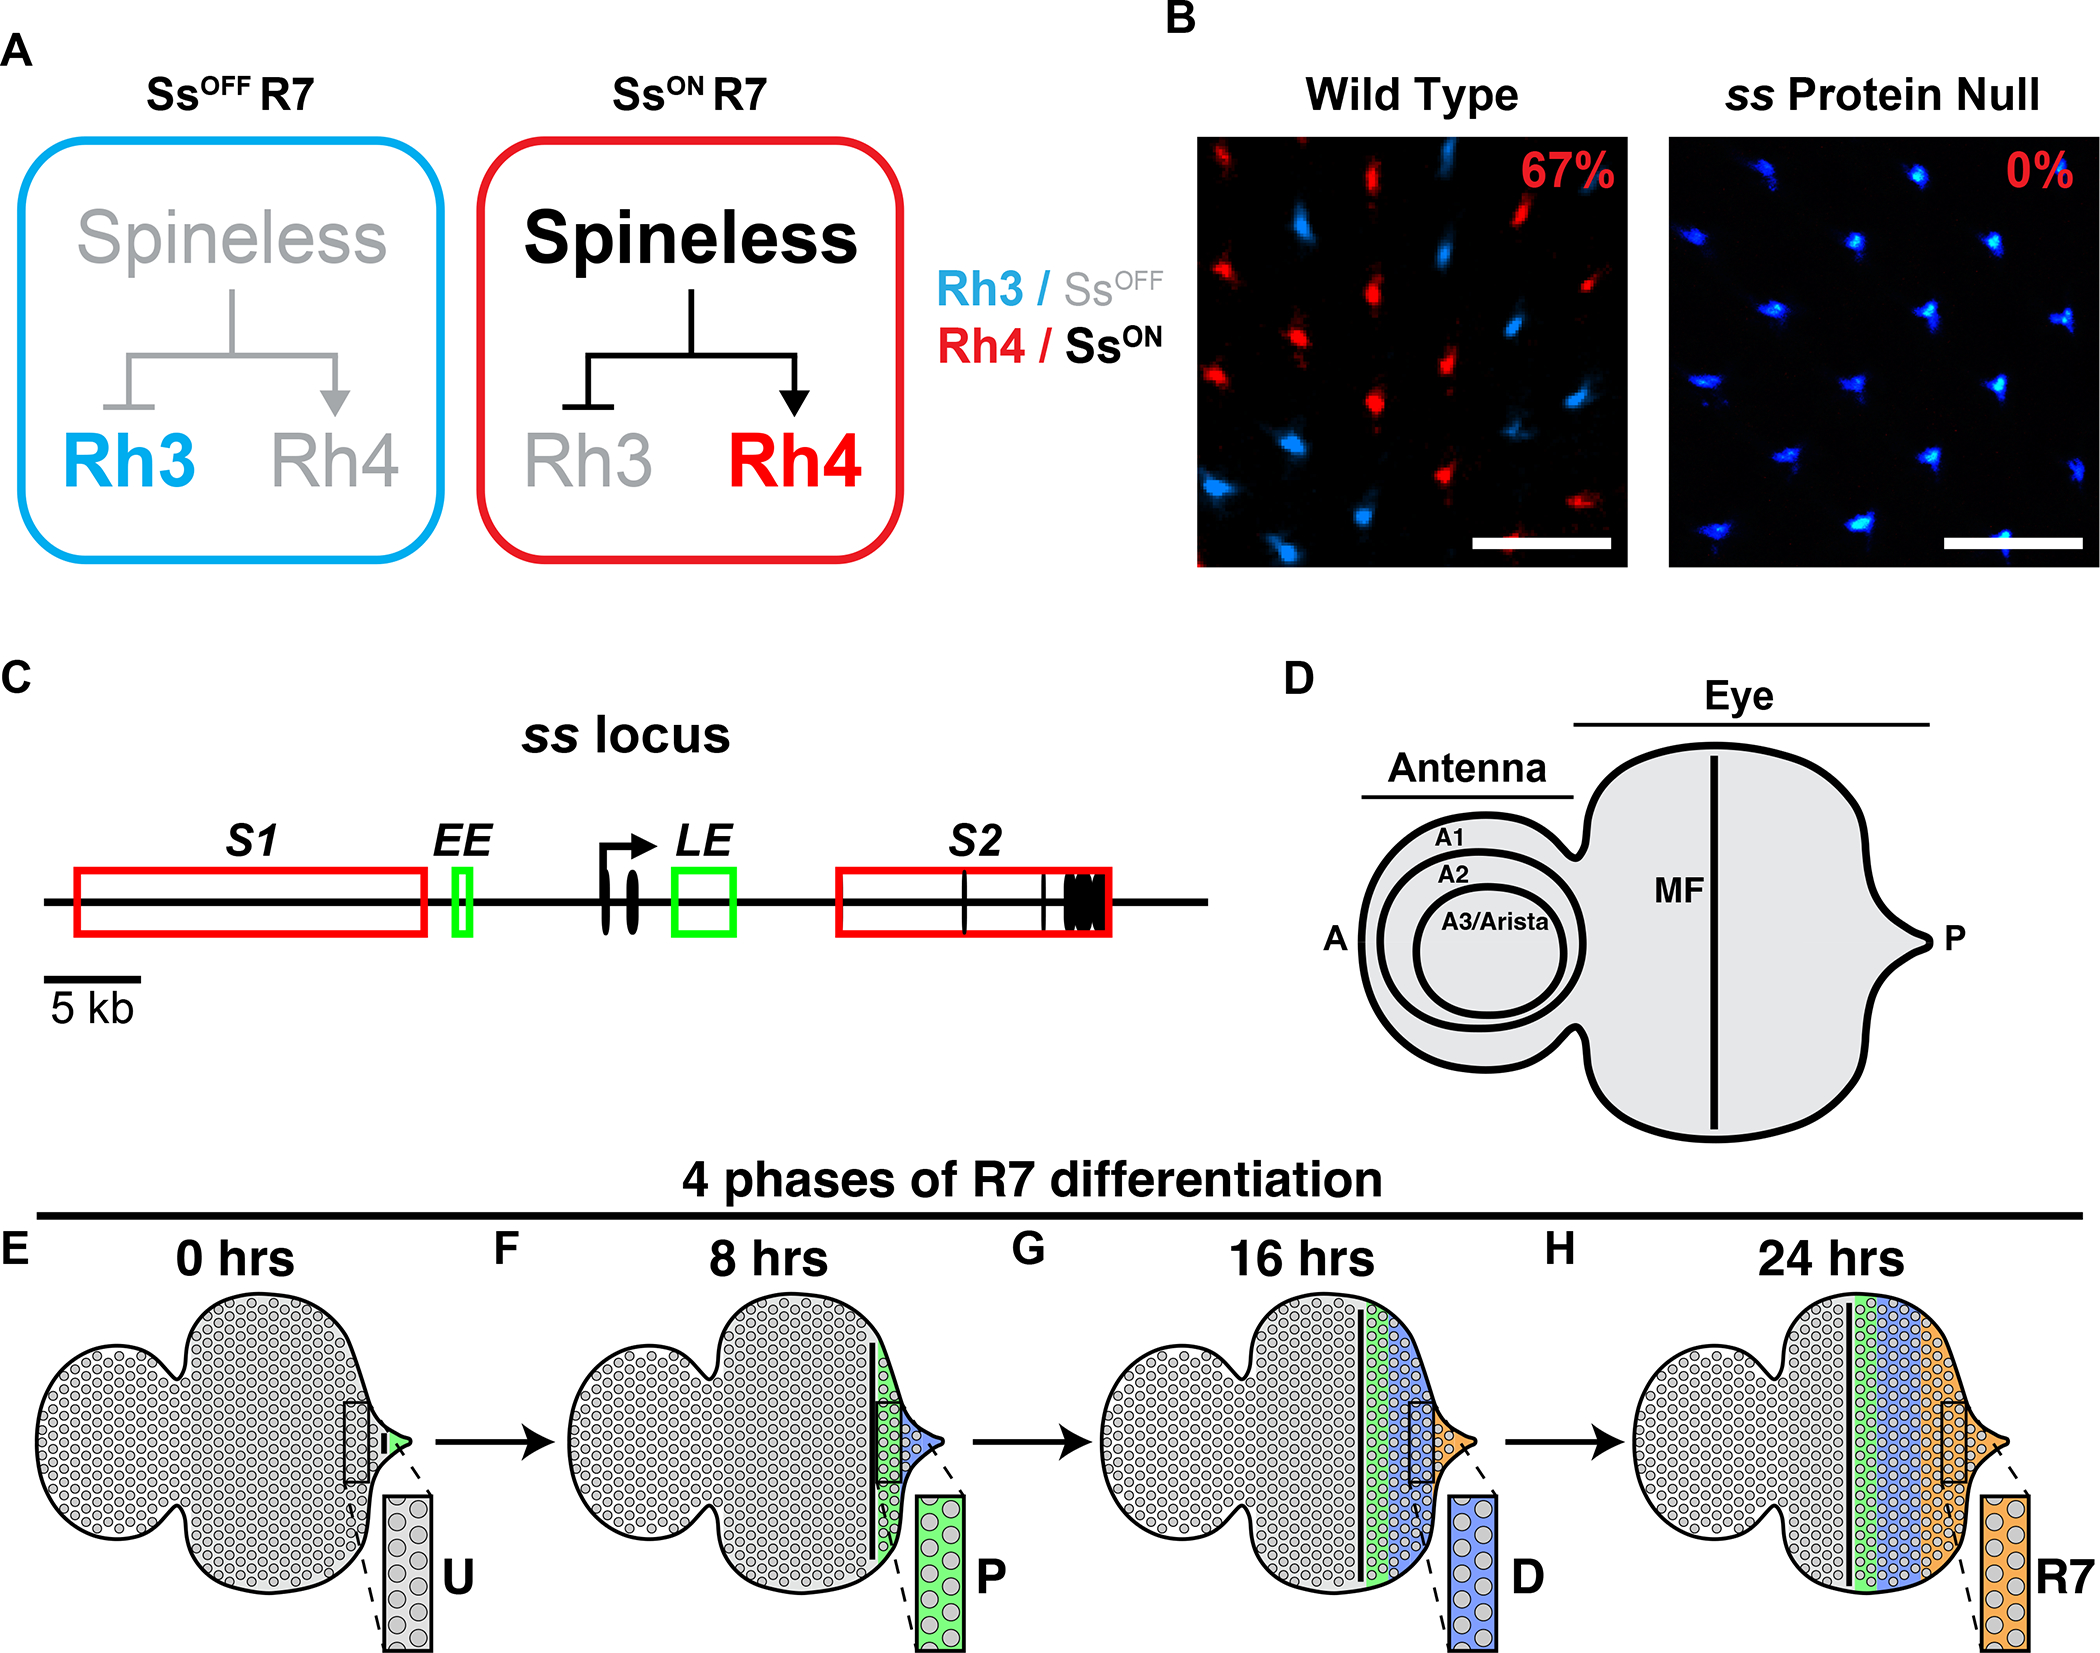
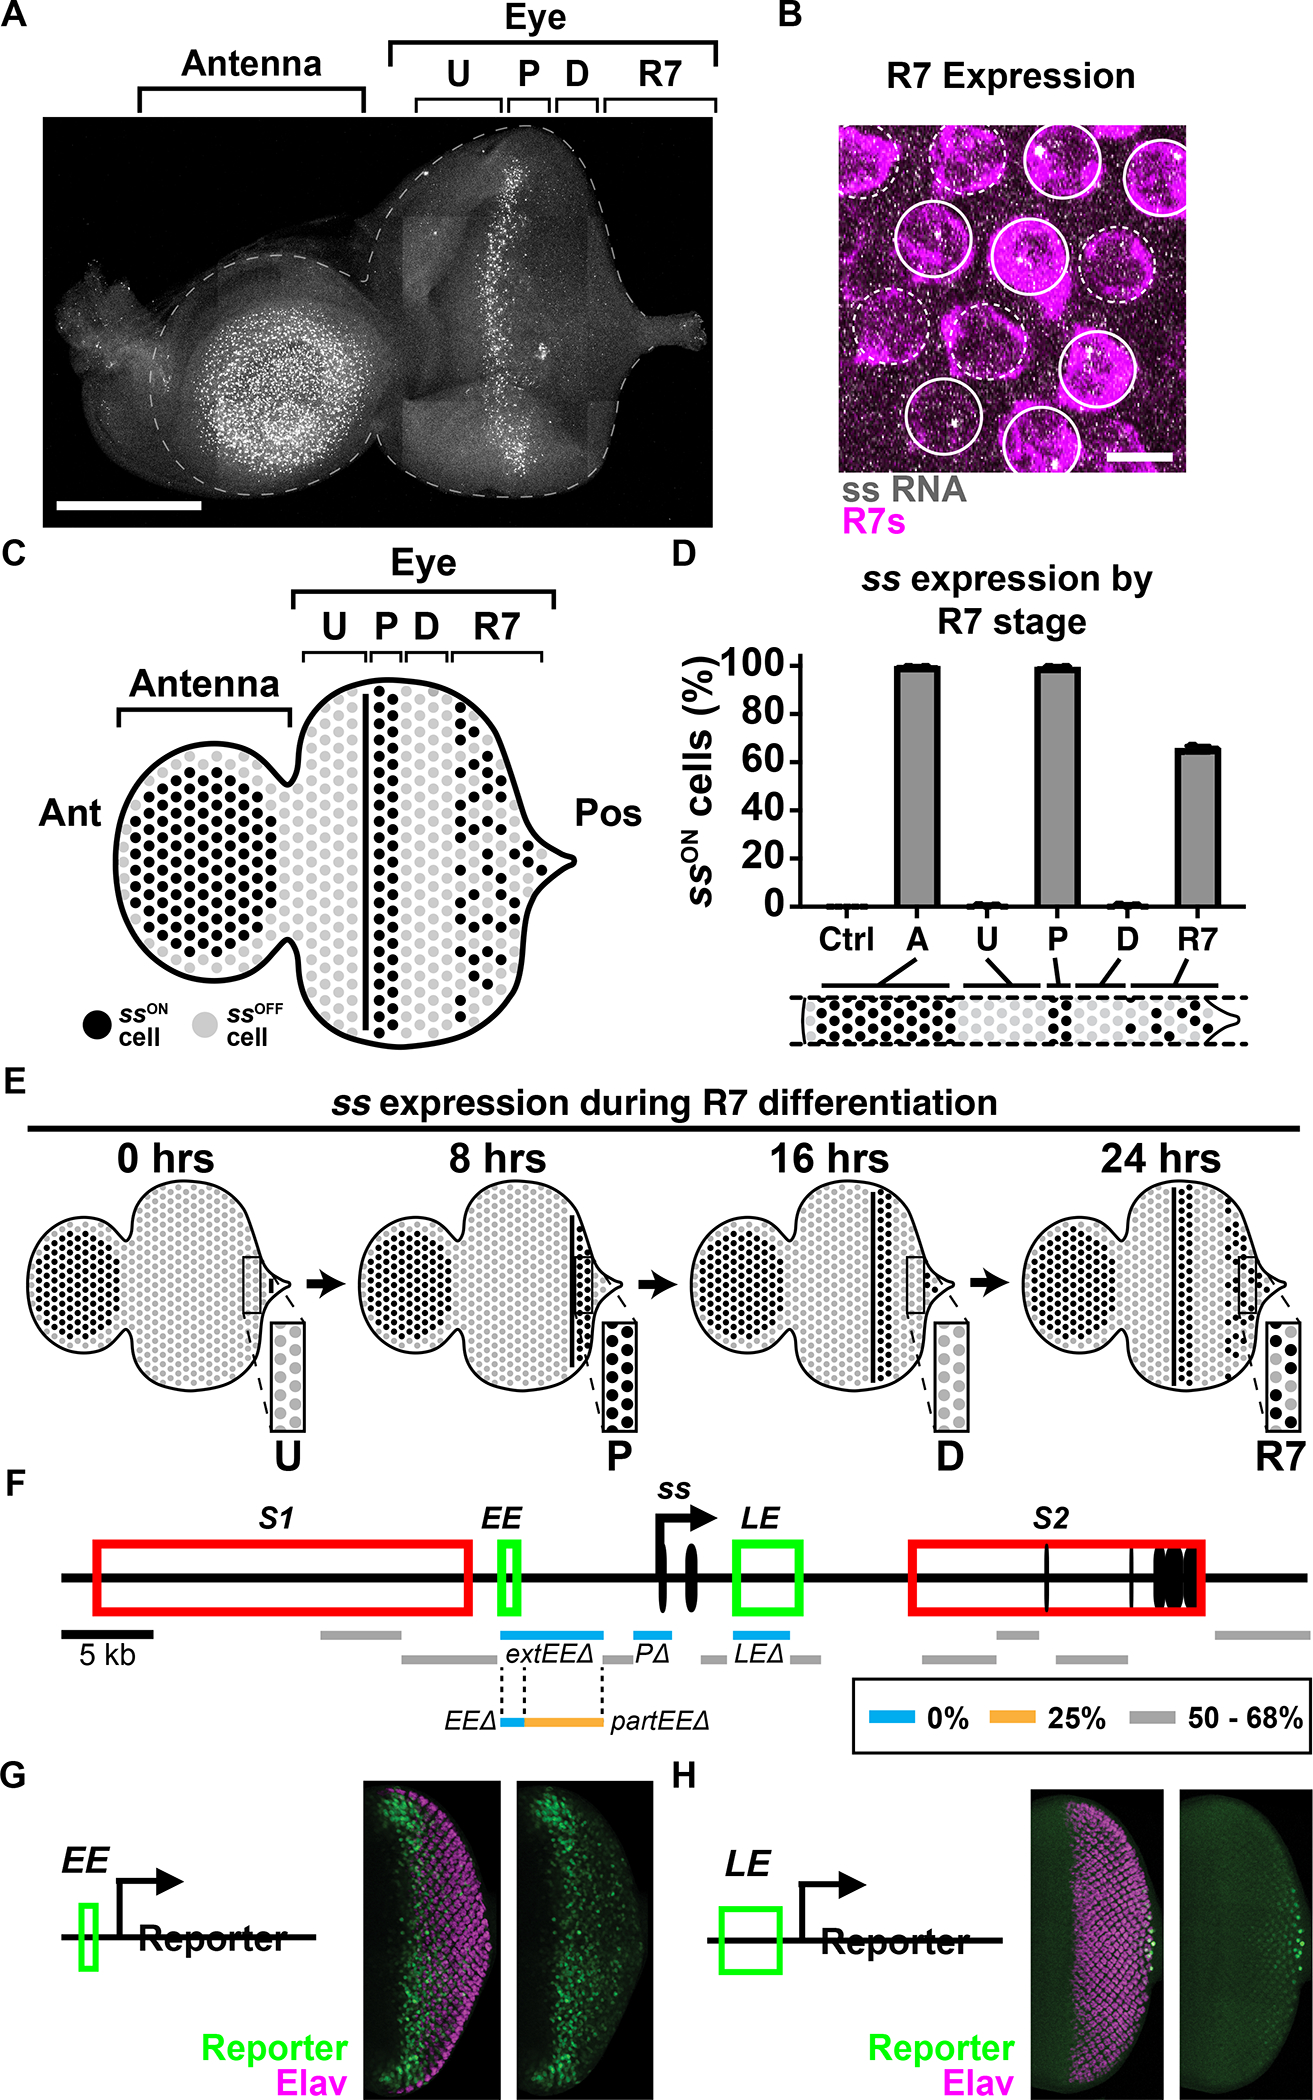
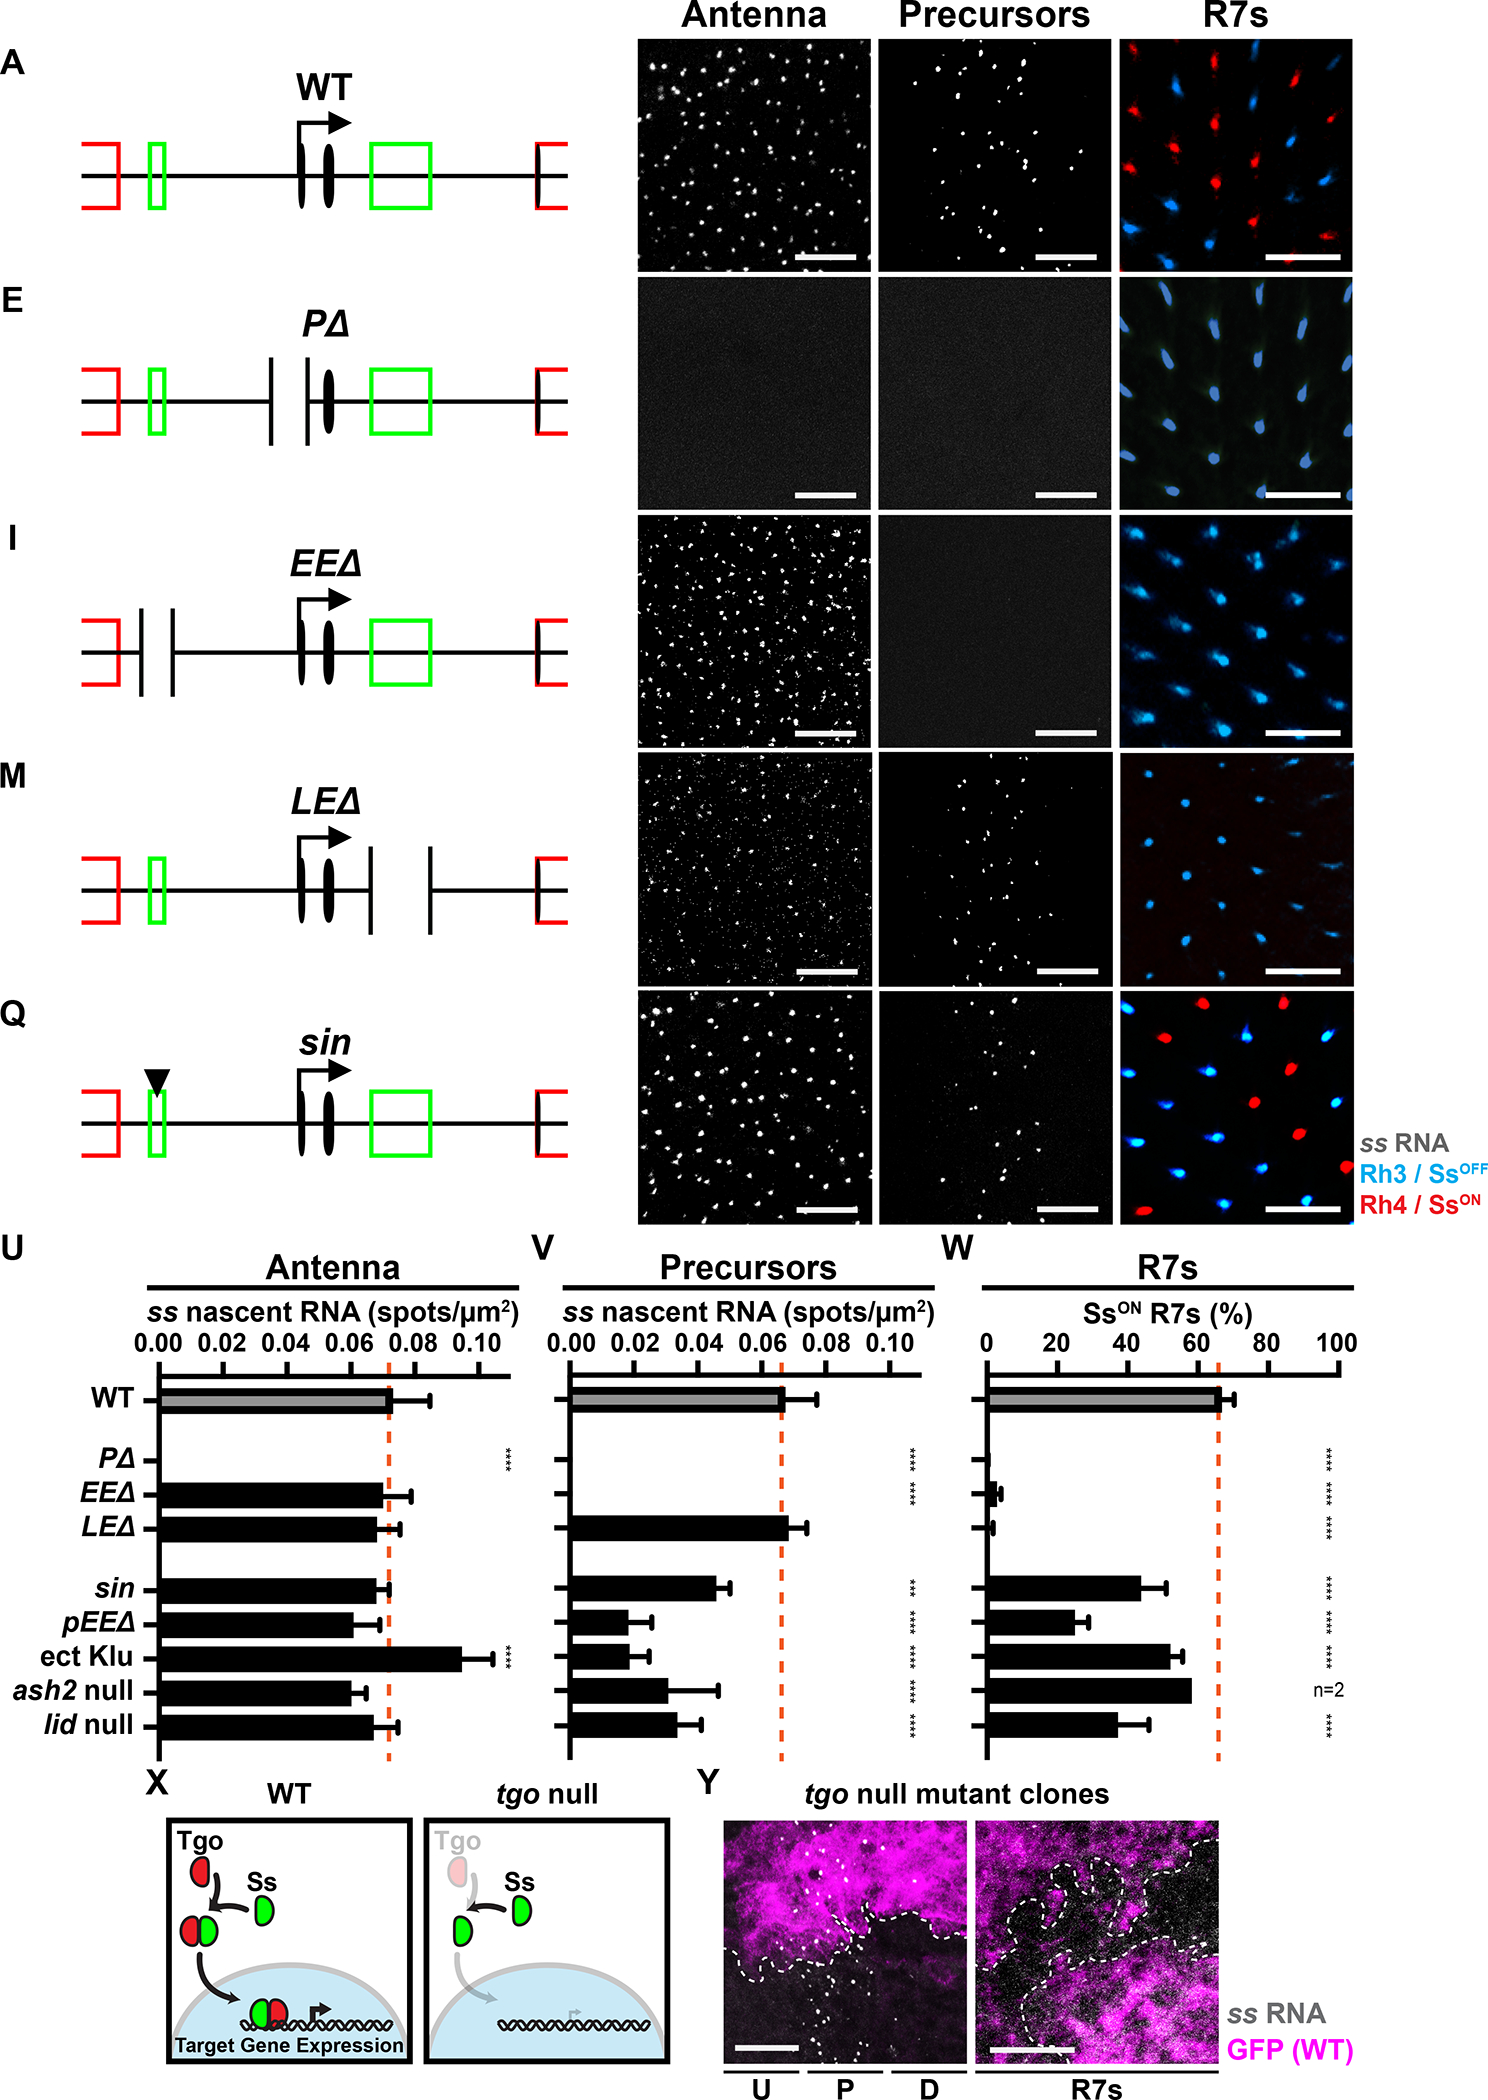
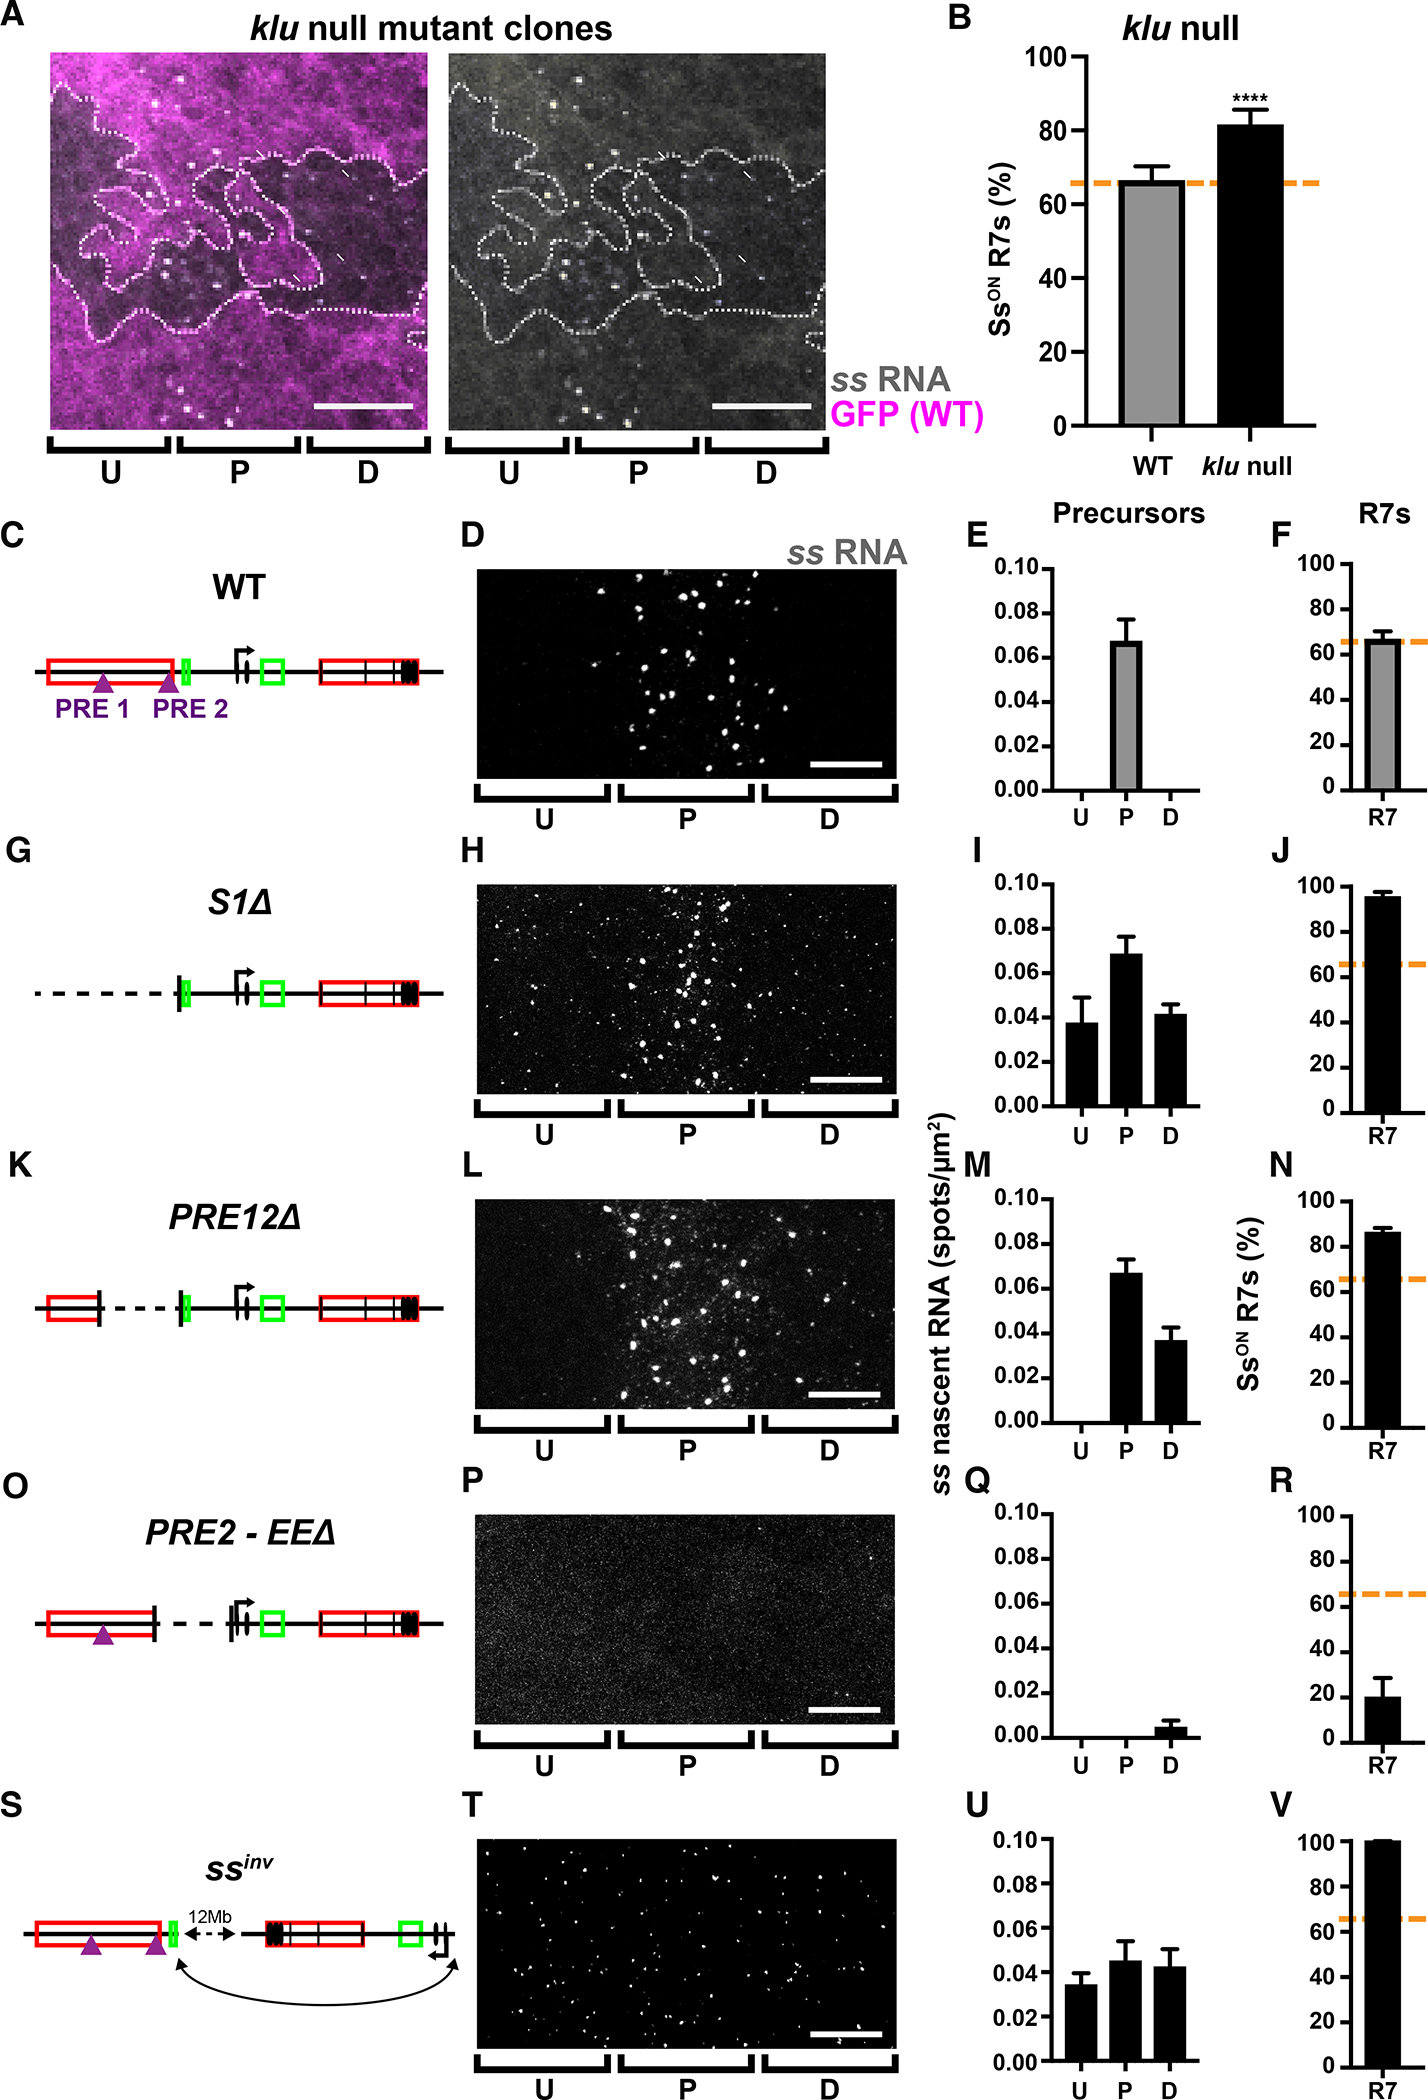
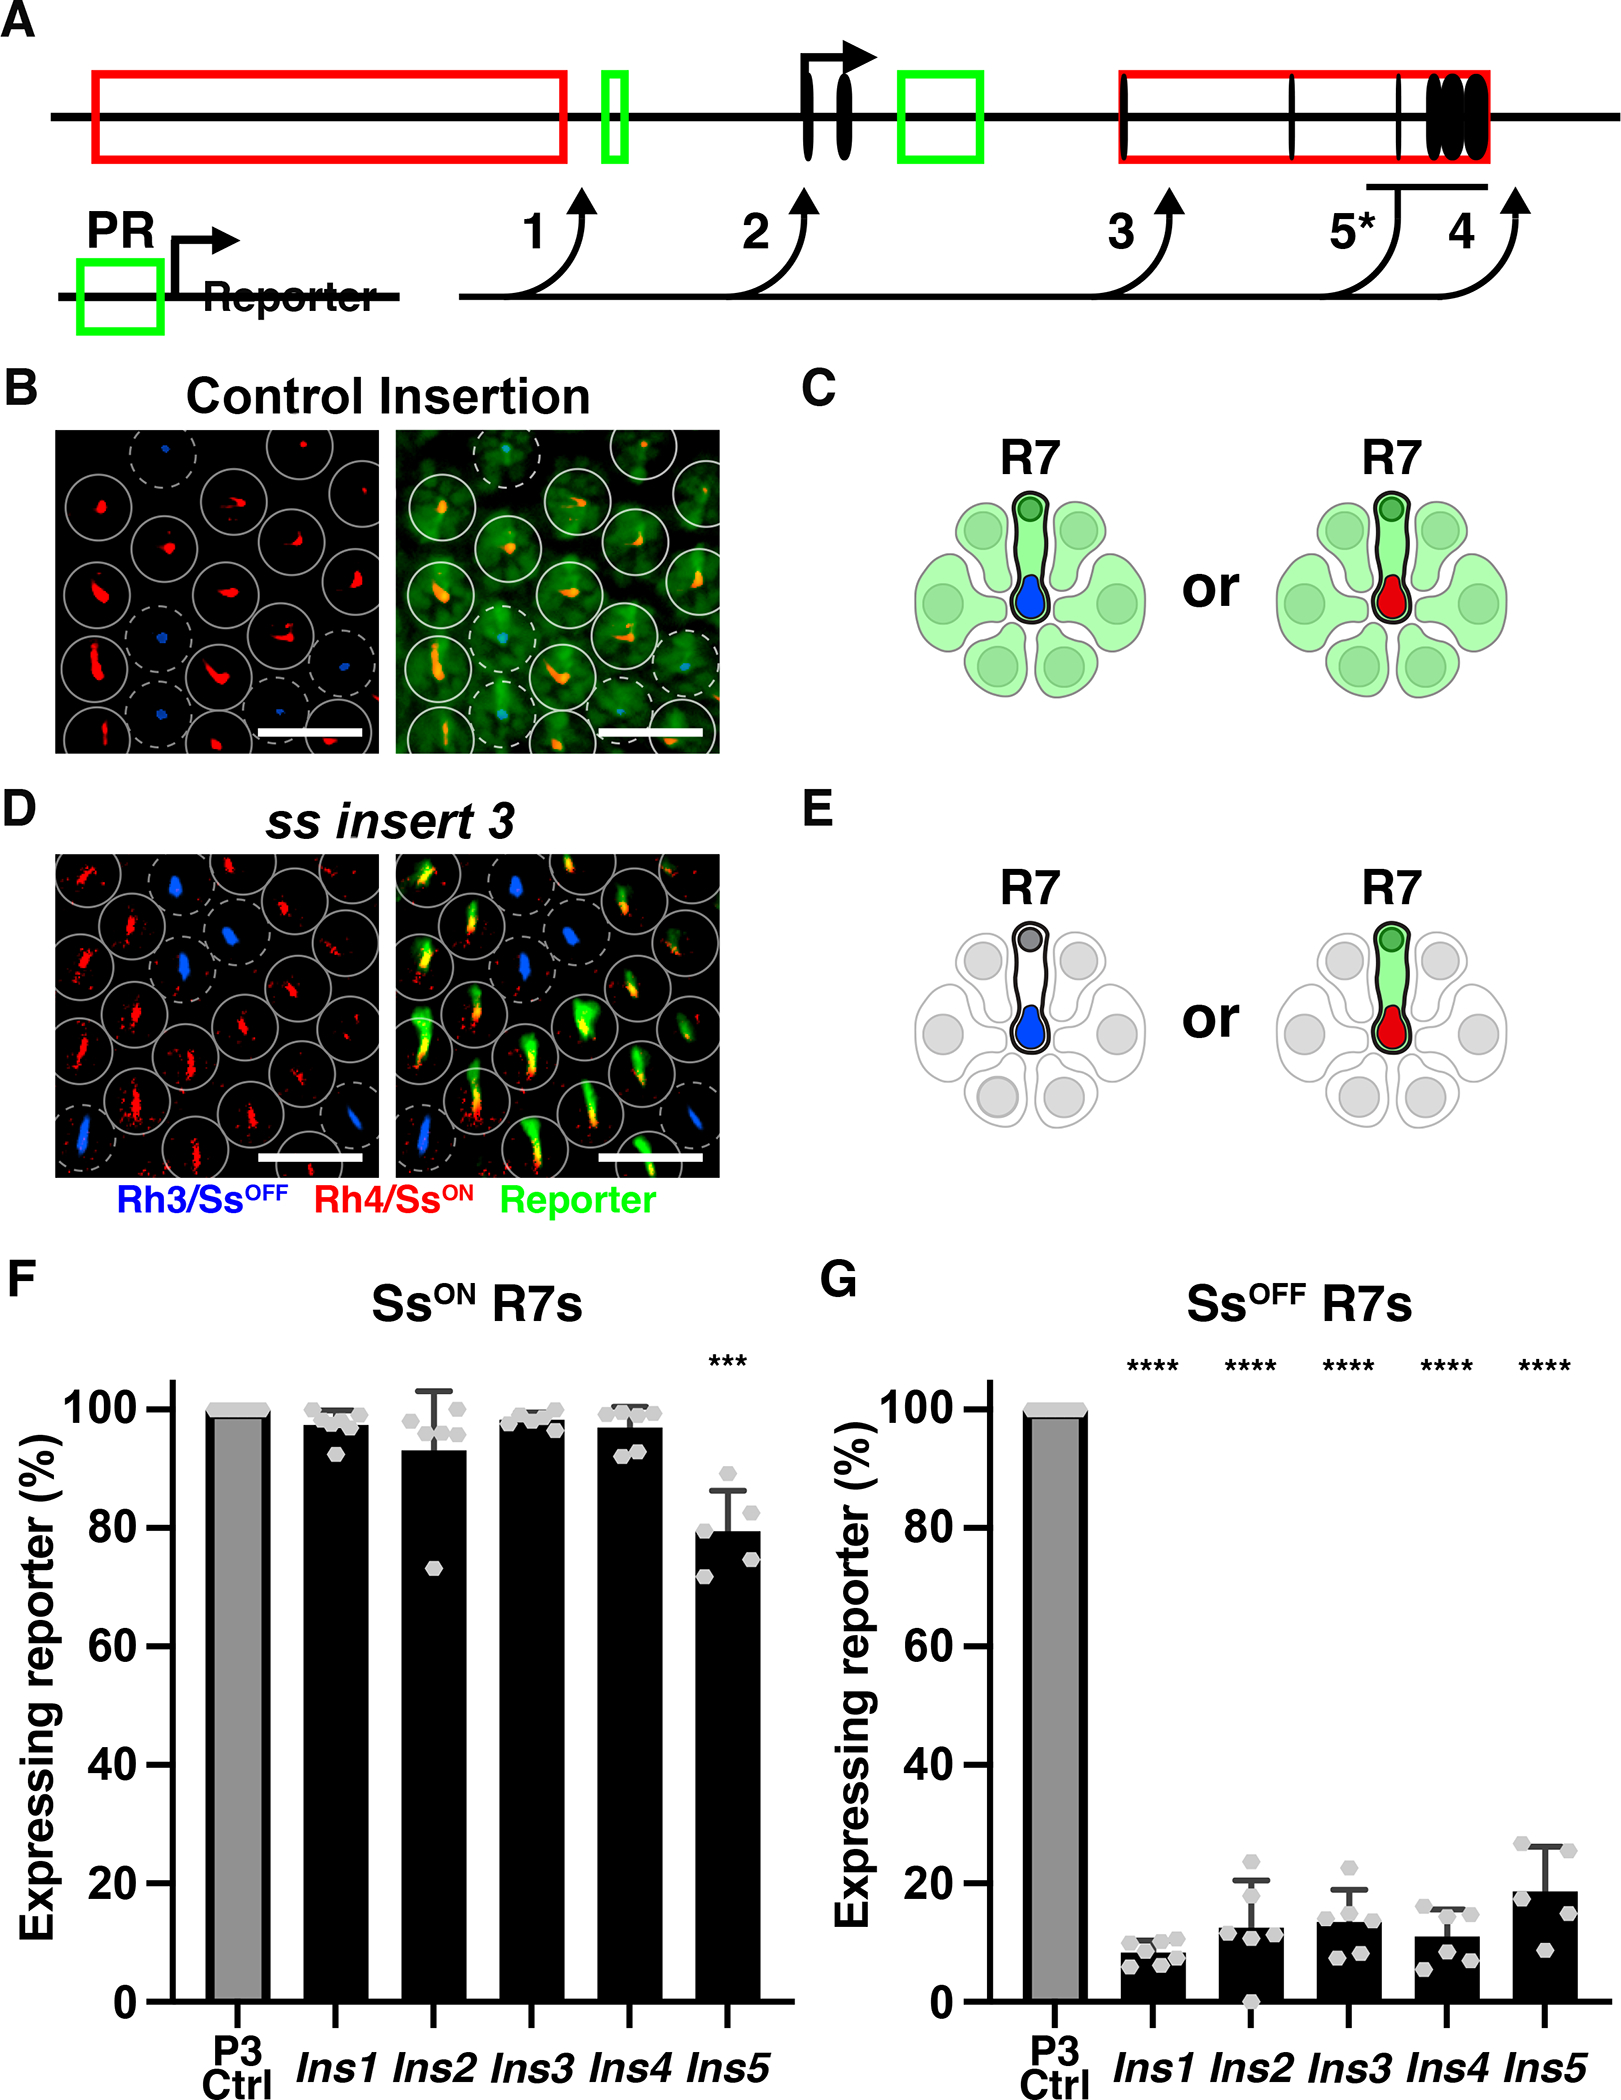
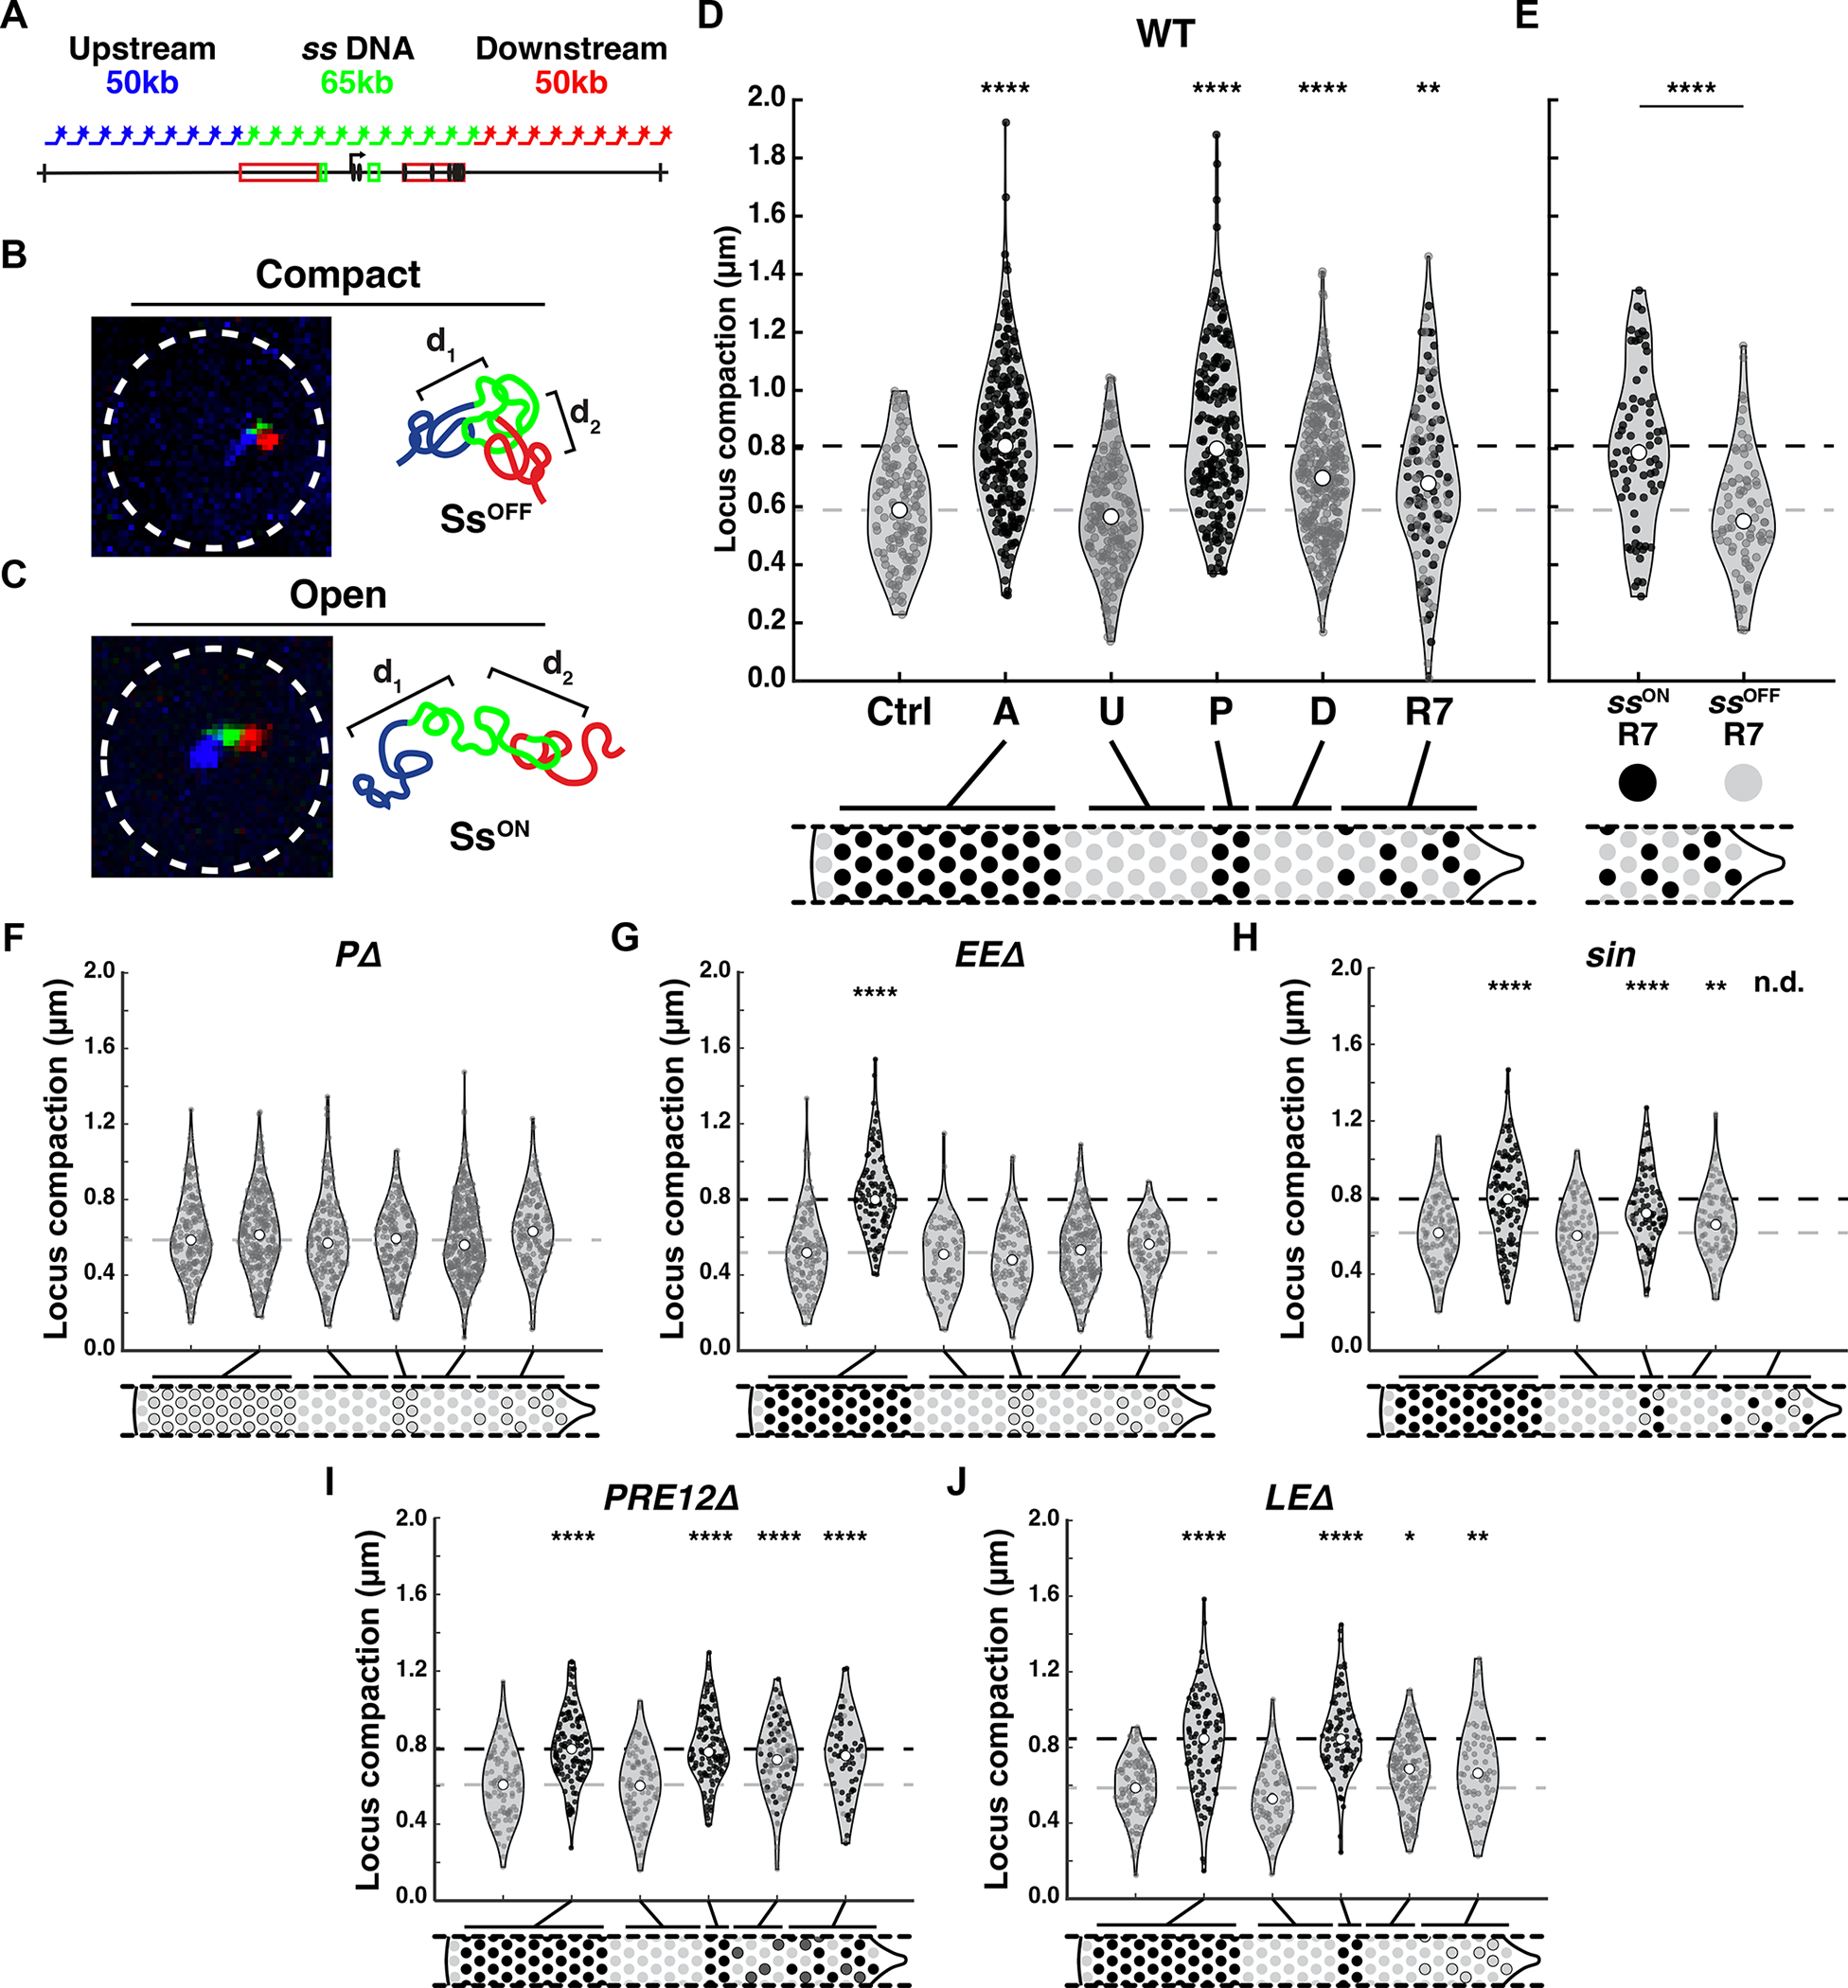
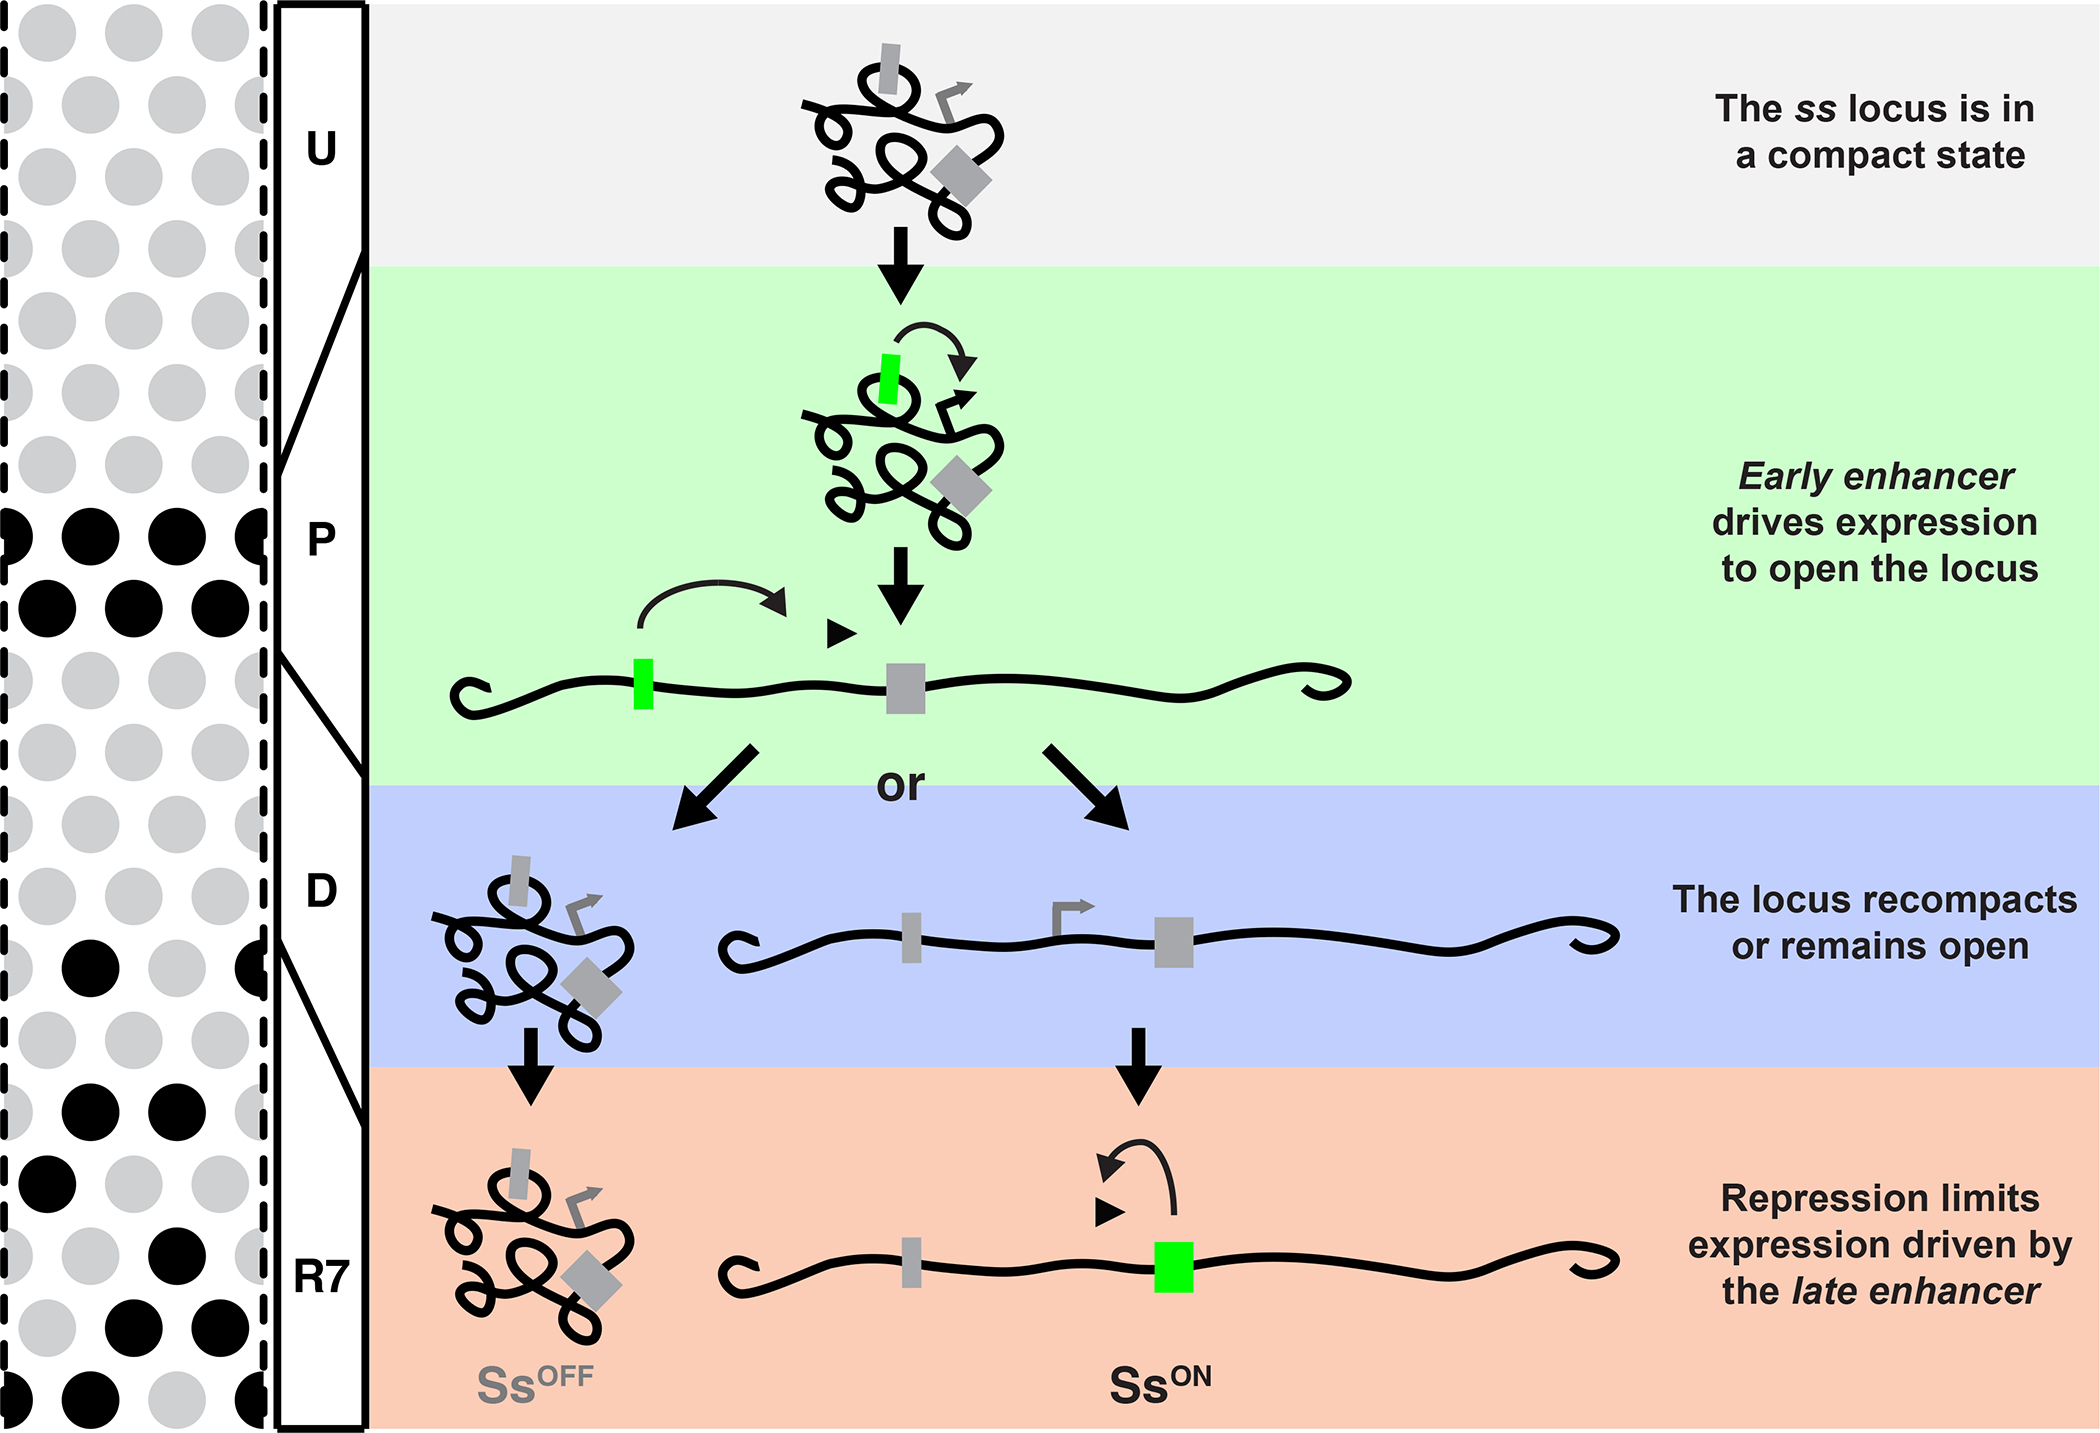
Stochastic mechanisms diversify cell fates during development. How cells randomly choose between two or more fates remains poorly understood. In the Drosophila eye, the random mosaic of two R7 photoreceptor subtypes is determined by expression of the transcription factor Spineless (Ss). We investigated how cis-regulatory elements and trans factors regulate nascent transcriptional activity and chromatin compaction at the ss gene locus during R7 development. The ss locus is in a compact state in undifferentiated cells. An early enhancer drives transcription in all R7 precursors, and the locus opens. In differentiating cells, transcription ceases and the ss locus stochastically remains open or compacts. In SsON R7s, ss is open and competent for activation by a late enhancer, whereas in SsOFF R7s, ss is compact, and repression prevents expression. Our results suggest that a temporally dynamic antagonism, in which transcription drives large-scale decompaction and then compaction represses transcription, controls stochastic fate specification.
Keywords: Ash2; Drosophila; Klumpfuss; Lid; Spineless; chromatin; enhancer; photoreceptor; retina; stochastic.
Copyright © 2022 Elsevier Inc. All rights reserved.
Conflict of interest statement
Declaration of interests The authors declare no competing interests.
Figures
Similar articles
-
Transcriptional priming and chromatin regulation during stochastic cell fate specification.Philos Trans R Soc Lond B Biol Sci. 2024 Apr 22;379(1900):20230046. doi: 10.1098/rstb.2023.0046. Epub 2024 Mar 4. Philos Trans R Soc Lond B Biol Sci. 2024. PMID: 38432315 Free PMC article. Review.
-
Interdependent regulation of stereotyped and stochastic photoreceptor fates in the fly eye.Dev Biol. 2021 Mar;471:89-96. doi: 10.1016/j.ydbio.2020.12.008. Epub 2020 Dec 14. Dev Biol. 2021. PMID: 33333066 Free PMC article.
-
Regional modulation of a stochastically expressed factor determines photoreceptor subtypes in the Drosophila retina.Dev Cell. 2013 Apr 15;25(1):93-105. doi: 10.1016/j.devcel.2013.02.016. Dev Cell. 2013. PMID: 23597484 Free PMC article.
-
Natural variation in stochastic photoreceptor specification and color preference in Drosophila.Elife. 2017 Dec 18;6:e29593. doi: 10.7554/eLife.29593. Elife. 2017. PMID: 29251595 Free PMC article.
-
Lessons about terminal differentiation from the specification of color-detecting photoreceptors in the Drosophila retina.Ann N Y Acad Sci. 2013 Jul;1293:33-44. doi: 10.1111/nyas.12178. Epub 2013 Jun 19. Ann N Y Acad Sci. 2013. PMID: 23782311 Review.
Cited by
-
Transcriptional repression in stochastic gene expression, patterning, and cell fate specification.Dev Biol. 2022 Jan;481:129-138. doi: 10.1016/j.ydbio.2021.10.002. Epub 2021 Oct 21. Dev Biol. 2022. PMID: 34688689 Free PMC article.
-
Neuronal birthdate reveals topography in a vestibular brainstem circuit for gaze stabilization.Curr Biol. 2023 Apr 10;33(7):1265-1281.e7. doi: 10.1016/j.cub.2023.02.048. Epub 2023 Mar 15. Curr Biol. 2023. PMID: 36924768 Free PMC article.
-
Cell fate ratios are encoded by transcriptional dynamics in the Drosophila retina.Curr Biol. 2025 Jun 23;35(12):2946-2959.e5. doi: 10.1016/j.cub.2025.05.037. Epub 2025 Jun 10. Curr Biol. 2025. PMID: 40499552
-
Transcriptional priming and chromatin regulation during stochastic cell fate specification.Philos Trans R Soc Lond B Biol Sci. 2024 Apr 22;379(1900):20230046. doi: 10.1098/rstb.2023.0046. Epub 2024 Mar 4. Philos Trans R Soc Lond B Biol Sci. 2024. PMID: 38432315 Free PMC article. Review.
-
Single-cell chromatin state transitions during epigenetic memory formation.bioRxiv [Preprint]. 2023 Oct 5:2023.10.03.560616. doi: 10.1101/2023.10.03.560616. bioRxiv. 2023. PMID: 37873344 Free PMC article. Preprint.
References
Publication types
MeSH terms
Substances
Grants and funding
LinkOut - more resources
Full Text Sources
Molecular Biology Databases
Miscellaneous
