. 2022 Aug;298(8):102254.
doi: 10.1016/j.jbc.2022.102254. Epub 2022 Jul 11.

Profiling 26,000 Aplysia californica neurons by single cell mass spectrometry reveals neuronal populations with distinct neuropeptide profiles

Affiliations

Profiling 26,000 Aplysia californica neurons by single cell mass spectrometry reveals neuronal populations with distinct neuropeptide profiles

Peter C Chan-Andersen et al. J Biol Chem. 2022 Aug.

Abstract

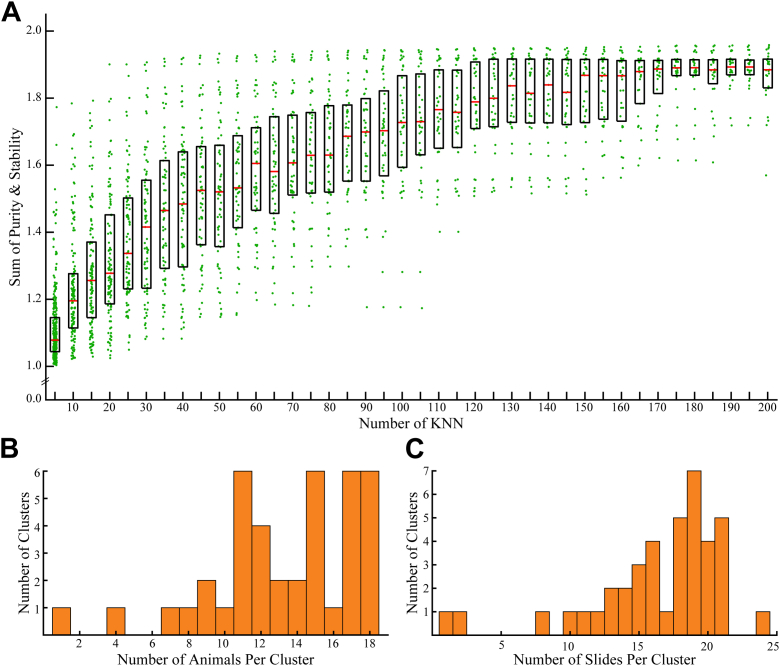
Neuropeptides are a chemically diverse class of cell-to-cell signaling molecules that are widely expressed throughout the central nervous system, often in a cell-specific manner. While cell-to-cell differences in neuropeptides is expected, it is often unclear how exactly neuropeptide expression varies among neurons. Here we created a microscopy-guided, high-throughput single cell matrix-assisted laser desorption/ionization mass spectrometry approach to investigate the neuropeptide heterogeneity of individual neurons in the central nervous system of the neurobiological model Aplysia californica, the California sea hare. In all, we analyzed more than 26,000 neurons from 18 animals and assigned 866 peptides from 66 prohormones by mass matching against an in silico peptide library generated from known Aplysia prohormones retrieved from the UniProt database. Louvain-Jaccard (LJ) clustering of mass spectra from individual neurons revealed 40 unique neuronal populations, or LJ clusters, each with a distinct neuropeptide profile. Prohormones and their related peptides were generally found in single cells from ganglia consistent with the prohormones' previously known ganglion localizations. Several LJ clusters also revealed the cellular colocalization of behaviorally related prohormones, such as an LJ cluster exhibiting achatin and neuropeptide Y, which are involved in feeding, and another cluster characterized by urotensin II, small cardiac peptide, sensorin A, and FRFa, which have shown activity in the feeding network or are present in the feeding musculature. This mass spectrometry-based approach enables the robust categorization of large cell populations based on single cell neuropeptide content and is readily adaptable to the study of a range of animals and tissue types.

Keywords: Aplysia californica; Louvain–Jaccard; central nervous system; mass spectrometry; neuron; neuropeptide; peptides; single cell.


Conflict of interest statement

Conflict of interest The authors declare that they have no conflicts of interest with the contents of this article.

Figures

Figure 1
Figure 1
Sample processing and data analysis workflow for high-throughput single cell mass spectrometry.A, Aplysia ganglia are dissected and individually isolated. B, stabilized ganglia are manipulated across slides to diffusely disperse individual cells. C, cells are identified and their positions recorded using microMS. D, MALDI matrix is applied. E, using the .xeo files from microMS single cells are sampled. F, peak lists are constructed for each cell by peptide mass fingerprinting using a 60-ppm mass error. G, the KNN of each cell is used to construct a KNN graph, which is Louvain–Jaccard (LJ) clustered. H, the appropriate KNN for LJ clustering is determined by bootstrap analysis. I, LJ clusters are defined by a unique colocalization of peptides. KNN, k-nearest neighbors; S/N, signal-to-noise ratio.
Figure 2
Figure 2
Results of LJ clustering and bootstrapping analysis of data obtained using high-throughput single cell mass spectrometry peptide profiling.A, results of the bootstrapping experiment. Each dot represents the sum of stability and purity metrics for each all-cell set LJ cluster at a given KNN. The black boxes denote the range between the 75th and 25th percentiles, and the red bars mark the median value. The plateauing of stability and purity after KNN 100 indicates it as the optimal KNN for the data set. B, histogram showing the number of animals represented in each of the 40 clusters resulting from 100 KNN LJ clustering after merging redundant clusters; a total of 18 animals were used. An animal was determined to contribute to a cluster if more than 2% of a cluster’s cell came from a given animal. C, histogram showing the number of indium tin oxide glass slides whose cells contributed to each of the 40 clusters resulting from 100 KNN LJ clustering after merging redundant clusters. In total, 52 sample slides were used. A slide was determined to contribute to a cluster if more than 2% of a cluster’s cells came from a given slide. KNN, k-nearest neighbors; LJ, Louvain–Jaccard.
Figure 3
Figure 3
LJ clustering of single Aplysia californica neuron mass spectra. LJ clusters were determined using a k-nearest neighbors of 100 and the assigned peptides within each cell. As determined by a chi-square test of independence, a subset of 108 of the 866 assigned Aplysia peptides were found at different frequencies in at least one LJ cluster. Each cluster is defined by a unique combination of assigned peptides and/or cellular frequency of their detection. For clarity, only 65 peptides are shown (all 108 peptides can be seen in Fig. S3). The prohormone name and related peptide monoisotopic m/z is given on the ordinate. Circle size corresponds to a peptide’s frequency of detection in each cluster. Color scale depicts the average peptide signal-to-noise ratio (S/N) in a given cluster. LJ, Louvain–Jaccard.
Figure 4
Figure 4
High-throughput MALDI mass spectrometry analysis of BCNs. Mass spectra peak annotations include peptide monoisotopic m/z and the peptide name. A, the sequence of Aplysia ELH (ELH, P01362) preprohormone. Sequences of known peptides formed during its processing are color coded. Orange, beta-BCP; pink, gamma-BCP; red, delta-BCP; dark blue, alpha-BCP; green, epsilon-BCP; purple, ELH; light blue, acidic peptide. B, the annotated average mass spectrum of cells from LJ cluster 2. Cells from this cluster have the greatest ELH prohormone peptide coverage of any LJ cluster found in this study. C and D, examples of mass spectra acquired from manually isolated single BCNs. The same ELH peptide signals are present in both the average mass spectrum and the mass spectra obtained from manually isolated and individually sampled single BCNs. BCN, bag cell neurons; BCPs, bag cell peptide; ELH, egg laying hormone; LJ, Louvain–Jaccard.
Figure 5
Figure 5
Average mass spectra and ganglia localization of cells represented by several individual Louvain–Jaccard clusters. Mass spectra annotations include peptide monoisotopic m/z and the peptide’s prohormone name. Insets: pie charts showing what percentage of cells in each cluster come from each ganglion. A, LJ cluster 1 average mass spectrum; a primarily abdominal neuron containing LJ cluster defined by L11 and R3-14 peptides. B, LJ cluster 9 average mass spectrum; a primarily cerebral neuron containing LJ clusters defined by cerebral peptide 1 (CP1) peptides. C, LJ cluster 34 average mass spectrum; an exclusively cerebral neuron containing LJ cluster defined by cerebrin peptides. D, LJ cluster 4 average mass spectrum; a primarily pedal neuron containing LJ cluster defined by pedal peptide (PEP) peptides. E, LJ cluster 37 average mass spectrum; a primarily pedal neuron containing LJ cluster defined by myomodulin 2 (MM2) peptides.
Figure 6
Figure 6
Coexpression of multiple prohormone-related peptides in the average mass spectra of all cells within their respective Louvain–Jaccard clusters. The different prohormones seen in each mass spectrum have been previously shown to colocalize in individual neurons (59, 61). The peptides colocalize in neurons that form distinct Louvain–Jaccard clusters out of all of the 26,797 Aplysia cells sampled, shown here for (A) Cluster 35 and (B) Cluster 7. Mass spectrum annotations include peptide monoisotopic m/z and the peptide prohormone names.

References

    1. Fricker L.D. Neuropeptide-processing enzymes: applications for Drug discovery. Drug Addict. Basic Res. Ther. 2008;7:497–509. - PMC - PubMed
    1. Strand F.L. In: Handbook of Comtemporary Neuropharmacology. Sibley D., Hanin I., Kuhar M., Skolnick P., editors. John Wiley & Sons; New York, NY: 2007. Neuropeptides; pp. 669–704.
    1. Hillebrand J.J.G., De Wied D., Adan R.A.H. Neuropeptides, food intake and body weight regulation: a hypothalamic focus. Peptides. 2002;23:2283–2306. - PubMed
    1. Xu P., Hall A.K. The role of activin in neuropeptide induction and pain sensation. Dev. Biol. 2006;299:303–309. - PubMed
    1. Lee J.E., Atkins N., Hatcher N.G., Zamdborg L., Gillette M.U., Sweedler J.V., et al. Endogenous peptide discovery of the rat circadian clock. Mol. Cell Proteomics. 2010;9:285–297. - PMC - PubMed

Publication types

MeSH terms

LinkOut - more resources