

Treatment Outcomes in the Primary Tube Versus Trabeculectomy Study after 5 Years of Follow-up
- PMID: 35835337
- PMCID: PMC9691551
- DOI: 10.1016/j.ophtha.2022.07.003
Treatment Outcomes in the Primary Tube Versus Trabeculectomy Study after 5 Years of Follow-up
Abstract
Purpose: To report 5-year treatment outcomes in the Primary Tube Versus Trabeculectomy (PTVT) Study.
Design: Multicenter randomized clinical trial.
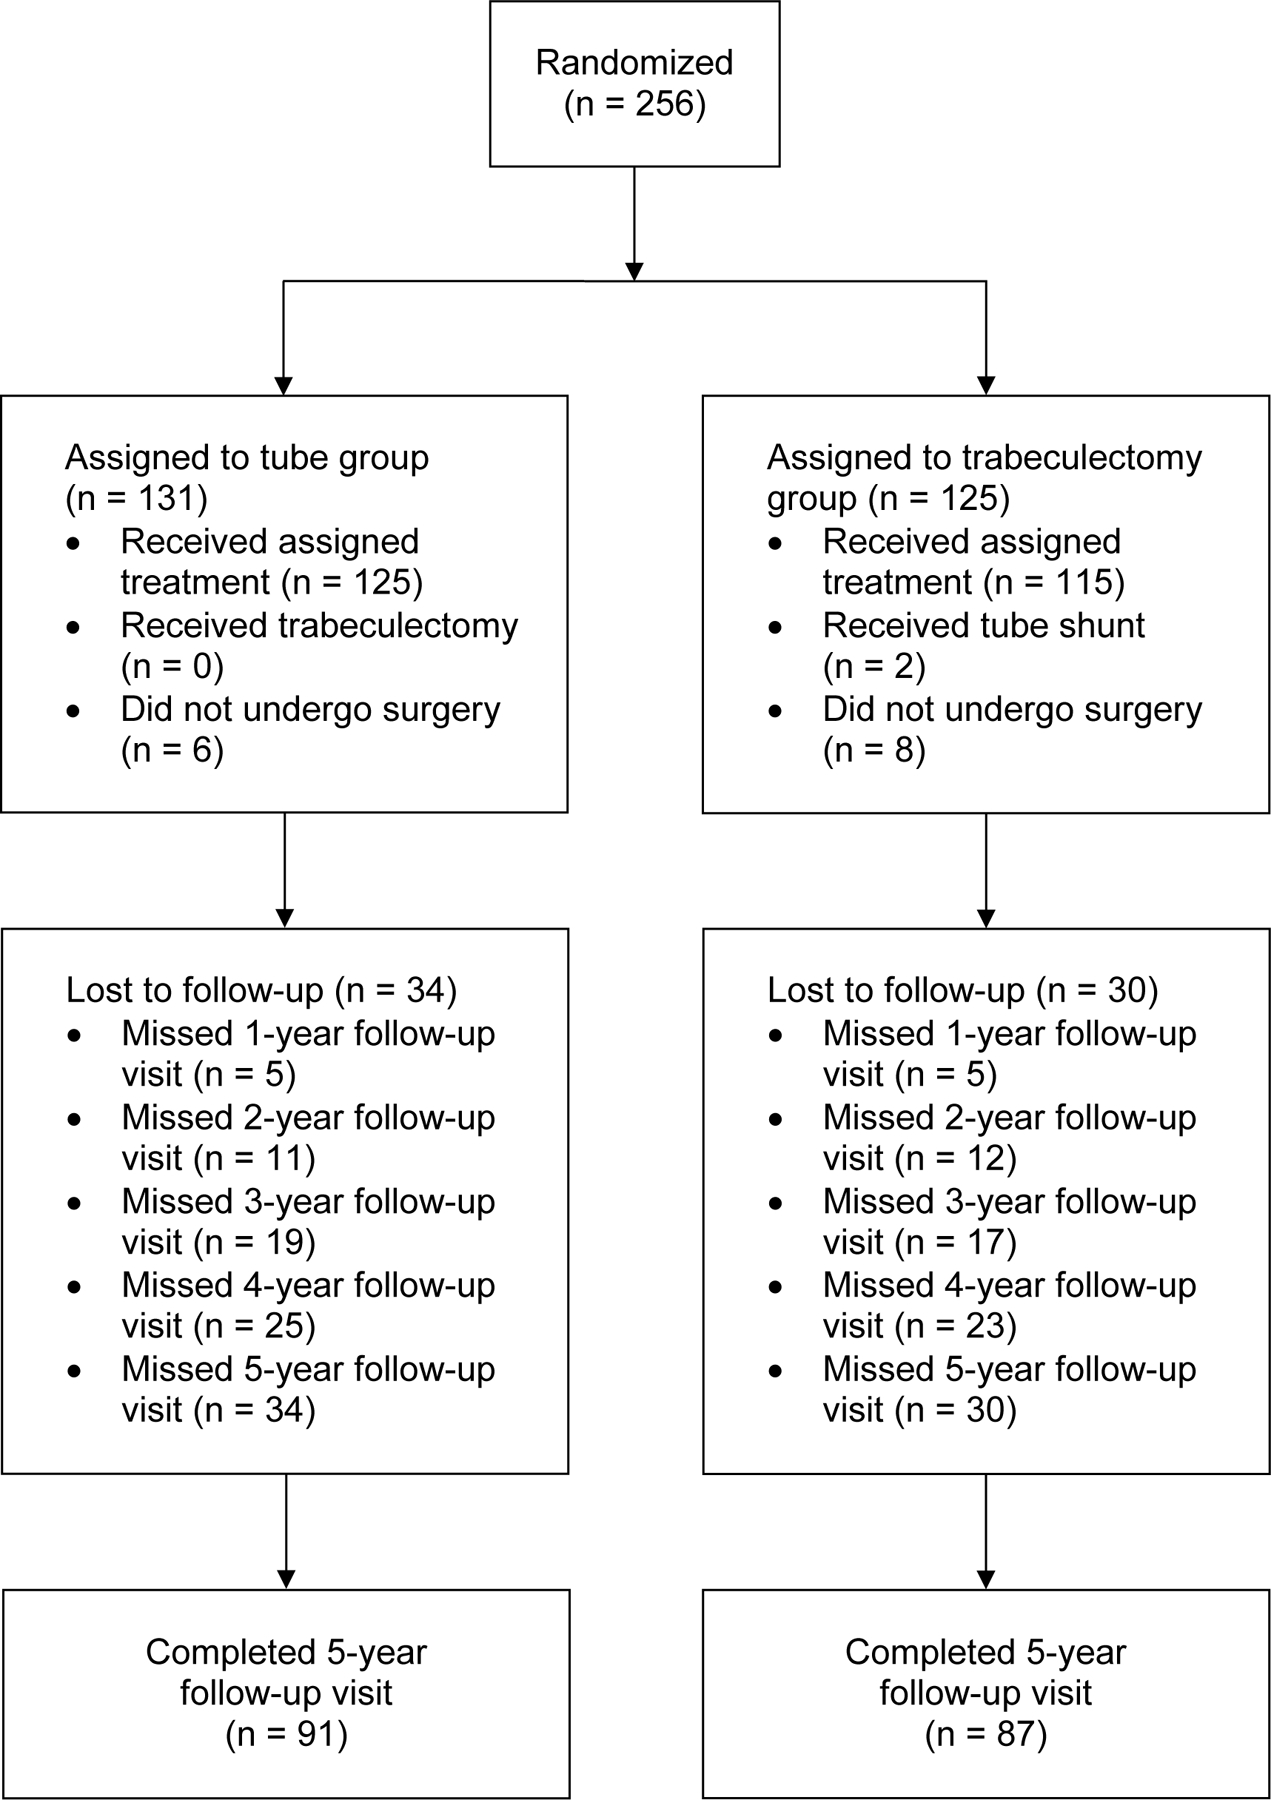
Participants: A total of 242 eyes of 242 patients with medically uncontrolled glaucoma and no previous incisional ocular surgery, including 125 patients in the tube group and 117 patients in the trabeculectomy group.
Methods: Patients were enrolled at 16 clinical centers and randomly assigned to treatment with a tube shunt (350-mm2 Baerveldt glaucoma implant) or trabeculectomy with mitomycin C (MMC) (0.4 mg/ml for 2 minutes).
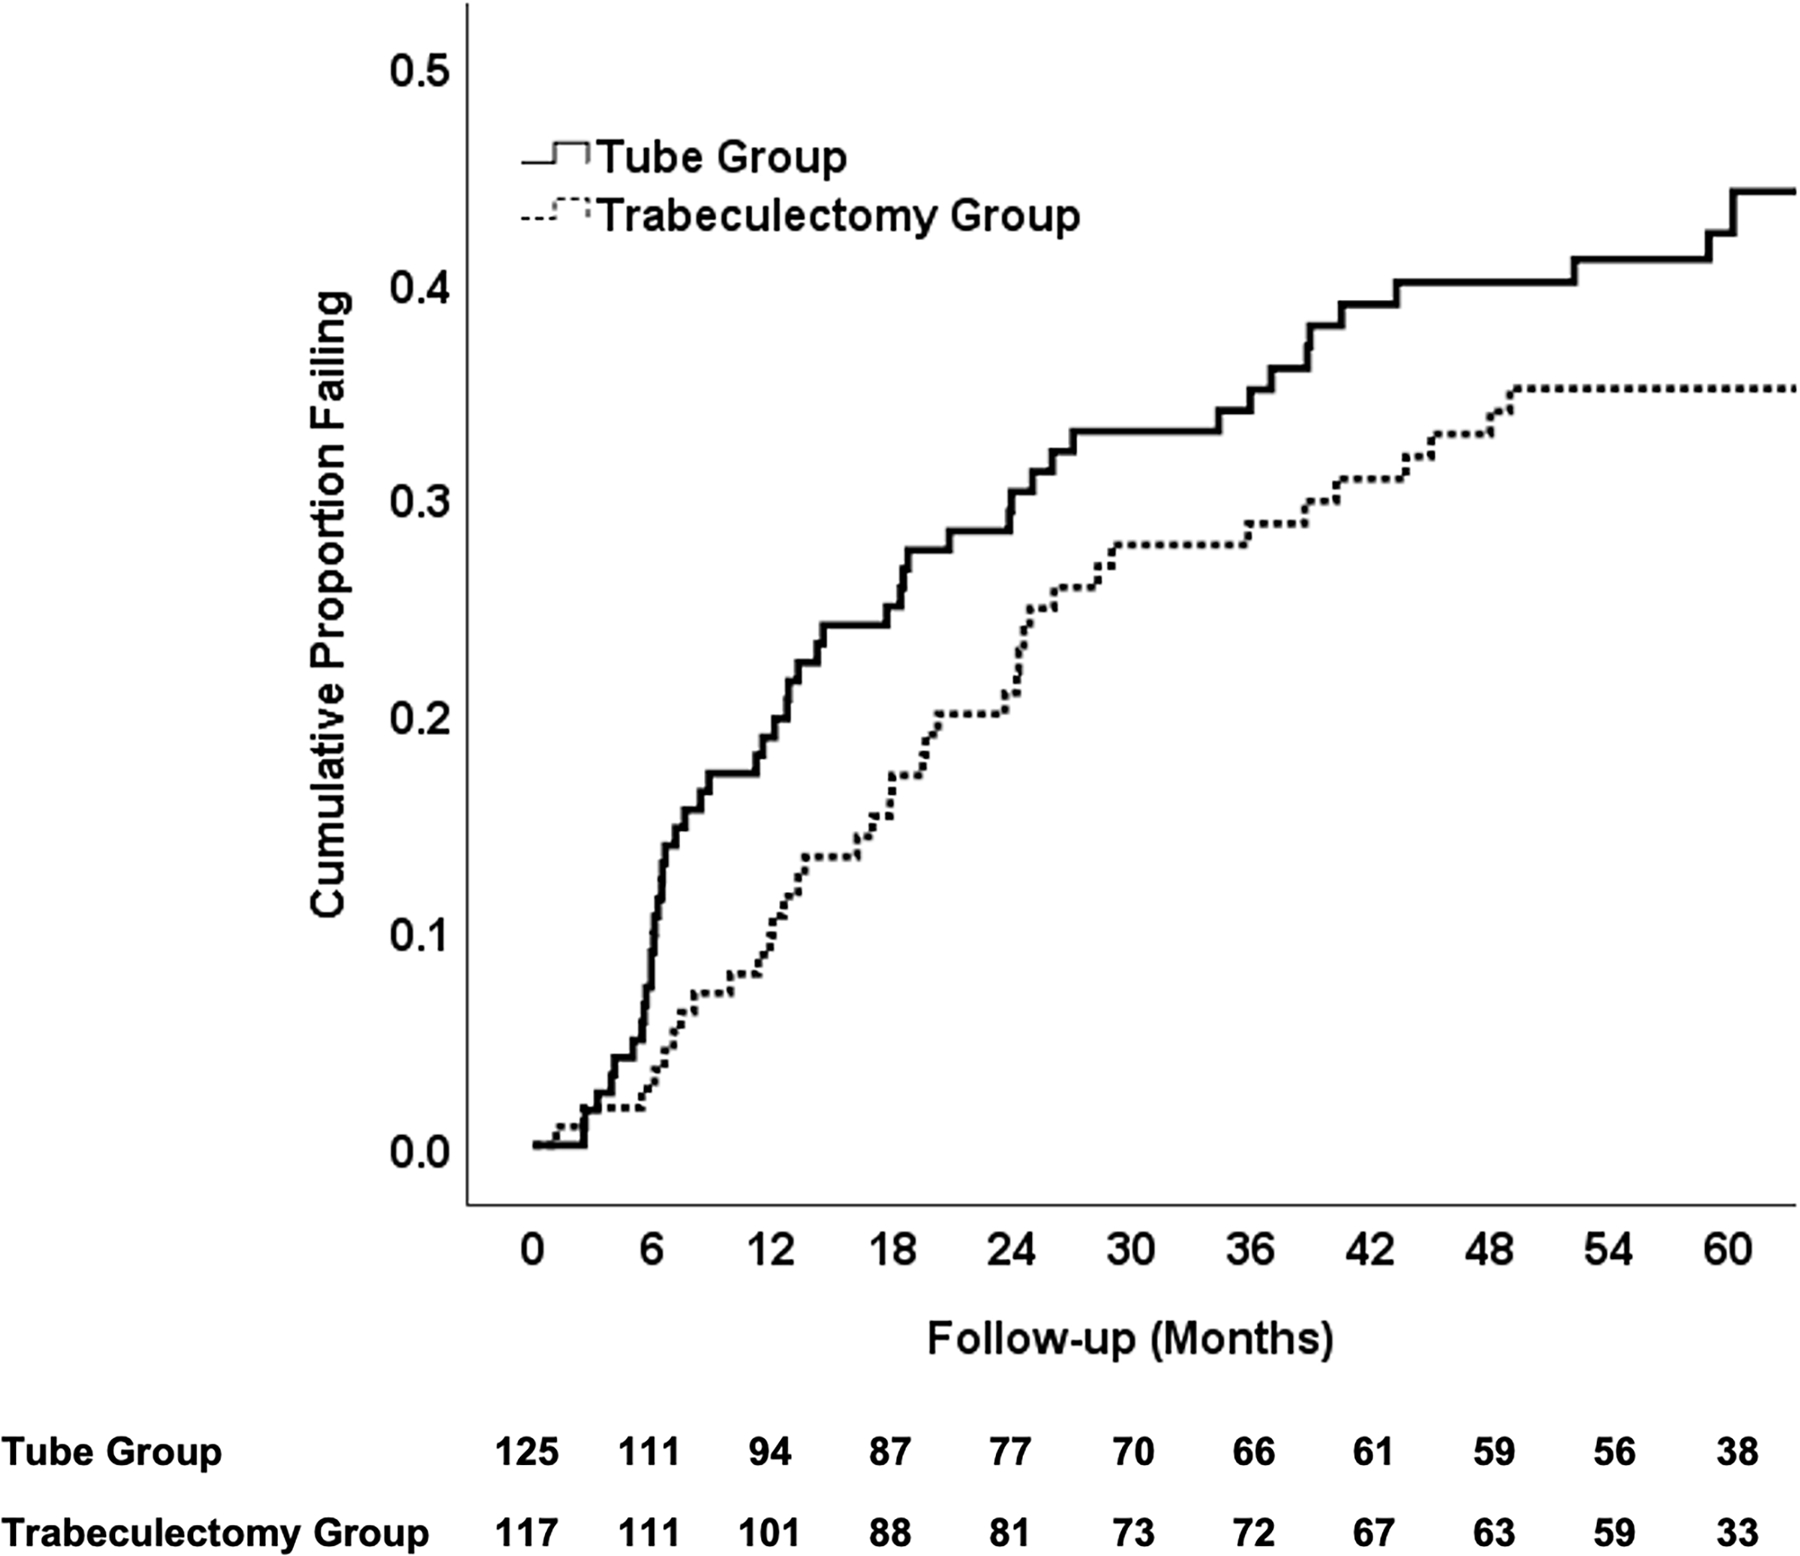
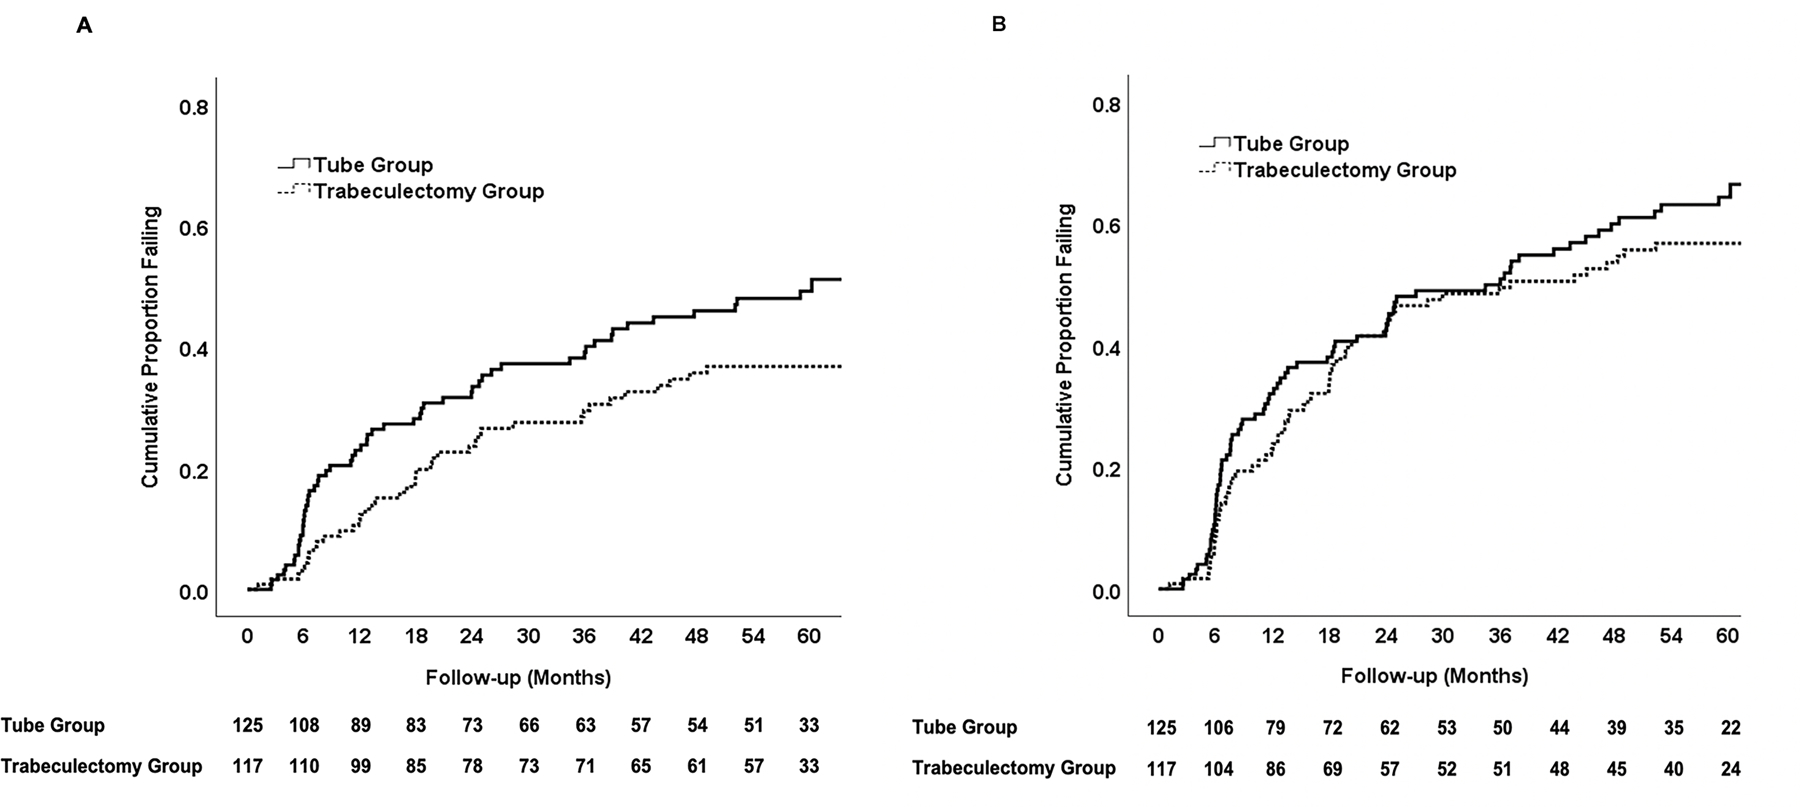
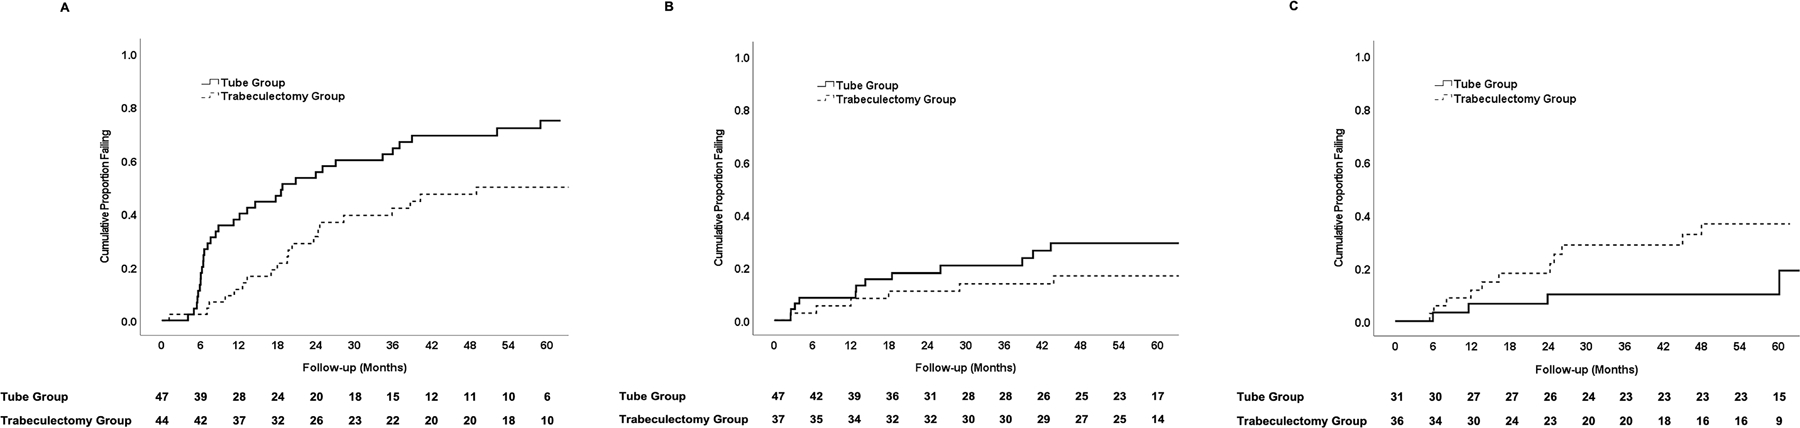
Main outcome measures: The primary outcome measure was the rate of surgical failure, defined as intraocular pressure (IOP) > 21 mmHg or reduced < 20% from baseline, IOP ≤ 5 mmHg, reoperation for glaucoma, or loss of light perception. Secondary outcome measures included IOP, glaucoma medical therapy, and visual acuity.
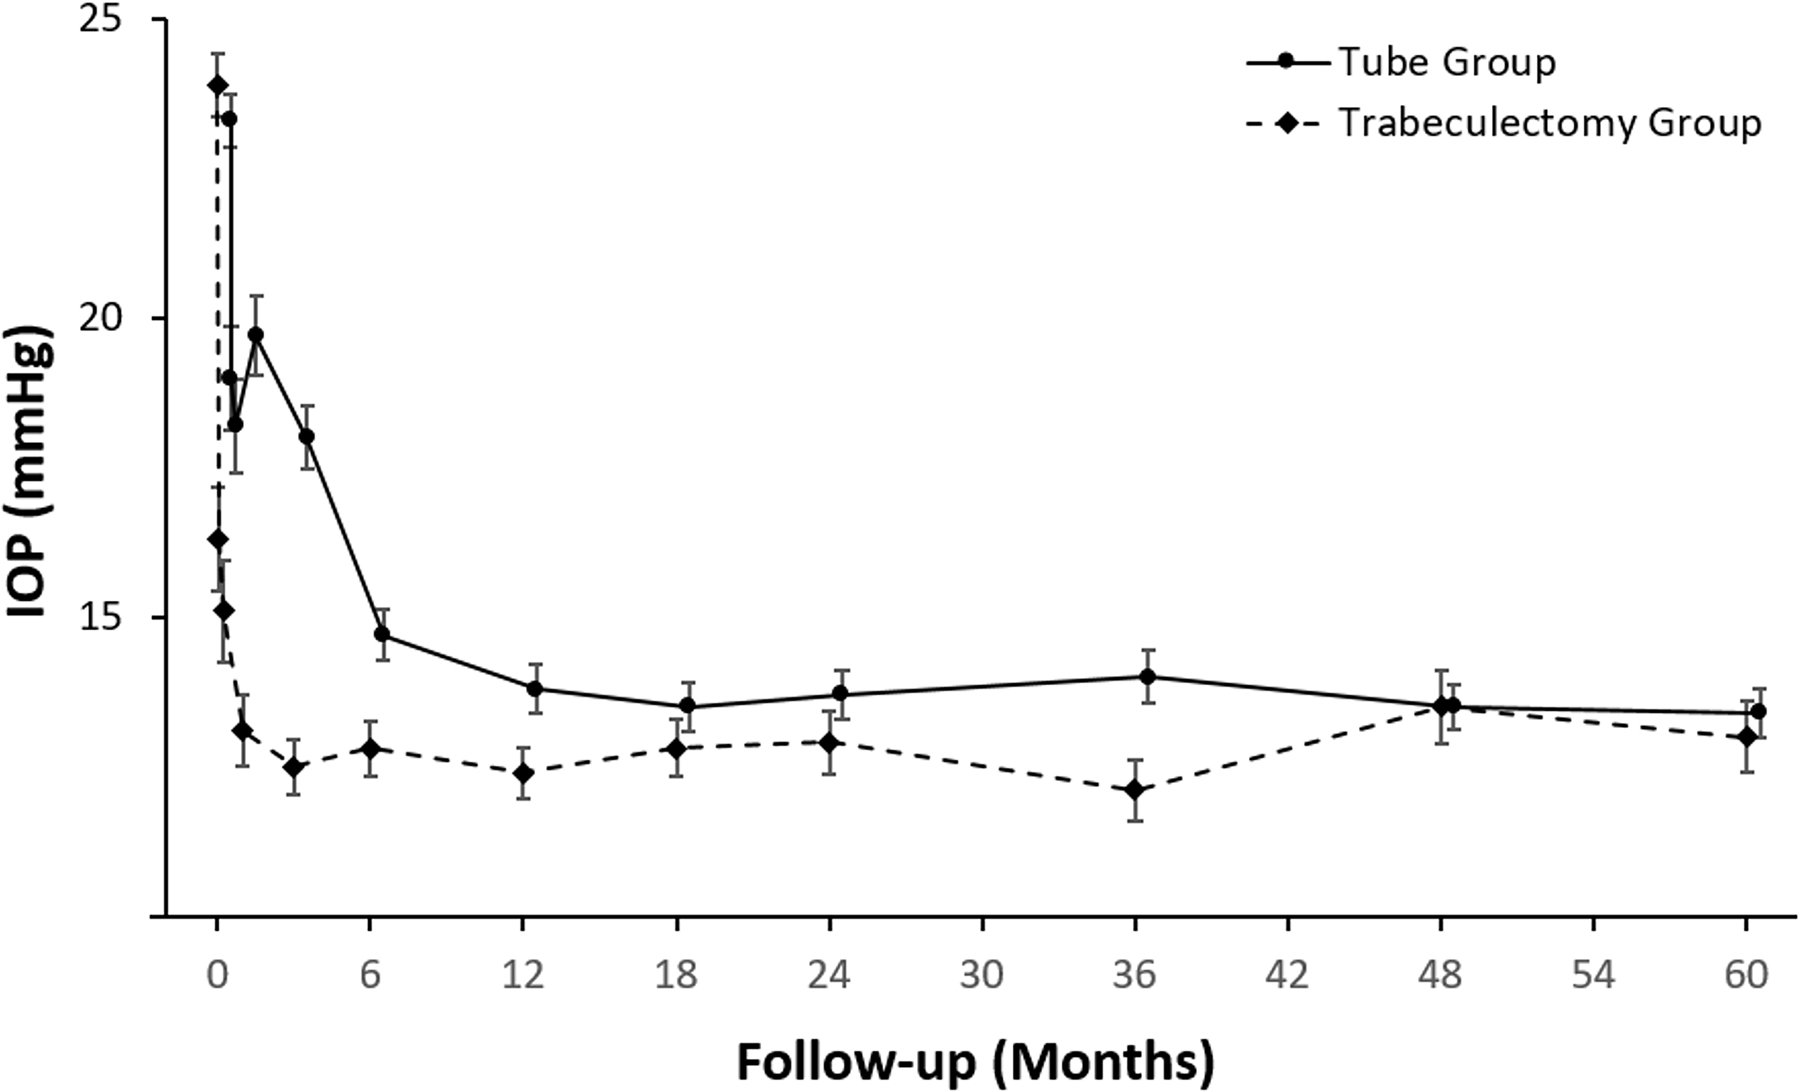
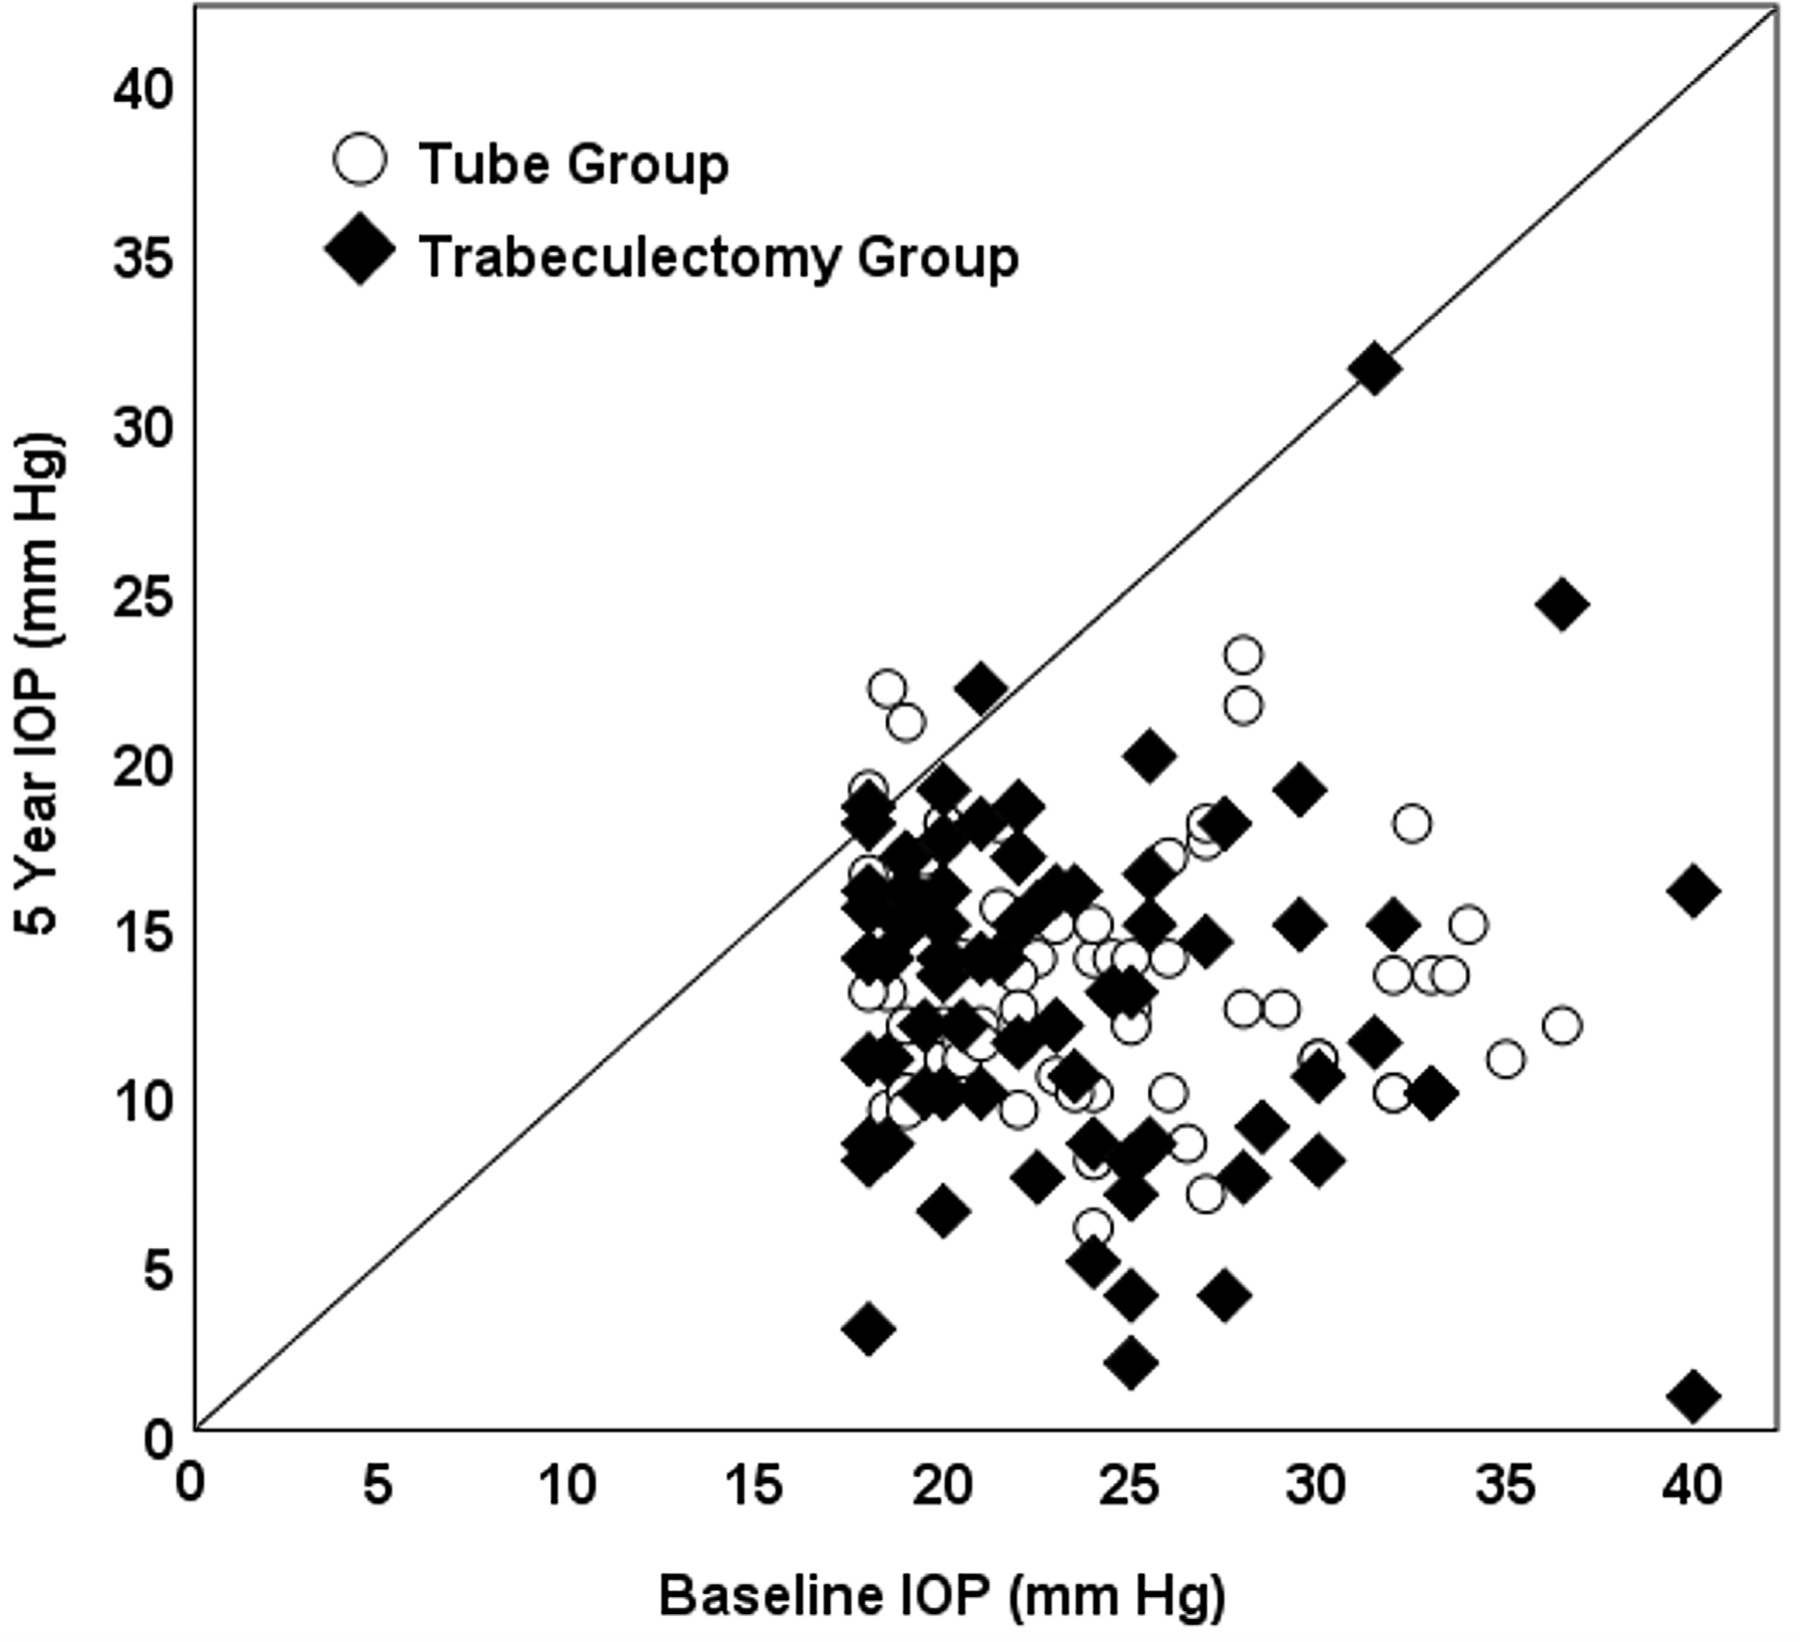
Results: The cumulative probability of failure after 5 years of follow-up was 42% in the tube group and 35% in the trabeculectomy group (P = 0.21; hazard ratio = 1.31; 95% confidence interval = 0.86-2.01). At 5 years, IOP (mean ± standard deviation) was 13.4 ± 3.5 mmHg in the tube group and 13.0 ± 5.2 mmHg in the trabeculectomy group (P = 0.52), and the number of glaucoma medications (mean ± standard deviation) was 2.2 ± 1.3 in the tube group and 1.3 ± 1.4 in the trabeculectomy group (P < 0.001).
Conclusions: Trabeculectomy with MMC and tube shunt surgery produced similar IOPs after 5 years of follow-up in the PTVT Study, but fewer glaucoma medications were required after trabeculectomy. No significant difference in the rate of surgical failure was observed between the 2 surgical procedures at 5 years.
Keywords: Glaucoma surgery; Randomized clinical trial; Trabeculectomy; Tube shunt.
Copyright © 2022 American Academy of Ophthalmology. Published by Elsevier Inc. All rights reserved.
Conflict of interest statement
The other authors report no financial interest in the subject matter of this paper.
Figures
Comment in
-
Re: Gedde et al.: Treatment outcomes in the Primary Tube Versus Trabeculectomy Study after 5 years of follow-up (Ophthalmology. 2022;129:1344-1356).Ophthalmology. 2023 Jul;130(7):e25. doi: 10.1016/j.ophtha.2023.02.029. Epub 2023 Apr 9. Ophthalmology. 2023. PMID: 37041093 No abstract available.
References
-
- The AGIS Investigators. The Advanced Glaucoma Intervention Study (AGIS): 7. The relationship between control of intraocular pressure and visual field deterioration. Am J Ophthalmol 2000;130:429–440. - PubMed
-
- Gedde SJ, Feuer WJ, Shi W, et al. Treatment outcomes in the Primary Tube Versus Trabeculectomy Study after 1 year of follow-up. Ophthalmology 2018;125:650–663. - PubMed
-
- Gedde SJ, Feuer WJ, Lim KS, et al. Treatment outcomes in the Primary Tube Versus Trabeculectomy Study after 3 years of follow-up. Ophthalmology 2020;127:333–345. - PubMed
