. 2022 Oct 15:260:119464.
doi: 10.1016/j.neuroimage.2022.119464. Epub 2022 Jul 12.

Assessing pulsatile waveforms of paravascular cerebrospinal fluid dynamics within the glymphatic pathways using dynamic diffusion-weighted imaging (dDWI)

Affiliations

Assessing pulsatile waveforms of paravascular cerebrospinal fluid dynamics within the glymphatic pathways using dynamic diffusion-weighted imaging (dDWI)

Qiuting Wen et al. Neuroimage. .

Abstract

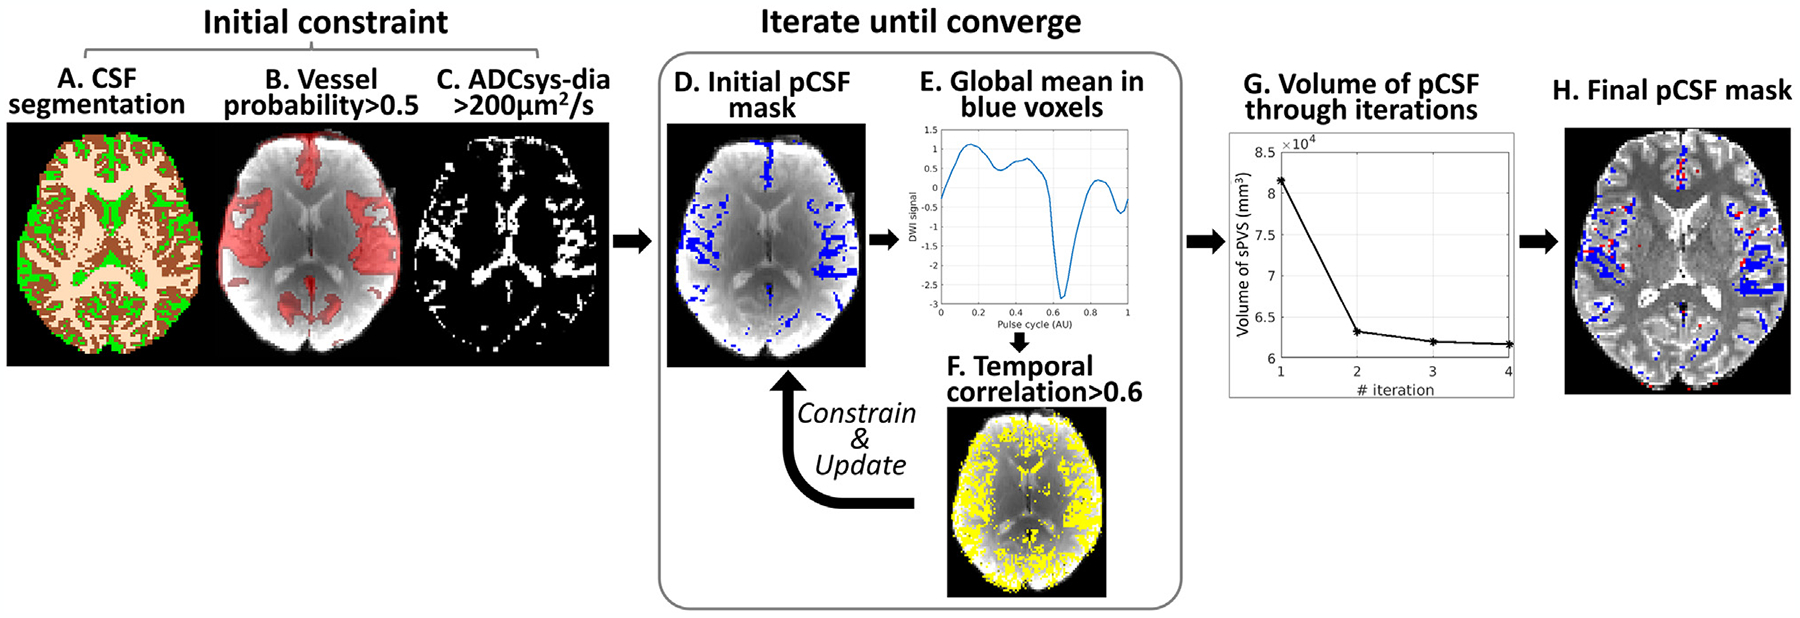
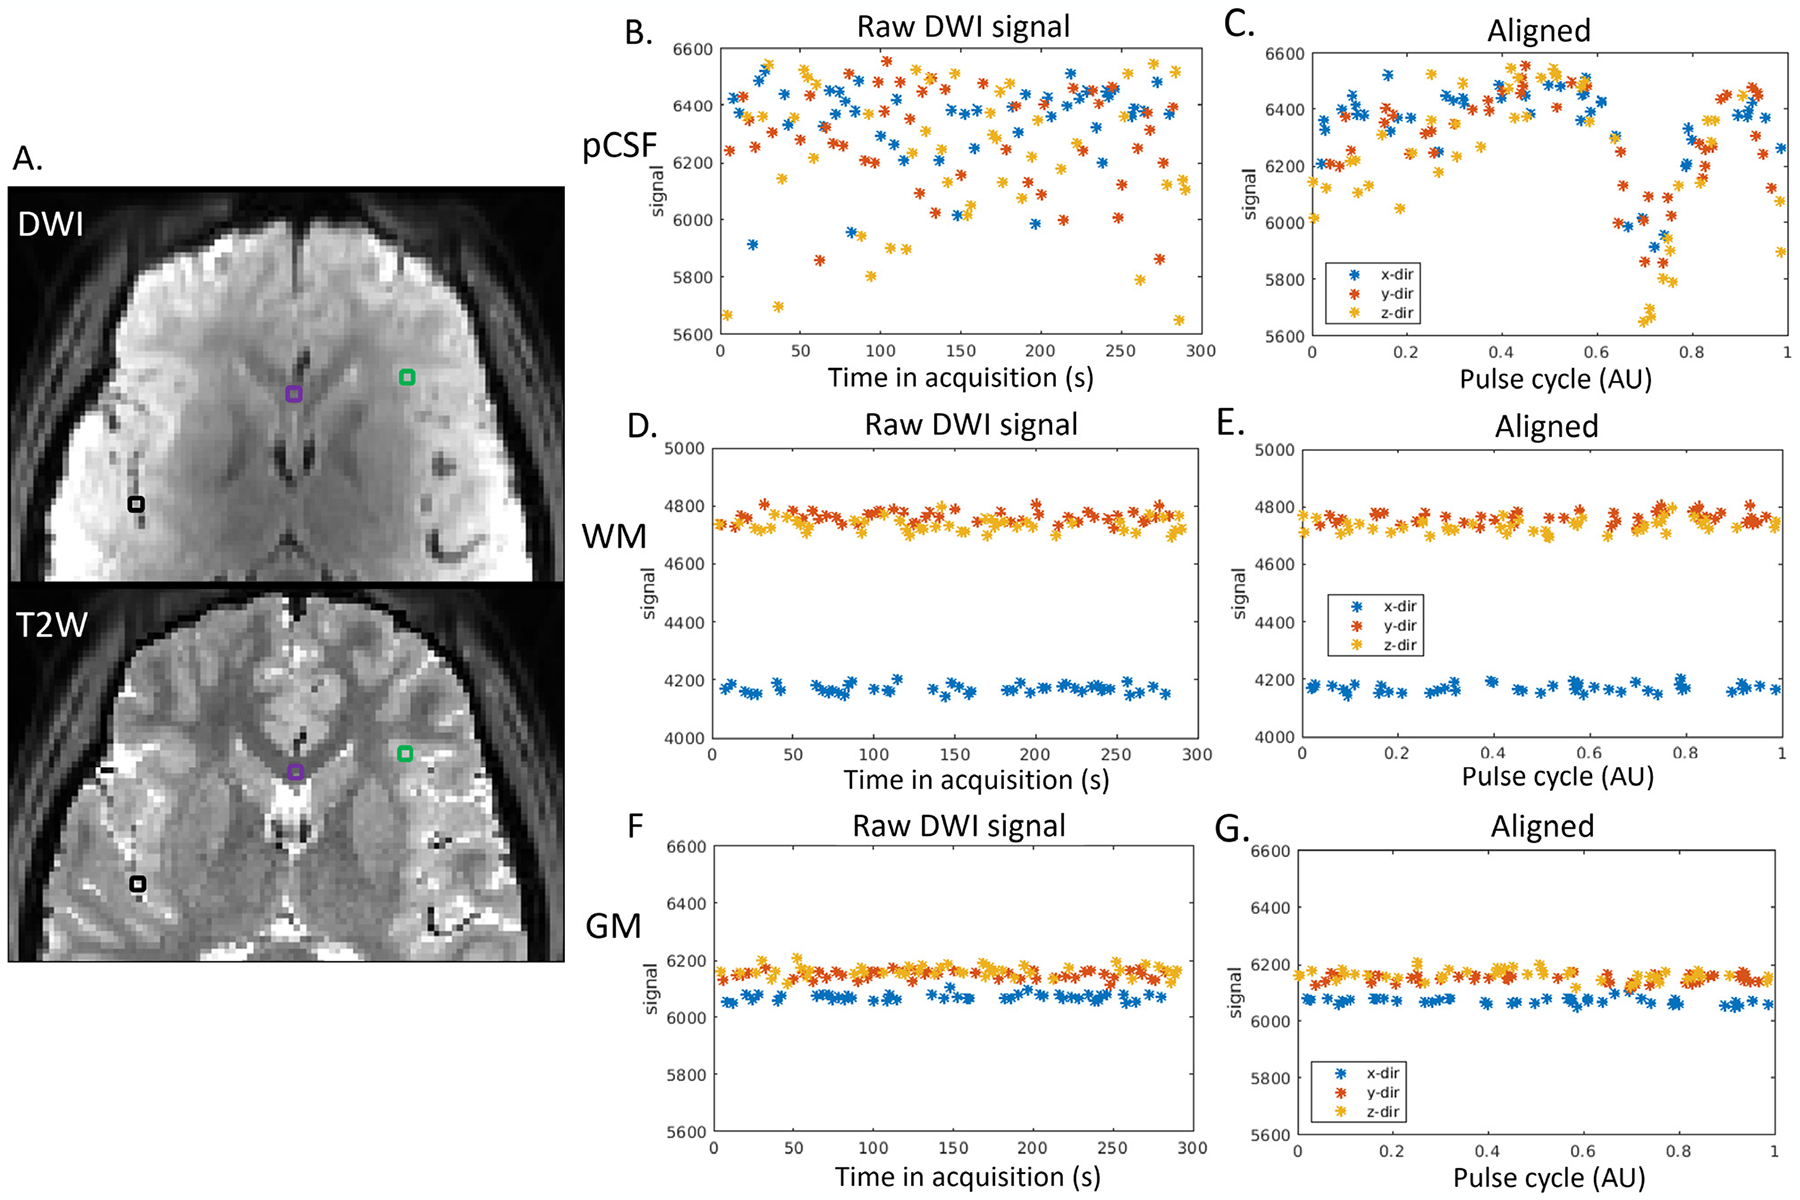
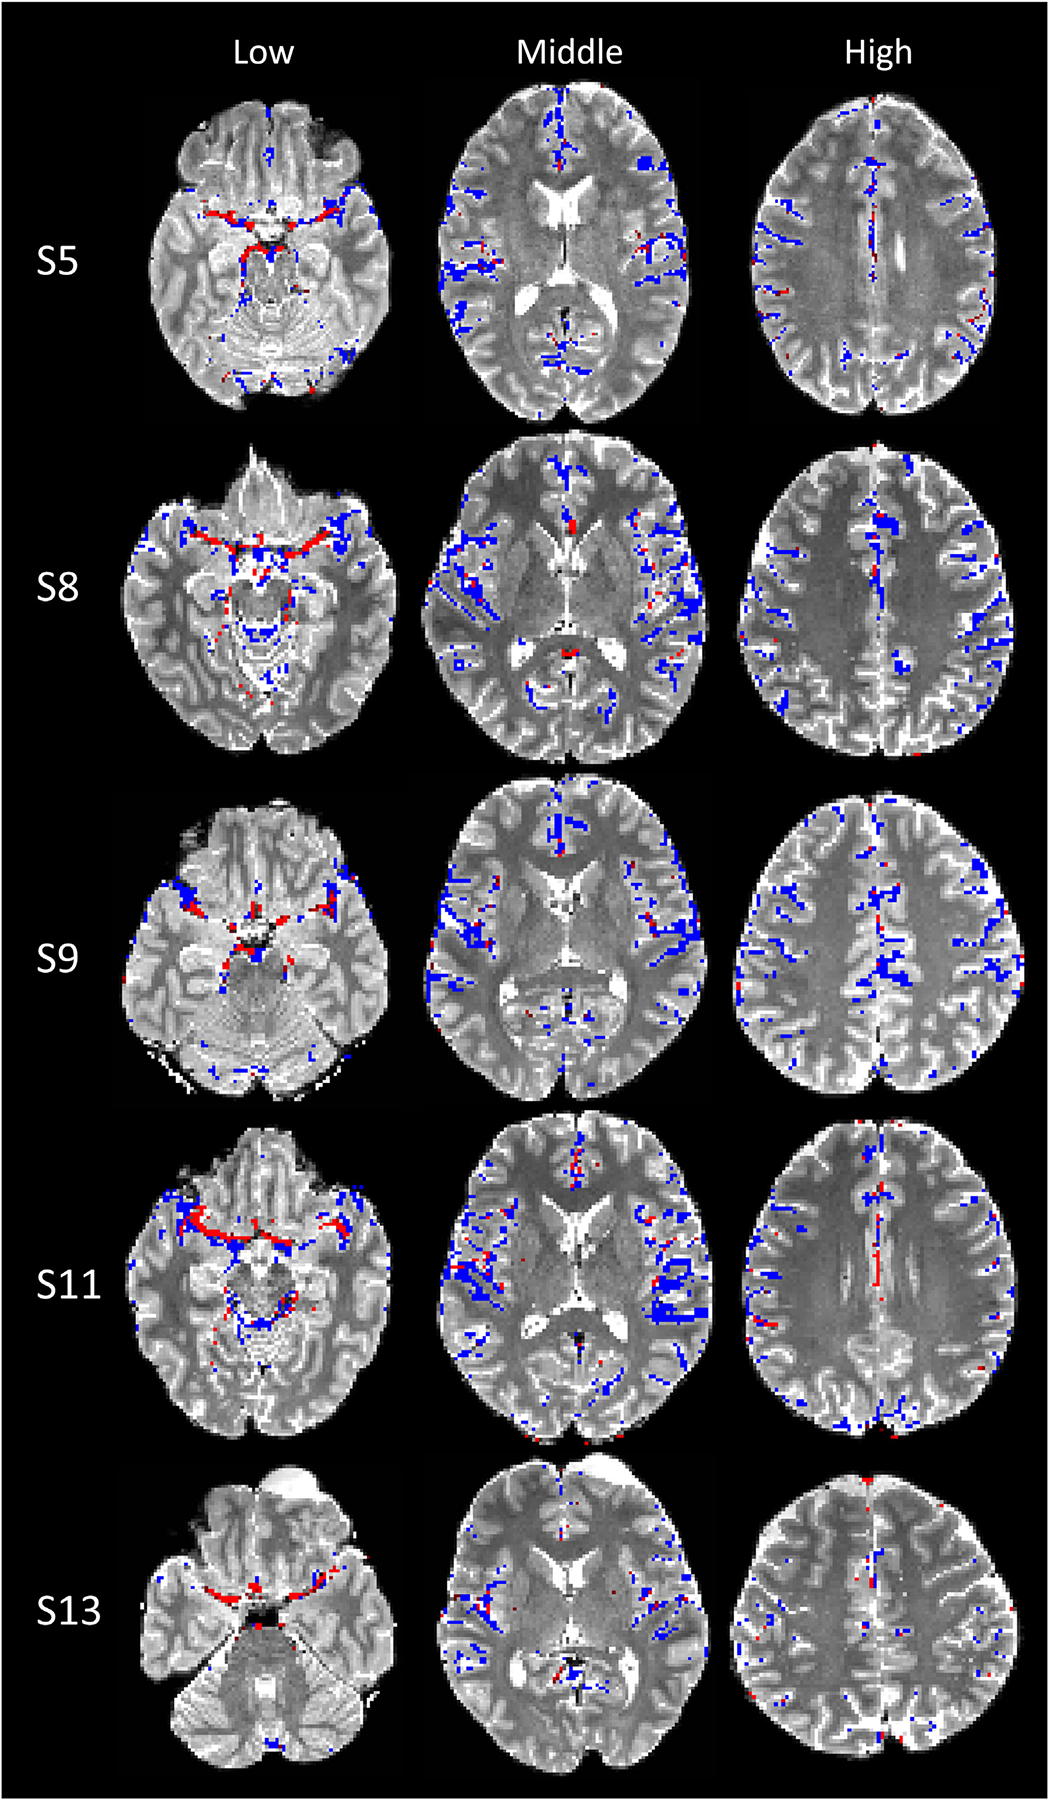
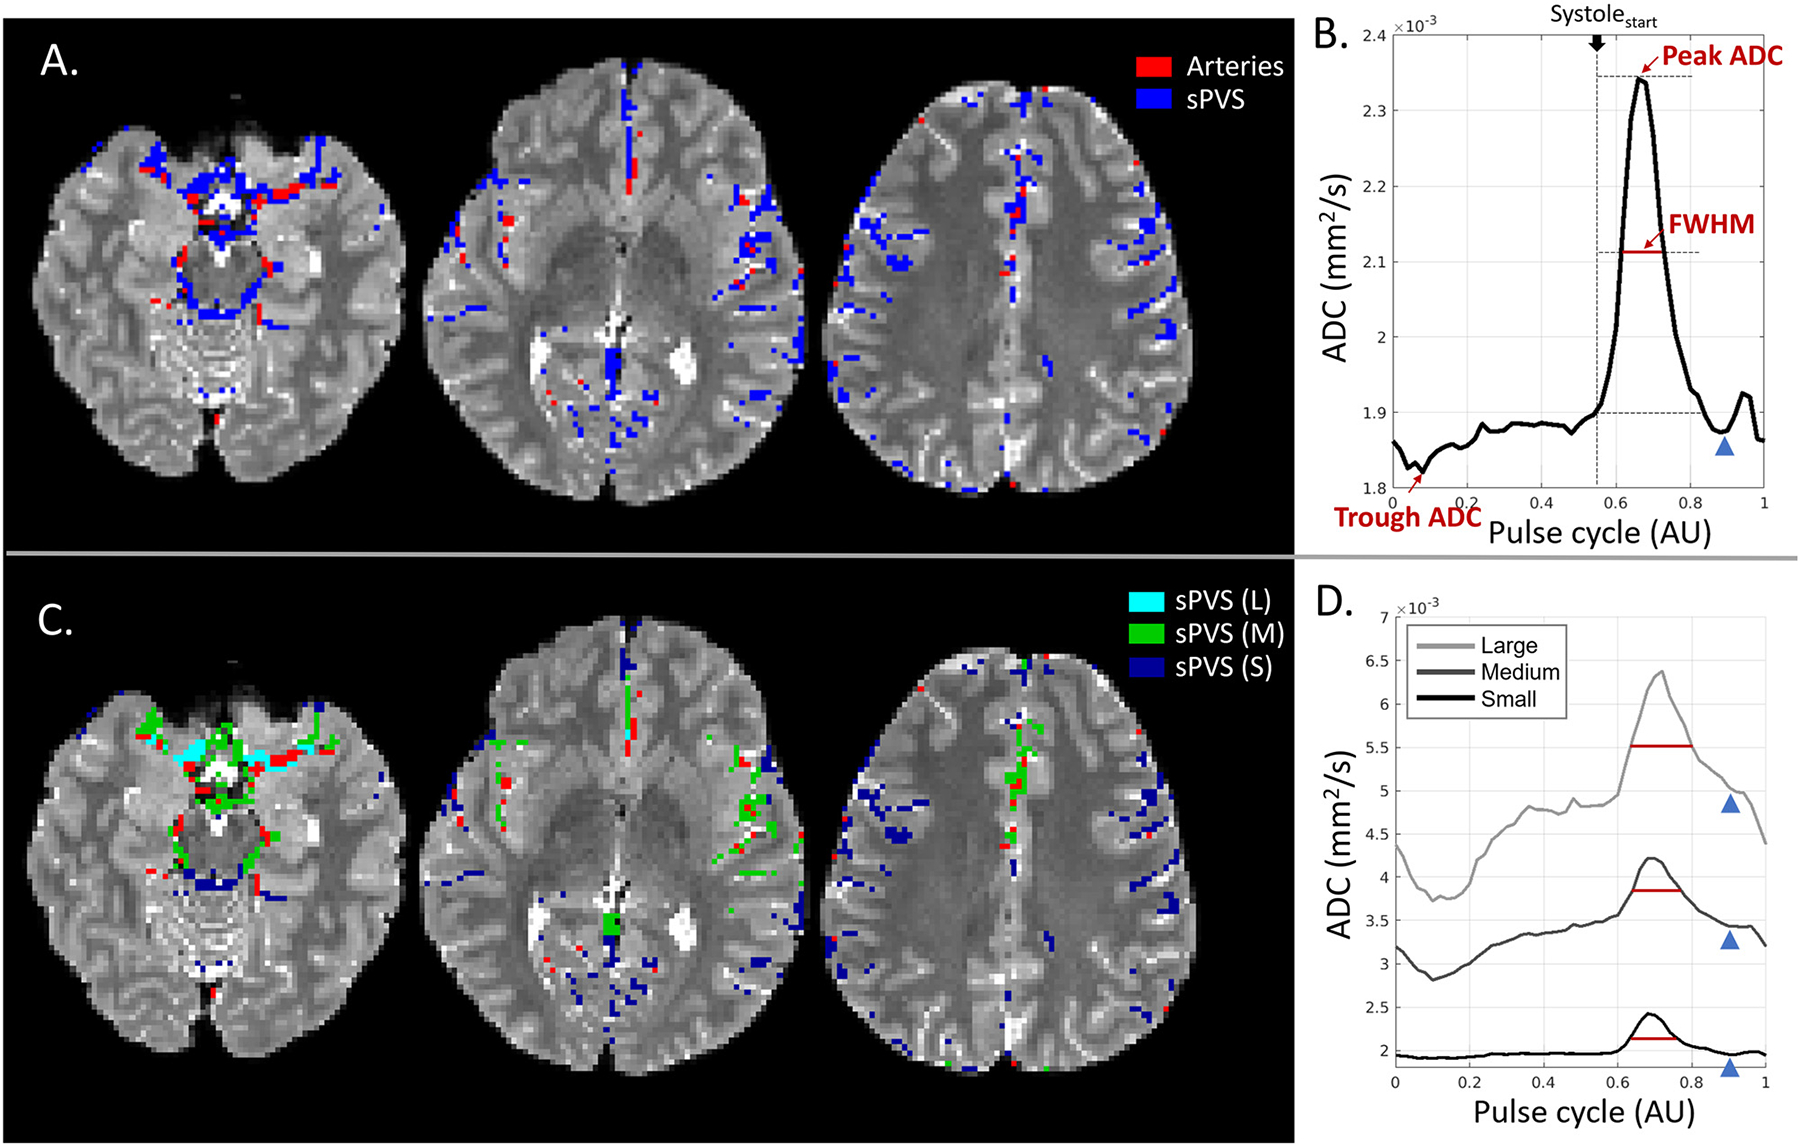
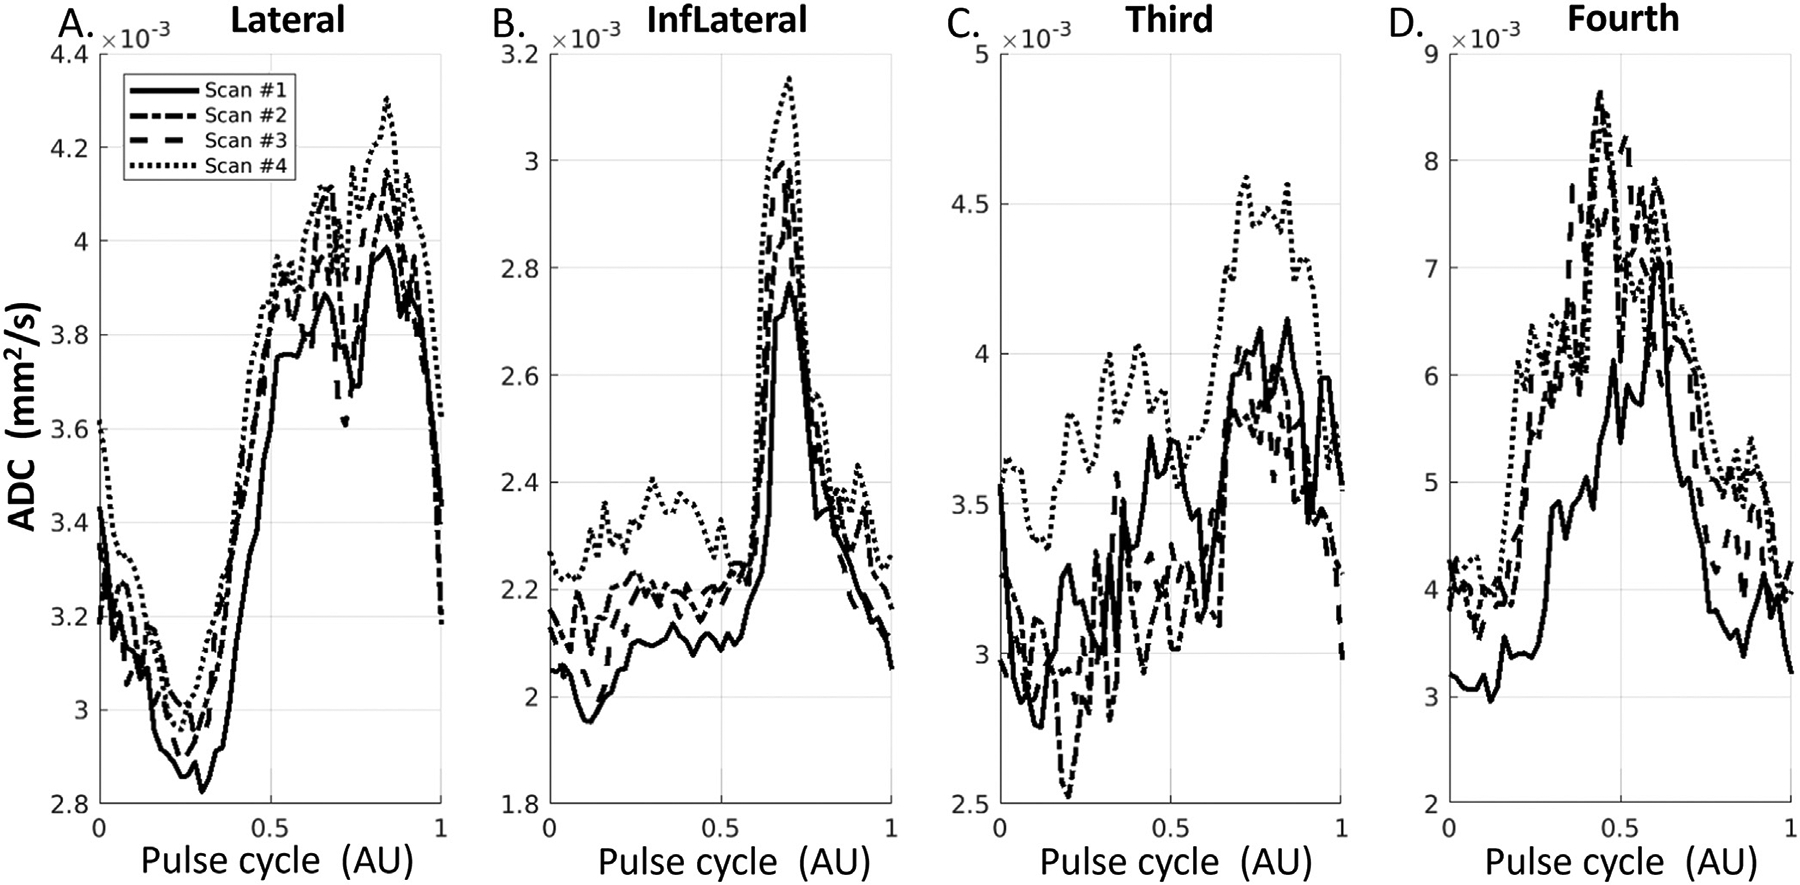
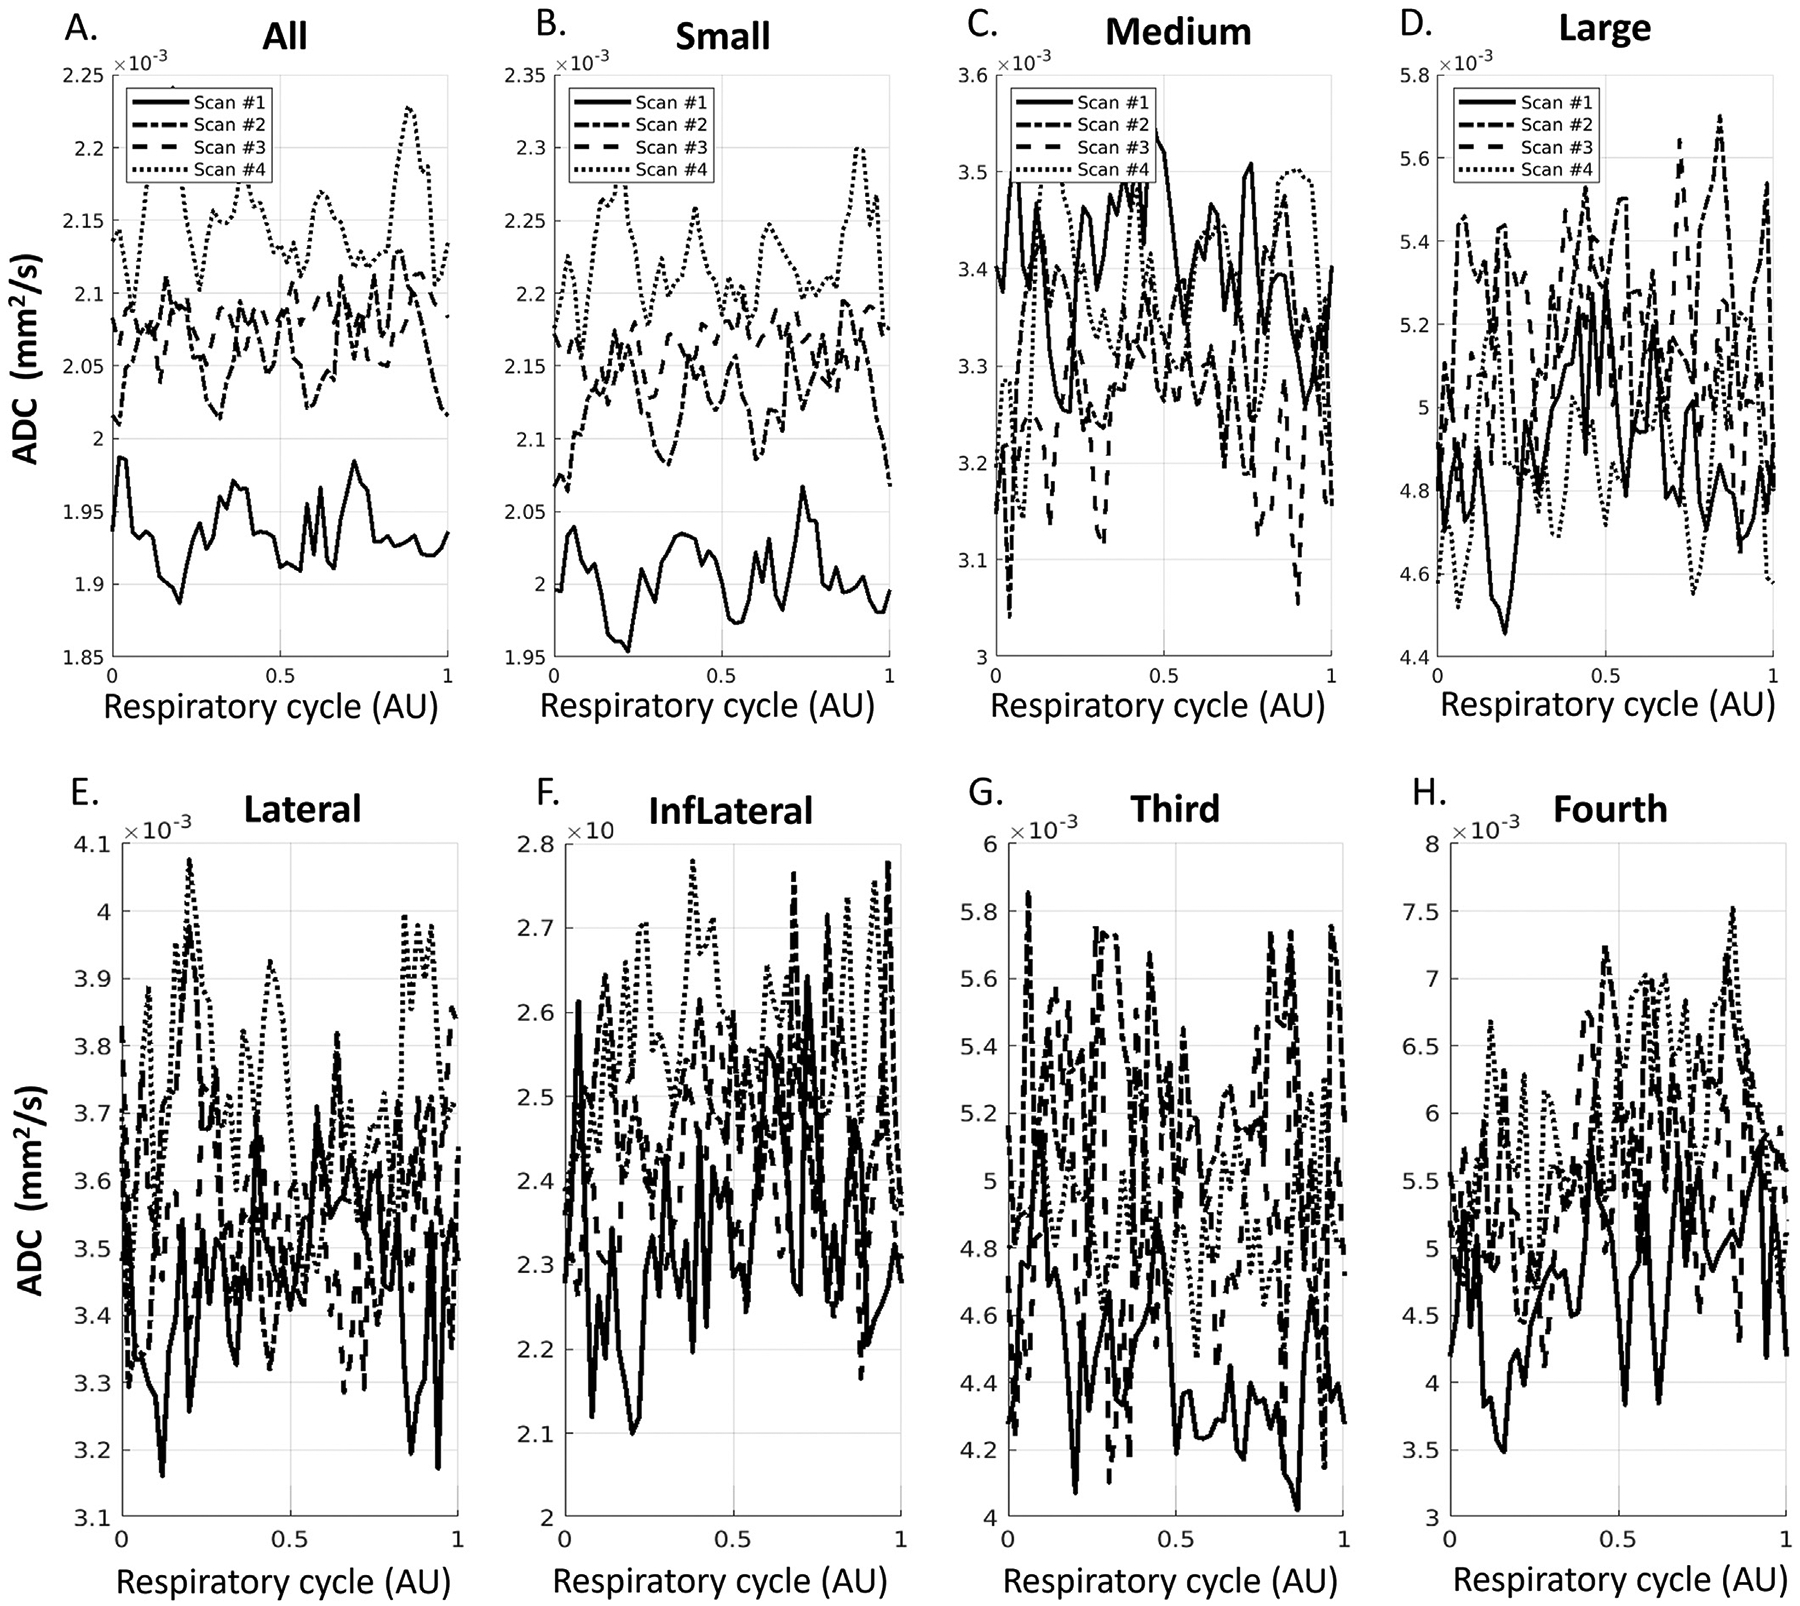
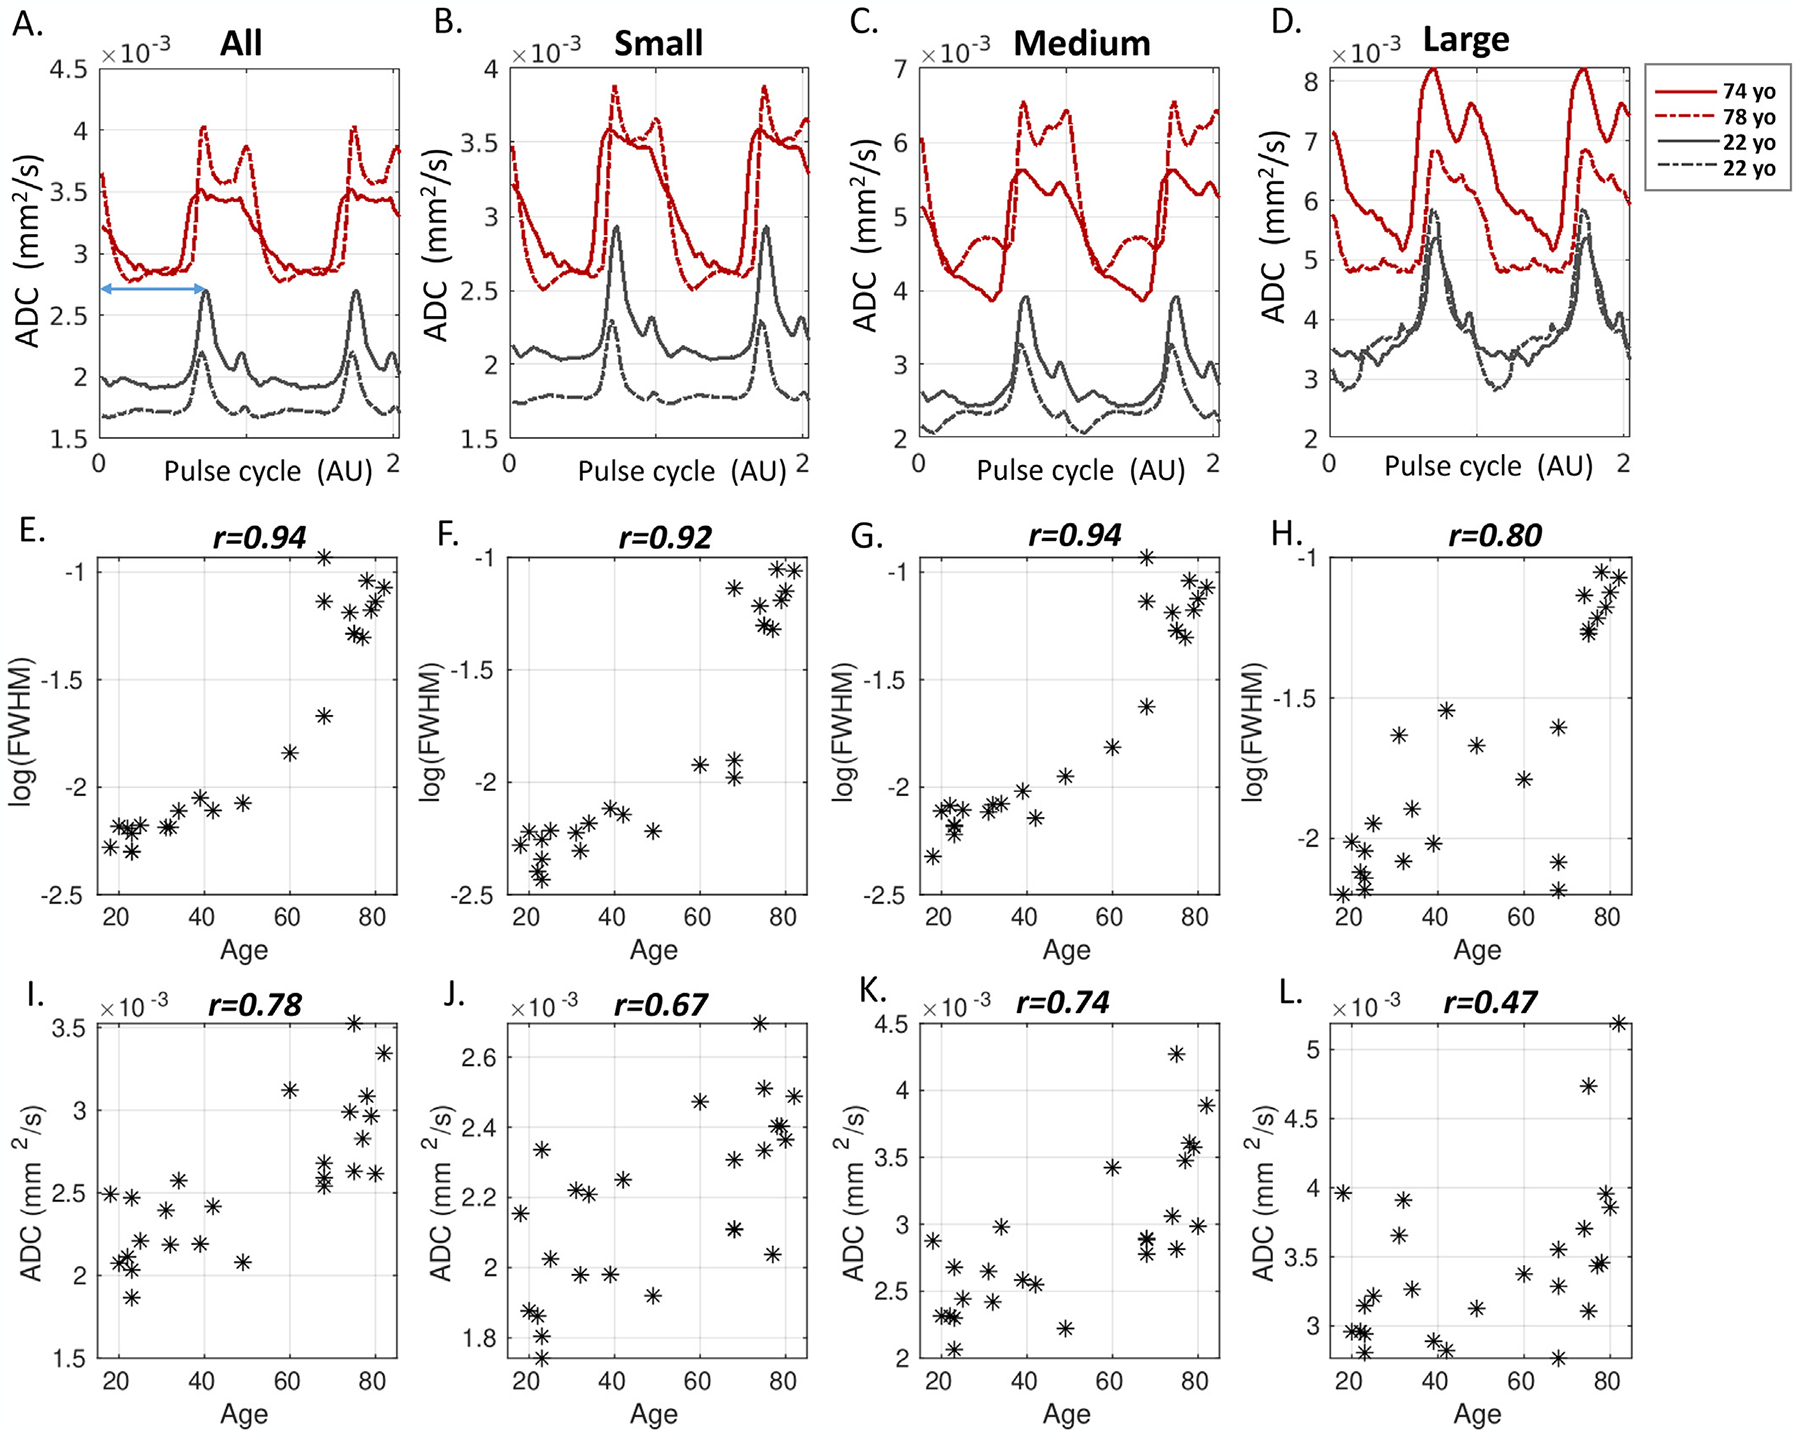
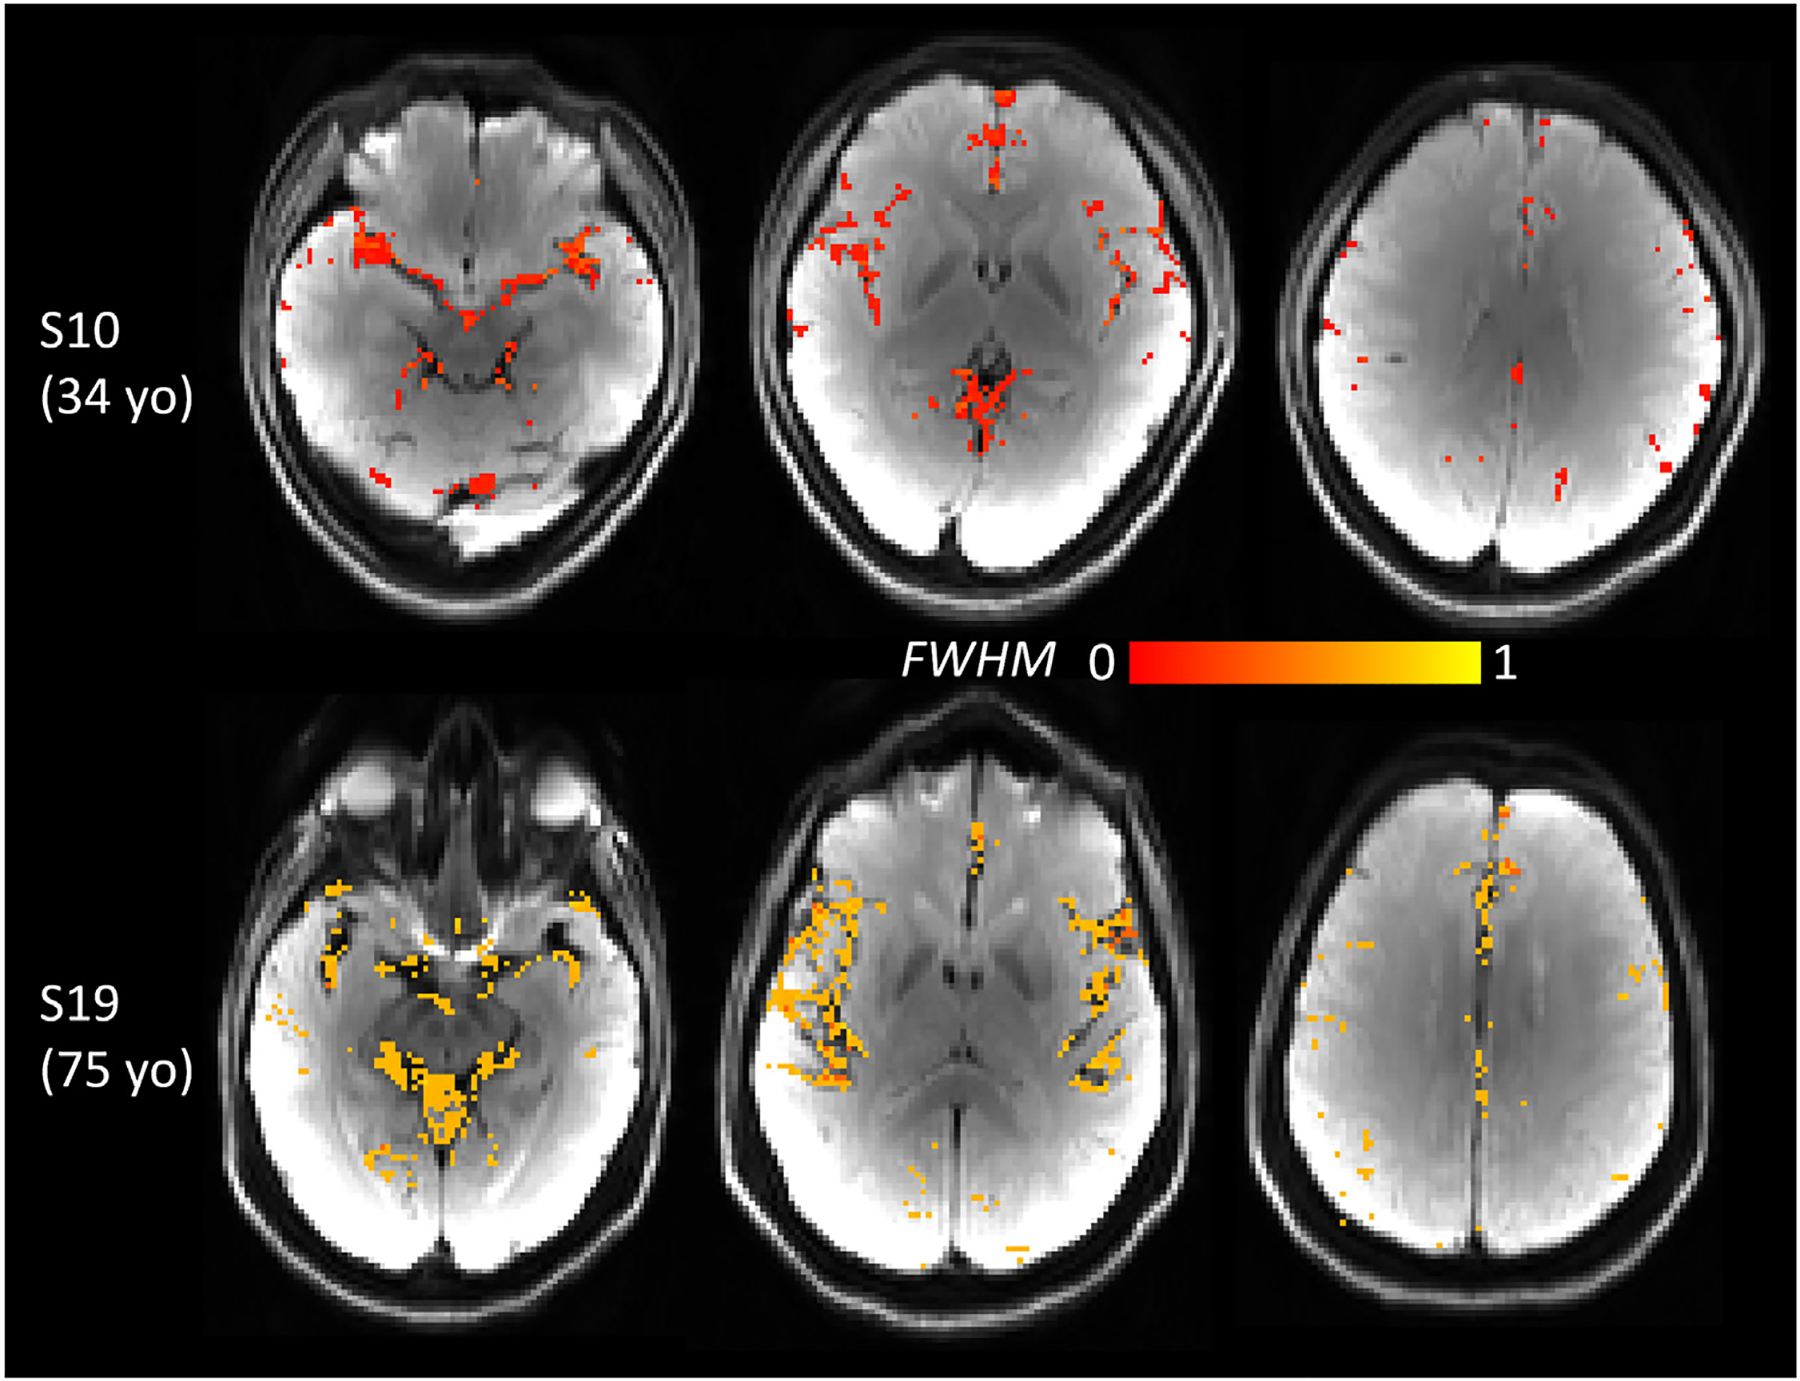
Cerebrospinal fluid (CSF) in the paravascular spaces of the surface arteries (sPVS) is a vital pathway in brain waste clearance. Arterial pulsations may be the driving force of the paravascular flow, but its pulsatile pattern remains poorly characterized, and no clinically practical method for measuring its dynamics in the human brain is available. In this work, we introduce an imaging and quantification framework for in-vivo non-invasive assessment of pulsatile fluid dynamics in the sPVS. It used dynamic Diffusion-Weighted Imaging (dDWI) at a lower b-values of 150s/mm2 and retrospective gating to detect the slow flow of CSF while suppressing the fast flow of adjacent arterial blood. The waveform of CSF flow over a cardiac cycle was revealed by synchronizing the measurements with the heartbeat. A data-driven approach was developed to identify sPVS and allow automatic quantification of the whole-brain fluid waveforms. We applied dDWI to twenty-five participants aged 18-82 y/o. Results demonstrated that the fluid waveforms across the brain showed an explicit cardiac-cycle dependency, in good agreement with the vascular pumping hypothesis. Furthermore, the shape of the CSF waveforms closely resembled the pressure waveforms of the artery wall, suggesting that CSF dynamics is tightly related to artery wall mechanics. Finally, the CSF waveforms in aging participants revealed a strong age effect, with a significantly wider systolic peak observed in the older relative to younger participants. The peak widening may be associated with compromised vascular compliance and vessel wall stiffening in the older brain. Overall, the results demonstrate the feasibility, reproducibility, and sensitivity of dDWI for detecting sPVS fluid dynamics of the human brain. Our preliminary data suggest age-related alterations of the paravascular pumping. With an acquisition time of under six minutes, dDWI can be readily applied to study fluid dynamics in normal physiological conditions and cerebrovascular/neurodegenerative diseases.

Keywords: Age effect; Diffusion MRI; Fluid dynamics; Glymphatic system; Paravascular cerebrospinal fluid; Pulsatile waveforms; dynamic Diffusion-Weighted Imaging.


Figures

Fig. 1.
Fig. 1.
A data-driven approach for automatic identification of sPVS. CSF (A), Vessel probability (B), and ADCsys-dia (C) masks were used to determine the initial sPVS mask (D). An iterative process was followed to constrain the sPVS mask to only include voxels that showed pulsatile pattern (E). A temporal correlation coefficient >0.6 was applied to constrain and update the sPVS mask for the next iteration. The iteration continued until the volume of sPVS converged (G), and a final sPVS mask was generated (H).
Fig. 2.
Fig. 2.
Cardiac-cycle dependency of pCSF dynamics captured by dDWI. (A). Three representative voxels were selected in: the pCSF (black voxel), the white matter (WM, purple voxel), and the gray matter (GM, green voxel). The top panel shows one DWI acquired during diastole. The bottom panel is T2W of the same slice, where pCSF shows a bright signal; (Panels B,D,F). The raw temporal DWI signal. (Panels C,E,G). The DWI signal after aligning to the pulse cycle. (x/y/z-dir: diffusion weighting along x/y/z direction.)
Fig. 3.
Fig. 3.
sPVS mask (blue) and TOF (red) overlaid on T2W images of six participants. The subject number (e.g., S5) corresponds to the ID in Table 1.
Fig. 4.
Fig. 4.
CSF waveform and its dependency on adjacent artery sizes. (A). Surface paravascular space (sPVS) (blue) and artery mask (red) overlaid on T2W from three slices. (B). Averaged ADC waveform in the whole-brain sPVS. The full width at half max (FWHM) was used to quantify the systolic peak width. (C). sPVS was divided into Small (dark blue), Medium (green), and Large (light blue) based on adjacent artery diameters using the radius map of the artery atlas. (D). Averaged ADC waveforms calculated in the Small, Medium, and Large sPVS. The blue arrowheads indicate the “dicrotic notch” toward the end of the systolic phase. L: Large; M: Medium; S: Small.
Fig. 5.
Fig. 5.
Reproducibility of sPVS waveforms in All (A), Small (B), Medium (C), and Large (D) computed from four scans of the same participant. E. Boxplots of FWHM from four scans.
Fig. 6.
Fig. 6.
pCSF waveforms at fives b-values (50, 100, 150, 200, 300 s/mm2). A-D: Waveforms from All, Small, Medium, and Large sPVS regions. E-G: Comparison of waveforms metrics for Small, Medium and Large sPVS spaces. FWHM: Full-width at half maximum of the diastolic peak. ADC: baseline/trough ADC values. ΔADC: Peak-Trough ADC differences.
Fig. 7.
Fig. 7.
Experimental results supported that pCSF waveforms were free from arterial blood contribution. (Panels A-C): No differences in FWHM were observed between 4mm and 2mm slice thickness (seven participants, paired t-test, p=0.90). As expected, trough ADC was higher at 2mm due to less partial voluming with adjacent parenchyma. (Panels D-F): No differences were observed between an acquisition without a saturation band (no-satband), and those with one or two saturation bands (1-satband and 2-satband).
Fig. 8.
Fig. 8.
ADC waveforms in the brainstem of four participants. (A). T1W with brainstem highlighted in red. (B). Mean ADC waveforms in the brainstem demonstrate a pulsatile pattern, with temporal standard deviation of 19, 10, 3, 6 ×10⁻⁶mm2/s for the four individuals. (C). The dynamic range of ADC in the sCSF (solid line) is 10–30 folds larger than in the brainstem, with a temporal standard deviation of 240, 191, 192, and 219 ×10−6mm2/s, respectively.
Fig. 9.
Fig. 9.
Waveforms in the ventricle regions, including Lateral ventricles (A), Inferior Lateral ventricles (B), the third ventricle (C), and the fourth ventricle (D).
Fig. 10.
Fig. 10.
ADC waveforms after aligning to respiratory cycle in sPVS (A-D) and in ventricles (E-H) from four repeated scans on one volunteer. (A). All sPVS regions. (B-D). sPVS of Small, Medium, and Large pial arteries. (E-I): Lateral ventricles, Inferior Lateral ventricles, the third ventricle, and the fourth ventricle.
Fig. 11.
Fig. 11.
Age-dependency of pCSF waveforms. A-D: Representative pCSF waveforms of two younger and two older participants. E-H: Scatter plots of FWHM (log-transformed) as a function of age in all 25 participants. A high correlation between FWHM and age is found, with the Pearson correlation r-value displayed on top. I-L: Scatter plot of trough ADC against age. Older age showed a higher trough ADC.
Fig. 12.
Fig. 12.
Voxel-wise FWHM maps of one younger (34 yo) and one older (75 yo) participant revealed brain-wide larger FWHM in the older brain. FWHM map was overlaid on DWI.

References

    1. Aaslid R, Markwalder TM, Nornes H, 1982. Non-invasive transcranial Doppler ultrasound recording of flow velocity in basal cerebral arteries. J. Neurosurg 57 (6), 769–774. - PubMed
    1. Abderezaei J, Pionteck A, Terem I, Dang L, Scadeng M, Morgenstern P, et al. , 2021. Development, calibration, and testing of 3D amplified MRI (aMRI) for the quantification of intrinsic brain motion. Brain Multiphys., 100022.
    1. Bacyinski A, Xu M, Wang W, Hu J, 2017. The paravascular pathway for brain waste clearance: current understanding, significance and controversy. Front. Neuroanat 11, 101. - PMC - PubMed
    1. Basser PJ, Mattiello J, LeBihan D, 1994. MR diffusion tensor spectroscopy and imaging. Biophys. J 66 (1), 259–267. - PMC - PubMed
    1. Battal B, Kocaoglu M, Bulakbasi N, Husmen G, Tuba Sanal H, Tayfun C, 2011. Cerebrospinal fluid flow imaging by using phase-contrast MR technique. Br. J. Radiol 84 (1004), 758–765. - PMC - PubMed

Publication types