. 2022 Jul;32(7):1285-1297.
doi: 10.1101/gr.276554.122. Epub 2022 Jul 14.

Cell cycle arrest explains the observed bulk 3D genomic alterations in response to long-term heat shock in K562 cells

Affiliations

Cell cycle arrest explains the observed bulk 3D genomic alterations in response to long-term heat shock in K562 cells

Bingxiang Xu et al. Genome Res. 2022 Jul.

Abstract

Heat shock is a common environmental stress, although the response of the nucleus to it remains controversial in mammalian cells. Acute reaction and chronic adaptation to environmental stress may have distinct internal rewiring in the gene regulation networks. However, this difference remains largely unexplored. Here, we report that chromatin conformation and chromatin accessibility respond differently in short- and long-term heat shock in human K562 cells. We found that chromatin conformation in K562 cells was largely stable in response to short-term heat shock, whereas it showed clear and characteristic changes after long-term heat treatment with little alteration in chromatin accessibility during the whole process. We further show in silico and experimental evidence strongly suggesting that changes in chromatin conformation may largely stem from an accumulation of cells in the M stage of the cell cycle in response to heat shock. Our results represent a paradigm shift away from the controversial view of chromatin response to heat shock and emphasize the necessity of cell cycle analysis when interpreting bulk Hi-C data.


Figures

Figure 1.
Figure 1.
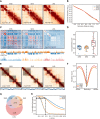
Chromatin conformation remained stable after short-term HS (SHS), whereas it is mostly altered after long-term HS (LHS). (A) Chr 6 is shown with 500-kb resolution as an example of the contact maps in K562 cells during the process of HS. (B) Contact frequency decay curves at normal HS (NHS), SHS, and LHS conditions. (C) Chromatin compartmentalization at the three conditions. Chr 6 is shown as an example. The autocorrelation matrices together with the first eigenvector profiles are shown. In the first eigenvector, compartment B is colored as blue and A as orange. (D) Genome-wide compartment scores at each condition. (E) TADs detected in a 4-Mb region centered at the TSS of HSPA1A gene are shown as an example, together with the corresponding contact maps. The insulation score profiles of the same region are also shown below. The detected TADs are shaded. (F) Genome-wide insulation score profiles around TAD boundaries at the three conditions. (G) Numbers and proportions of overlap of chromatin loops at the three conditions. (H) Distributions of z-scores of LHS-specific loops in NHS and SHS conditions. Dashed lines indicate the distributions of z-scores of the randomly chosen bin pairs with the same genome distances. Black dashed line shows the proportion of LHS-specific loops that had z-scores of contacts greater than two compared with their flanking regions.
Figure 2.
Figure 2.
Local chromatin environments remains stable during the whole process of HS. (A) ATAC-seq signal profiles (observed/expected calculated by MACS2) of the biological replicates at the NHS, SHS, and LHS conditions. The 200-kb region centered at the TSS of HSPA1B gene is shown. Only a part of gene symbols is listed owing to the limited space. (B) Distribution of ATAC-seq peaks over genome elements in the three conditions. (C) Numbers and overlaps of accessible genes (TSSs covered by NFRs) in the three conditions. (D) Distributions of NFRs around TSSs of accessible genes. (E) Volcano plot showing the results of the differential accessibility analysis in NFRs before and after HS. Accessibility was measured by the coverage depth of short ATAC-seq fragments. (F) Comparisons of accessibility levels of promoters and dTREs before (NHS) and after LHS. The lines mark the regression fits.
Figure 3.
Figure 3.
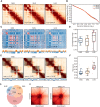
Chromatin conformation in G1/S cells remains largely intact after LHS. (A) An example showing the contact maps of G1/S-phase cells in the process of HS; Chr 6 is shown with 500-kb resolution as in Figure 1A. (B) The contact frequency decay curves at the three conditions in G1/S-phase cells. (C) Chromatin compartmentalization at the three conditions in G1/S-phase cells. Chr 6 is shown as an example as in Figure 1C. The autocorrelation matrices, together with the first eigenvector profiles, are shown. (D) The chromosome-wise compartment scores at each condition in the G1/S-phase cells. (E) TADs detected in the same region as that shown in Figure 1E with G1/S cells, together with the corresponding contact maps and the insulation score profiles, are also shown. (F) Genome-wide insulation score profiles of G1/S cells around TAD boundaries at the three conditions. (G) Numbers and proportions of overlap of chromatin loops at the three conditions for G1/S cells.
Figure 4.
Figure 4.
Chromatin conformation of G2/M cells changes slightly during LHS. (A) Contact maps in G2/M-phase cells before and after HS. Chr 6 is shown at 500-kb resolution as in Figure 1A. (B) Contact frequency decay curves in G2/M-phase cells. (C) Chromatin compartmentalization in G2/M-phase cells. Chr 6 is shown as an example as in Figure 1C. Autocorrelation matrices, together with the first eigenvector profiles, are shown. (D) Chromosome-wise compartment scores in G2/M-phase cells in each condition. (E) TADs detected in same region as that shown in Figure 1E are shown as an example for G2/M cells, together with the corresponding contact maps and insulation score profiles. Detected TADs are shaded. (F) TAD strengths indicated by TAD scores in G2/M-phase cells at the three conditions. (G) Numbers and proportions of overlap of chromatin loops in G2/M-phase cells. (H) APA scores for the LHS-specific loops are shown in NHS and SHS conditions.
Figure 5.
Figure 5.
Cell cycle redistribution after LHS contributes to observed Hi-C contact map changes. (A) Representative images showing cell cycle phase in sorted G2/M cells for the three conditions. (B) Estimated cell fractions of G1/S- and G2/M-phase cells in mixed cells before and after HS calculated from different chromosomes. (C) Schematic diagram shows the main discoveries of our study.

Similar articles

Cited by

References

    1. Aprile-Garcia F, Tomar P, Hummel B, Khavaran A, Sawarkar R. 2019. Nascent-protein ubiquitination is required for heat shock-induced gene downregulation in human cells. Nat Struct Mol Biol 26: 137–146. 10.1038/s41594-018-0182-x - DOI - PubMed
    1. Biamonti G, Caceres JF. 2009. Cellular stress and RNA splicing. Trends Biochem Sci 34: 146–153. 10.1016/j.tibs.2008.11.004 - DOI - PubMed
    1. Buenrostro JD, Giresi PG, Zaba LC, Chang HY, Greenleaf WJ. 2013. Transposition of native chromatin for fast and sensitive epigenomic profiling of open chromatin, DNA-binding proteins and nucleosome position. Nat Methods 10: 1213–1218. 10.1038/nmeth.2688 - DOI - PMC - PubMed
    1. Chowdhary S, Kainth AS, Gross DS. 2017. Heat shock protein genes undergo dynamic alteration in their three-dimensional structure and genome organization in response to thermal stress. Mol Cell Biol 37: e00292-17. 10.1128/MCB.00292-17 - DOI - PMC - PubMed
    1. Chowdhary S, Kainth AS, Pincus D, Gross DS. 2019. Heat shock factor 1 drives intergenic association of its target gene loci upon heat shock. Cell Rep 26: 18–28.e5. 10.1016/j.celrep.2018.12.034 - DOI - PMC - PubMed

Publication types

LinkOut - more resources