. 2022 Nov;167(3):413-427.
doi: 10.1111/imm.13546. Epub 2022 Jul 28.

Pneumolysin suppresses the initial macrophage pro-inflammatory response to Streptococcus pneumoniae

Affiliations

Pneumolysin suppresses the initial macrophage pro-inflammatory response to Streptococcus pneumoniae

Jimstan Periselneris et al. Immunology. 2022 Nov.

Abstract

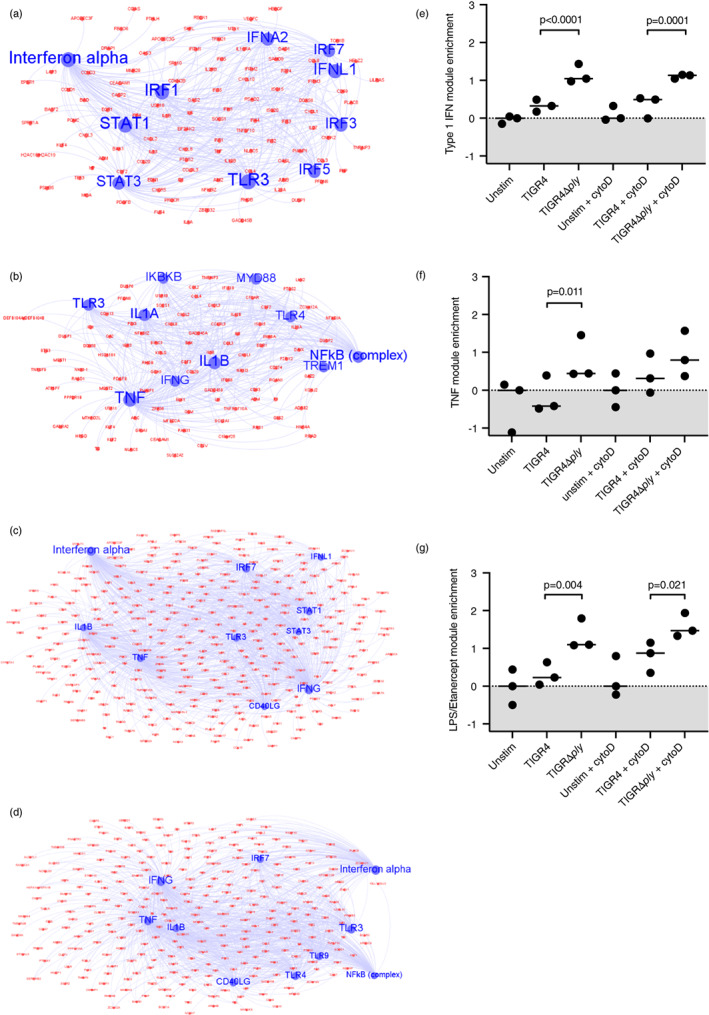
Published data for the Streptococcus pneumoniae virulence factor Pneumolysin (Ply) show contradictory effects on the host inflammatory response to infection. Ply has been shown to activate the inflammasome, but also can bind to MRC-1 resulting in suppression of dendritic cell inflammatory responses. We have used an in vitro infection model of human monocyte-derived macrophages (MDM), and a mouse model of pneumonia to clarify whether pro- or anti-inflammatory effects dominate the effects of Ply on the initial macrophage inflammatory response to S. pneumoniae, and the consequences during early lung infection. We found that infection with S. pneumoniae expressing Ply suppressed tumour necrosis factor (TNF) and interleukin-6 production by MDMs compared to cells infected with ply-deficient S. pneumoniae. This effect was independent of bacterial effects on cell death. Transcriptional analysis demonstrated S. pneumoniae expressing Ply caused a qualitatively similar but quantitatively lower MDM transcriptional response to S. pneumoniae compared to ply-deficient S. pneumoniae, with reduced expression of TNF and type I IFN inducible genes. Reduction of the MDM inflammatory response was prevented by inhibition of SOCS1. In the early lung infection mouse model, the TNF response to ply-deficient S. pneumoniae was enhanced and bacterial clearance increased compared to infection with wild-type S. pneumoniae. Overall, these data show Ply inhibits the initial macrophage inflammatory response to S. pneumoniae, probably mediated through SOCS1, and this was associated with improved immune evasion during early lung infection.

Keywords: Streptococcus pneumoniae; epithelial immunity; inflammation; pneumolysin.


Conflict of interest statement

The authors declare no conflict of interest.

Figures

FIGURE 1
FIGURE 1
TIGR4Δply induces higher levels of pro‐inflammatory cytokine responses by MDMs than TIGR4. S. pneumoniae (TIGR4 in black and TIGR4Δply in grey) were incubated with MDMs and the supernatant analysed using ELISAs for TNF (a and d), IL‐1β (b and e), and IL‐6 (c and f) levels (pg/ml) for different timepoints at an MOI 10 (a–c) or various MOI after 6‐h incubation (d–f). Data are presented as means ± SEM of at least three experiments, and analysed by two‐way ANOVA with Tukey's multiple comparisons test.
FIGURE 2
FIGURE 2
Ply suppresses MDM inflammatory responses for multiple Streptococcus pneumoniae strains. S. pneumoniae strains were incubated with MDMs at an MOI 10 and the supernatant analysed after 6 h using ELISAs for TNF (a, d, and g), IL‐1β (b, e, and h), and IL‐6 (c, f, and i) levels (pg/ml). (a–c) Results for MDMs incubated with wild‐type (black) and isogenic Δply mutants (grey) of serotype 2, 3 and 23F strains. (d–f) Results for MDMs incubated with serotype 1 clinical isolates that express wild‐type ply (black), non‐haemolytic ply (grey), or no ply (white). (g–i) Results for MDMs incubated with D39 (serotype 2) and D39 isogenic mutant strains expressing non‐haemolytic or no ply, and a complemented strain. Data for all panels are presented as means ± SEM of three experiments and analysed by two‐way ANOVA with Sidak's multiple comparisons test.
FIGURE 3
FIGURE 3
Effects of ply on Streptococcus pneumoniae growth, phagocytosis, cell death, and phagosome integrity in the MDM infection model. (a and b) S. pneumoniae growth in the presence of and uptake by macrophages is unaffected by ply. MDM were incubated with TIGR4 (black) or TIGR4Δply (grey) at MOI 10 and supernatant cultured after 6 h plated to determine (a) bacterial CFU in the supernanant, and (b) determine adherent and internalized bacteria as a percentage of the inoculum using an antibiotic protection assay. (c) MDM were incubated with TIGR4 or TIGR4Δply at MOI 10 for 6 h, then stained with propidium iodide as a marker of loss of nuclear integrity. The proportion of MDM that stained positive were measured using Hermes high‐content imaging system (magnification ×10) and automated image analysis. Data are shown as means ± SEM of three experiments and analysed by one‐way ANOVA with Tukey's multiple comparisons test. (d and e) Effects of inhibition of necroptosis; 100 μM Necrostain (N0164, sigma) was added for 1 h to MDM before infection with TIGR4 or TIGR4Δply (MOI 10) for 6 h. (d) Cell viability was assessed by measuring supernatant LDH levels, and (e) supernatant TNF levels measured using ELISAs. Data from four experiments are presented means ± SEM and analysed by two‐way ANOVA with Sidak multiple comparisons test. (f and g) Confocal microscopy for localisation of FAM‐SE labelled TIGR4 and TIGR4Δply (green) after incubation with THP‐1 cells expressing mCherry galectin 3 (red, MOI 100). Images were acquired after quenching fluorescence from external bacteria with trypan blue. The proportion of galectin 3 positive bacteria were measured by microscopy. Sample images are shown in panel F demonstrating that TIGR4 bacteria colocalise with galactin 3, whereas TIGR4Δply do not. The proportion of galectin 3 positive bacteria for TIGR4 and TIGR4Δply are shown in panel (g) as means ± SEM from four experiments.
FIGURE 4
FIGURE 4
Transcriptome analysis of MDMs after incubation with Streptococcus pneumoniae TIGR4, TIGR4Δply, (MOI 10) or controls for 4 h analysed using microarrays. (a and b) The log2 fold difference of genes upregulated by either TIGR4 or TIGR4Δply in the absence (a) or presence (b) of cytochalasin D is shown in scatter plots. The red line indicates the hypothetical line of perfect correlation. (c–e) Taqman qPCR measurement of MDM gene expression for individual pro‐inflammatory cytokines after 4‐h incubation with TIGR4 or TIGR4Δply at MOI 10. Results from three donors are presented as change in cycle threshold with GAPDH as a housekeeping gene for TNF (c), IL‐1β (d), and IL‐6 (e), and analysed by analysed by paired t tests.
FIGURE 5
FIGURE 5
Bioinformatic pathway analysis downstream of the MDM transcriptome response measured using microarrays after 4‐h incubation with Streptococcus pneumoniae (MOI 10). (a) Statistical enrichment (Z score) of Reactome pathways associated with upregulated transcripts in MDM incubated with TIGR4 or TIGR4Δply in the presence or absence of cytochalasin D. The size of the nodes represents the number of genes activated in that condition for the named pathway. The colour of the nodes represent the statistical (Z score) enrichment of these pathways in each condition. These data were obtained from three experiments with separate donors. (b) Heat map depicting statistical enrichment (activation Z score) of predicted upstream regulators for upregulated transcripts in MDMs incubated with TIGR4 or TIGR4Δply in the presence or absence of cytochalasin D, clustered by Euclidean distance for experimental condition (columns) and upstream regulators (rows).
FIGURE 6
FIGURE 6
Pathway analysis of transcriptome data for MDMs after incubation with Streptococcus pneumoniae TIGR4, TIGR4Δply, (MOI 10) or controls for 4 h. (a–d) Identification of the top 10 predicted upstream regulators (blue nodes) of upregulated transcripts (red nodes) in MDMs stimulated with TIGR4 or TIGR4Δply with or without cytochalasin D using ingenuity pathway analysis. (a) TIGR4, (b) TIGR4 with cytochalasin D, (c) TIGR4Δply, and (d) TIGR4Δply with cytochalasin D. (e–h) Pre‐defined and validated gene expression signatures [30, 33, 34] were used to analyse enrichment for specific modules in the transcriptome data; (e) type I interferon, (f) TNF, (g) LPS with etanercept, representing endogenous TNF production. Data were analysed by paired t tests.
FIGURE 7
FIGURE 7
Ply effects on MDM NFκB nuclear translocation and SOCS1 mediated TNF responses. (a–d) Nuclear translocation of NFκB for MDMs infected with TIGR4 or TIGR4Δply (MOI 10) using PAM2CSK4 (TLR2 agonist). The nuclear to cytoplasm ratio of NFκB was measured using confocal microscopy at 1 h. Sample microscopy images after 1 h of infection with NFκB shown in green and nuclei shown in blue of (a) TIGR4 and (b) TIGR4Δply. (c and d) NFκB nuclear to cytoplasm ratio after (c) 1 h or (d) 2 h of infection. Data from three experiments presented as means ± SEM and analysed by unpaired t‐test. (E) MDM supernatant TNF responses measured using ELISA 6 h after incubation with Streptococcus pneumoniae strains (MOI 10) in the presence or absence of the peptide inhibitor (iKIR, 10 μM) of human SOCS1 or a scrambled control peptide inhibitor (10 μM). Data for panels are presented as means ± SEM and analysed by two‐way ANOVA with Sidak's multiple comparisons test.
FIGURE 8
FIGURE 8
Effects of Ply in a mouse model of early lung infection. (a–e) Female CD1 mice (six in each group) were infected intranasally with 5 × 106 CFU of Streptococcus pneumoniae TIGR4 or TIGR4Δply and BALF obtained 2 or 4 h after infection. (a and b) BALF (a) TNF or (b) IL‐1β levels measured by ELISA and shown as means ± SEM analysed by unpaired t tests. (c and d) Bacterial CFU 4 h post‐infection measured by plating serial dilutions recovered from (c) BALF or (d) lung homogenates. The data are displayed as individual data points, with bars representing medians, and analysed by Mann–Whitney U tests. (e) BALF neutrophil concentrations 2 and 4 h after infection presented as mean ± SEM and analysed by one‐way ANOVA with Tukey's multiple comparisons test. (f and g) BALF (f) TNF and (g) IL‐1β levels measured by ELISA 4 h after infection of female CD1 mice (six in each group) with S. pneumoniae D39, D39Δply, or the D39Δply ply complemented strain (D39 comp). Data are shown as means ± SEM analysed by two‐way ANOVA with Sidak multiple comparisons test.

References

    1. O'Brien KL, Wolfson LJ, Watt JP, Henkle E, Deloria‐Knoll M, McCall N, et al. Burden of disease caused by Streptococcus pneumoniae in children younger than 5 years: global estimates. Lancet. 2009;374:893–902. - PubMed
    1. Camberlein E, Cohen JM, Jose R, Hyams CJ, Callard R, Chimalapati S, et al. Importance of bacterial replication and alveolar macrophage‐independent clearance mechanisms during early lung infection with Streptococcus pneumoniae . Infect Immun. 2015;83:1181–9. - PMC - PubMed
    1. Dockrell DH, Marriott HM, Prince LR, Ridger VC, Ince PG, Hellewell PG, et al. Alveolar macrophage apoptosis contributes to pneumococcal clearance in a resolving model of pulmonary infection. J Immunol. 2003;171:5380–8. - PubMed
    1. Bewley MA, Naughton M, Preston J, Mitchell A, Holmes A, Marriott HM, et al. Pneumolysin activates macrophage lysosomal membrane permeabilization and executes apoptosis by distinct mechanisms without membrane pore formation. mBio. 2014;5:5. 10.1128/mBio.01710-14 - DOI - PMC - PubMed
    1. Marriott HM, Gascoyne KA, Gowda R, Geary I, Nicklin MJH, Iannelli F, et al. Interleukin‐1β regulates CXCL8 release and influences disease outcome in response to Streptococcus pneumoniae, defining intercellular cooperation between pulmonary epithelial cells and macrophages. Infect Immun. 2012;80:1140–9. - PMC - PubMed

Publication types