. 2022 Jul 14;13(1):4099.
doi: 10.1038/s41467-022-31670-0.

Accelerated lysine metabolism conveys kidney protection in salt-sensitive hypertension

Affiliations

Accelerated lysine metabolism conveys kidney protection in salt-sensitive hypertension

Markus M Rinschen et al. Nat Commun. .

Abstract

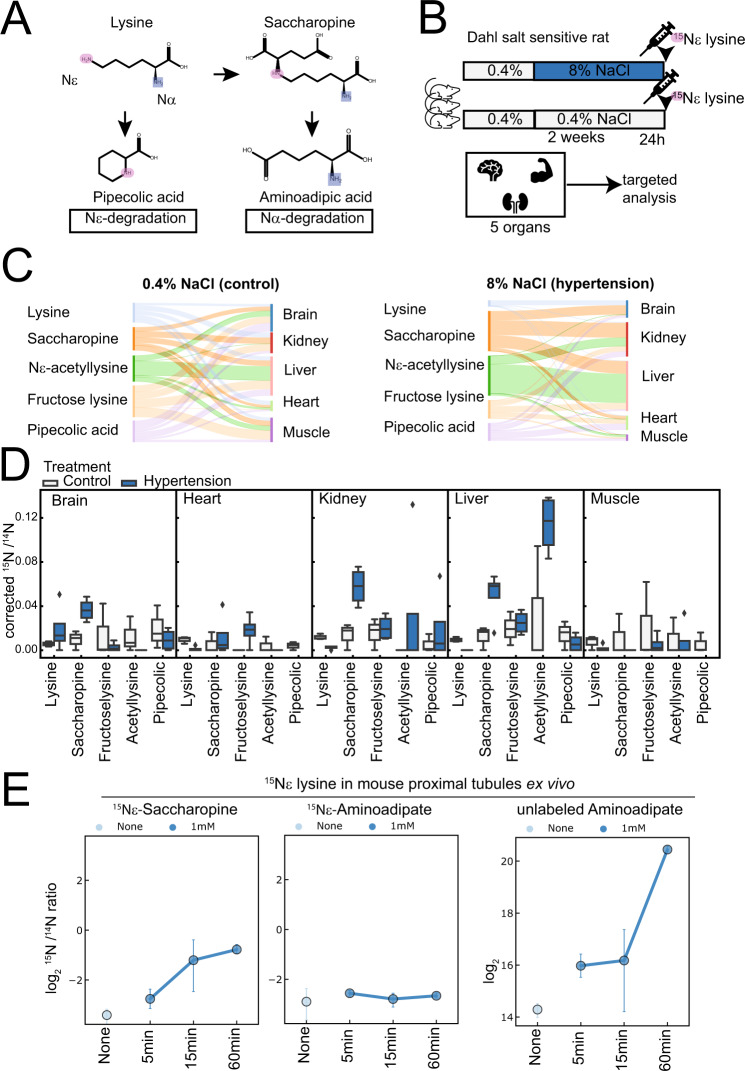
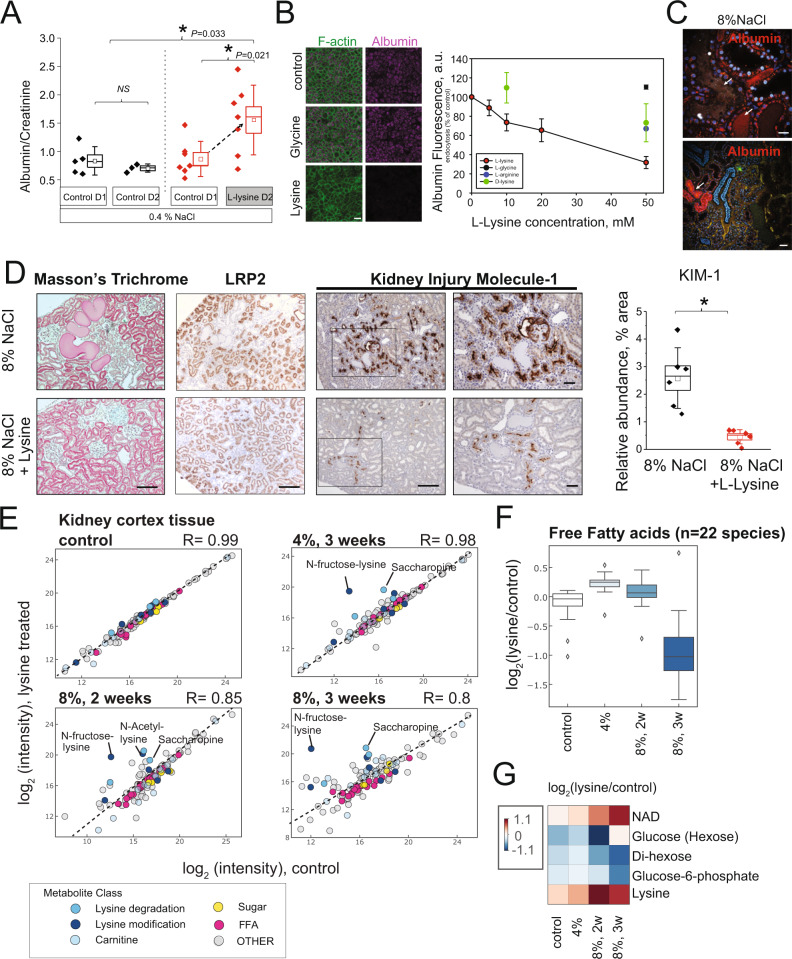
Hypertension and kidney disease have been repeatedly associated with genomic variants and alterations of lysine metabolism. Here, we combined stable isotope labeling with untargeted metabolomics to investigate lysine's metabolic fate in vivo. Dietary 13C6 labeled lysine was tracked to lysine metabolites across various organs. Globally, lysine reacts rapidly with molecules of the central carbon metabolism, but incorporates slowly into proteins and acylcarnitines. Lysine metabolism is accelerated in a rat model of hypertension and kidney damage, chiefly through N-alpha-mediated degradation. Lysine administration diminished development of hypertension and kidney injury. Protective mechanisms include diuresis, further acceleration of lysine conjugate formation, and inhibition of tubular albumin uptake. Lysine also conjugates with malonyl-CoA to form a novel metabolite Nε-malonyl-lysine to deplete malonyl-CoA from fatty acid synthesis. Through conjugate formation and excretion as fructoselysine, saccharopine, and Nε-acetyllysine, lysine lead to depletion of central carbon metabolites from the organism and kidney. Consistently, lysine administration to patients at risk for hypertension and kidney disease inhibited tubular albumin uptake, increased lysine conjugate formation, and reduced tricarboxylic acid (TCA) cycle metabolites, compared to kidney-healthy volunteers. In conclusion, lysine isotope tracing mapped an accelerated metabolism in hypertension, and lysine administration could protect kidneys in hypertensive kidney disease.


Conflict of interest statement

The authors declare no competing interests.

Figures

Fig. 1
Fig. 1. Untargeted analysis of the lysine-labeled metabolome reveals organ-specific lysine handling.
A Mice were labeled in triplicates with food containing exclusively 13C6 Lysine for 1, 2, and 8 weeks. B Overview of main labeled metabolite classes, and their combined isotopologue patterns over time. C Slope of isotope incorporation of lysine metabolites with C4 vs C6 backbone (summarized metabolites from n = 3 isotope-labeled mice), error bar = SD. D Sankey diagram summarizing incorporation slopes of different classes of lysine metabolites in different organs. E Comparison of slopes of incorporations in liver vs kidney. F Comparison of lysine incorporation into the metabolome and the proteome of kidney cortex. G Density of lysine incorporation into the metabolome and proteome of the kidney cortex (summarized metabolites from n = 4 mice per time point). Dark blue lines are protein, light blue lines are metabolite density. Source data for this figure is available.
Fig. 2
Fig. 2. Targeted analysis of the lysine metabolism reveals renal alterations in hypertension and degradation via the Nα-saccharopine pathway.
A Chemical pathways for lysine Nα- and Nε-degradation. B Experimental design to analyze lysine fate in Dahl salt-sensitive rats. C Overview of lysine metabolite isotope signal in D. Corrected ratios of 15N/14N labeled compounds in different organs (n = 3 rats/group). E Proximal mouse tubules were incubated with 15Nε lysine ex vivo (n = 3 independent experiments performed in time course), error bar = SD. Source data for this figure is available.
Fig. 3
Fig. 3. Counteracting lysine deficiency in hypertension ameliorates the disease by physiological mechanisms.
A Lysine administration protocol for rats. B Mean arterial pressure (MAP) in male D/SS rats under L-lysine treatment (n ≥ 7 animals per group), error bar = SEM. C Albuminuria (normalized to creatinine) in control and L-lysine treated D/SS rats (n = 6 animals per group), error bar = SD. D 15N-lysine administration and lysine treatment protocol for rats. 15N isotope-labeled lysine treatment protocol to analyze lysine trace in presence of excess lysine. E Metabolomic analysis and signal distribution of 15N lysine-labeled metabolites in urine (n = 3 animals). F Lysine amplifies hypertension-induced diuresis (diuresis/24 h) (n = 7,8 animals), error bar = SEM. Source data for this figure is available.
Fig. 4
Fig. 4. Lysine treatment directly targets the proximal tubule.
A Urinary albumin/creatinine ratio of short-term (24 h) lysine treated D/SS rats on a normal salt diet (n ≥ 5 animals per group). B Lysine blocks albumin uptake in the proximal tubule cells (OK cell culture) (right panel; green F-actin, magenta fluorescent-labeled albumin). Dose-response showed the inhibition of proximal tubule cell albumin uptake by different lysine concentrations (n ≥ 3 independent cell cultures per group), error bar = SD. C In vivo imaging of protein casts and albumin endocytosis by dual photon microscopy. Albumin is labeled red and both protein plaques and failed endocytosis can be visualized in hypertensive D/SS rats. D Lysine supplement prevents proximal tubule injury in D/SS rats on a high salt diet. Reduction of tissue damage and protein plugs with lysine. Substantial reduction in megalin abundance (LRP2) in dilated proximal tubules can be restored by lysine supplementation. The presence of KIM-1 on the proximal tubule apical membrane shows severe kidney injury in the hypertensive rat on 14D HS (8% NaCl). In contrast, the group supplemented with lysine had a significant reduction in KIM-1 staining. The scale bar is 100 µm; (n = 6 animals per group), error bar = SD. E Lysine proximal tubule metabolism is altered when kidneys are damaged. Different metabolite classes are color-coded. Metabolites changed with q = 0.05 in at least one experiment are depicted. In total, 89 metabolites were significantly altered. F Decrease of free fatty acids in hypertensive kidneys of lysine-treated animals. The boxplot shows a summary of the regulation of 22 quantified free fatty acids (both saturated and unsaturated). G Decrease of sugar metabolites glucose and di-hexose, and increase of NAD in lysine treatment in hypertension. Source data for this figure is available.
Fig. 5
Fig. 5. Previously undescribed metabolite malonyl-lysine connects lysine metabolism to reduced fatty acid synthesis.
A Structure and potential formation of Malonyl-lysine, a previously undescribed metabolite and potentially relationship to fatty acid synthesis. B Non-enzymatic formation of Nε-Malonyl-lysine by incubation of lysine and Malonyl-CoA. Both 13C6 and 12C6 lysine were used in the reaction, and detected by targeted metabolomics assay with heavy and light transitions. C Accelerated formation of Nε-malonyl-lysine in hypertension. Animals from Fig. 3D were analyzed for the formation of Nε-malonyl-lysine (n = 3 independent animals). D Nε-malonyl-lysine abundance in kidney cortices of hypertensive animals with and without lysine treatment (n = 4 independent animals for control, 8% 2w, and 8% 3w diet, and n = 5 for 4% diet, p < 0.05 in a two-tailed t-test). E Nε-malonyl-CoA abundance in kidney cortices of hypertensive animals with and without lysine treatment. Each dot is an observation from an independent animal, error bar = SEM. F Nε-acetyl-lysine abundance in kidney cortices (n = 5 independent animals, p < 0.05 in a two-tailed t-test). G Acetyl-CoA abundance in kidney cortices. Each dot is an observation from an independent animal, error bar = SEM. H Immunoblot analysis of protein acetylation and malonylation in cortex lysates as detected with respective antibodies. β-Actin serves as loading control. Representative run of in total n = 2 runs for n = 4 independent animals per group. Source data for this figure is available.
Fig. 6
Fig. 6. Urine is a sink for lysine conjugate metabolites.
A Integrative analysis depicting kidney and urine metabolite correlation. Chord diagram depicting positive correlations between kidney tissue metabolites and the respective urinary classes. B Chord diagram depicting negative correlations between kidney tissue metabolites and the respective urinary classes. The strongest negative correlations were (1) Albumin and Lysine in the cortex; (2) Albumin and lysine degradation products in the cortex, and (3) lysine and sugar metabolites in the cortex. C Scatterplot depicting log2 fold-changes (lysine vs control) in urinary metabolites and kidney cortex metabolites in untargeted metabolomics analysis. The different metabolite classes are color coded. D Urinary lysine metabolite stoichiometry as determined by targeted metabolomics analysis in 24 h collected urine normalized by urinary creatinine. E Depletion of terminal TCA cycle metabolites by lysine treatment as determined by targeted metabolomics analysis (n ≥ 4 independent animals per group, two-tailed t-test). Source data for this figure is available.
Fig. 7
Fig. 7. Lysine challenge does not develop protection or metabolic perturbation in spontaneous hypertensive rats (SHR), a hypertensive model without kidney disease.
A Proteinuria in SHR rats compared to DSS rats (n = 6 independent animals), error bars = SD. B Effect of Lysine supplementation on the mean arterial pressure (MAP) in SHR rats (n = 6 independent animals), error bars = SD. C Effect of lysine supplementation on the formation of Nε-acetyllysine. Kidney and liver Nε-acetyllysine increases in D/SS rats with comparable hypertension, but not in SHR rats (n ≥ 4 animals per group). D Effect of lysine supplementation on urinary TCA cycle metabolome (n ≥ 4 animals). Source data for this figure is available.
Fig. 8
Fig. 8. Lysine’s metabolic physiology is altered in humans at risk for hypertensive kidney disease.
A Pilot study design. Kidney healthy volunteers and patients at risk for development of hypertensive kidney disease (solitary kidney, or hypertension and mild proteinuria of <1 g/24 h) were included and subjected to oral lysine, followed by 12 h urine collection. B Albuminuria in healthy and risk patients (n = 5 independent patients per group) induced by lysine. * <0.05 in a paired t-test. C Metabolomic analysis of urine of healthy and risk patients. Reduction of TCA cycle metabolites was observed while modified lysine metabolites were increased. Intensities are normalized to UCreatinine, n = 5 independent patients per group, two-tailed paired t-test. D Summary depicting discovery of lysine-dependent kidney protection by proximal tubule protection, metabolome alterations due to shifting cellular metabolism and sinking central carbon conjugate metabolites in the urine. Source data for this figure is available.

References

    1. Jang C, et al. A branched-chain amino acid metabolite drives vascular fatty acid transport and causes insulin resistance. Nat. Med. 2016;22:421–426. doi: 10.1038/nm.4057. - DOI - PMC - PubMed
    1. Wang TJ, et al. 2-Aminoadipic acid is a biomarker for diabetes risk. J. Clin. Invest. 2013;123:4309–4317. doi: 10.1172/JCI64801. - DOI - PMC - PubMed
    1. Hacker SM, et al. Global profiling of lysine reactivity and ligandability in the human proteome. Nat. Chem. 2017;9:1181–1190. doi: 10.1038/nchem.2826. - DOI - PMC - PubMed
    1. Choudhary C, Weinert BT, Nishida Y, Verdin E, Mann M. The growing landscape of lysine acetylation links metabolism and cell signalling. Nat. Rev. Mol. Cell Biol. 2014;15:536–550. doi: 10.1038/nrm3841. - DOI - PubMed
    1. Narita T, Weinert BT, Choudhary C. Functions and mechanisms of non-histone protein acetylation. Nat. Rev. Mol. Cell Biol. 2019;20:156–174. doi: 10.1038/s41580-018-0081-3. - DOI - PubMed

Publication types