. 2022 Jul 14;8(1):58.
doi: 10.1038/s41522-022-00320-0.

In silico identification of two peptides with antibacterial activity against multidrug-resistant Staphylococcus aureus

Affiliations

In silico identification of two peptides with antibacterial activity against multidrug-resistant Staphylococcus aureus

Linda B Oyama et al. NPJ Biofilms Microbiomes. .

Abstract

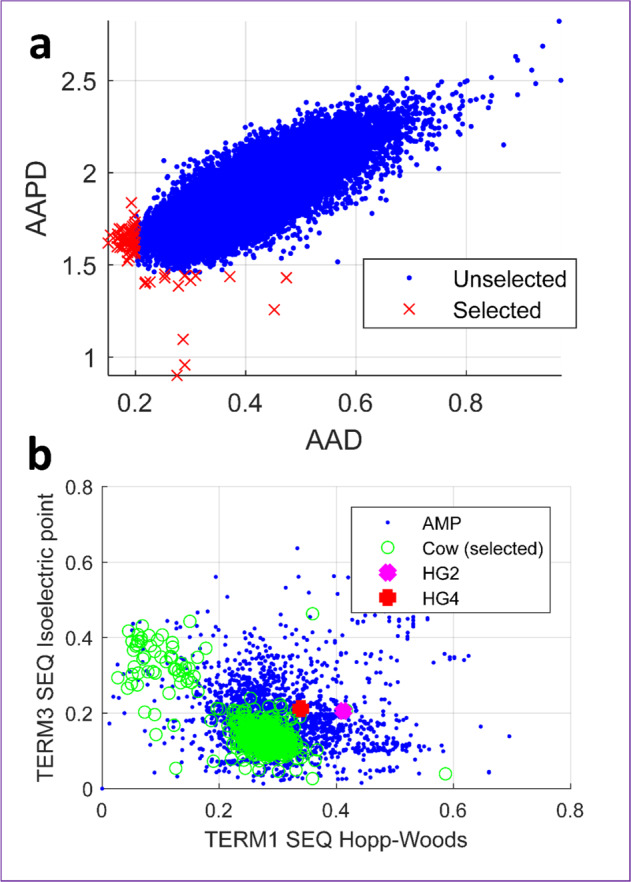
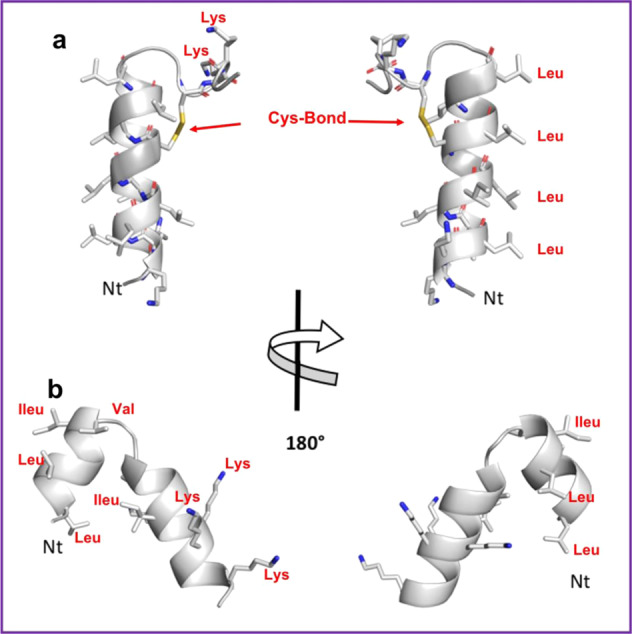
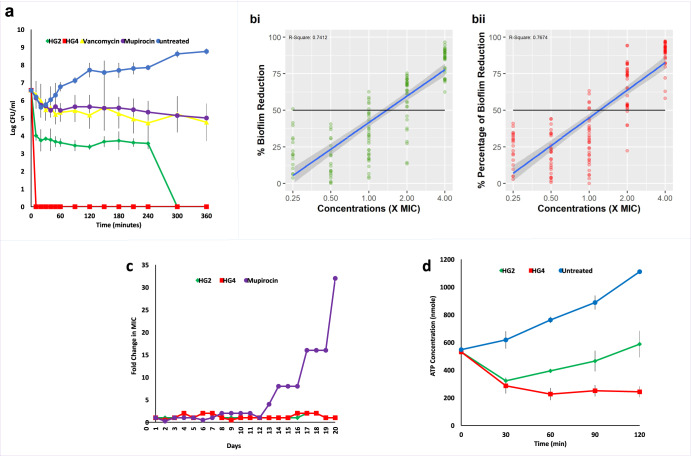
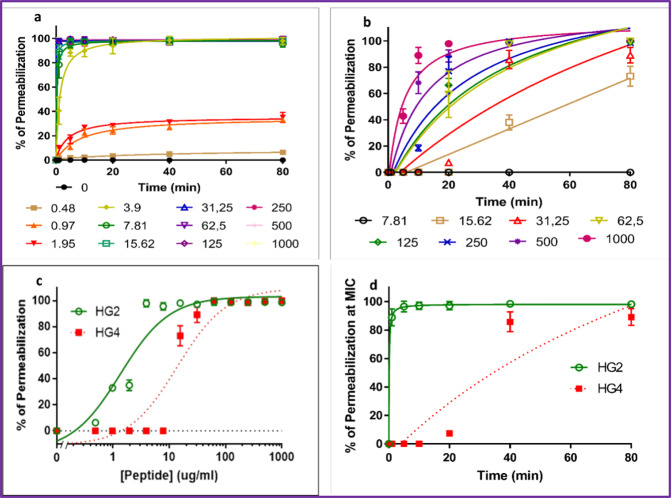
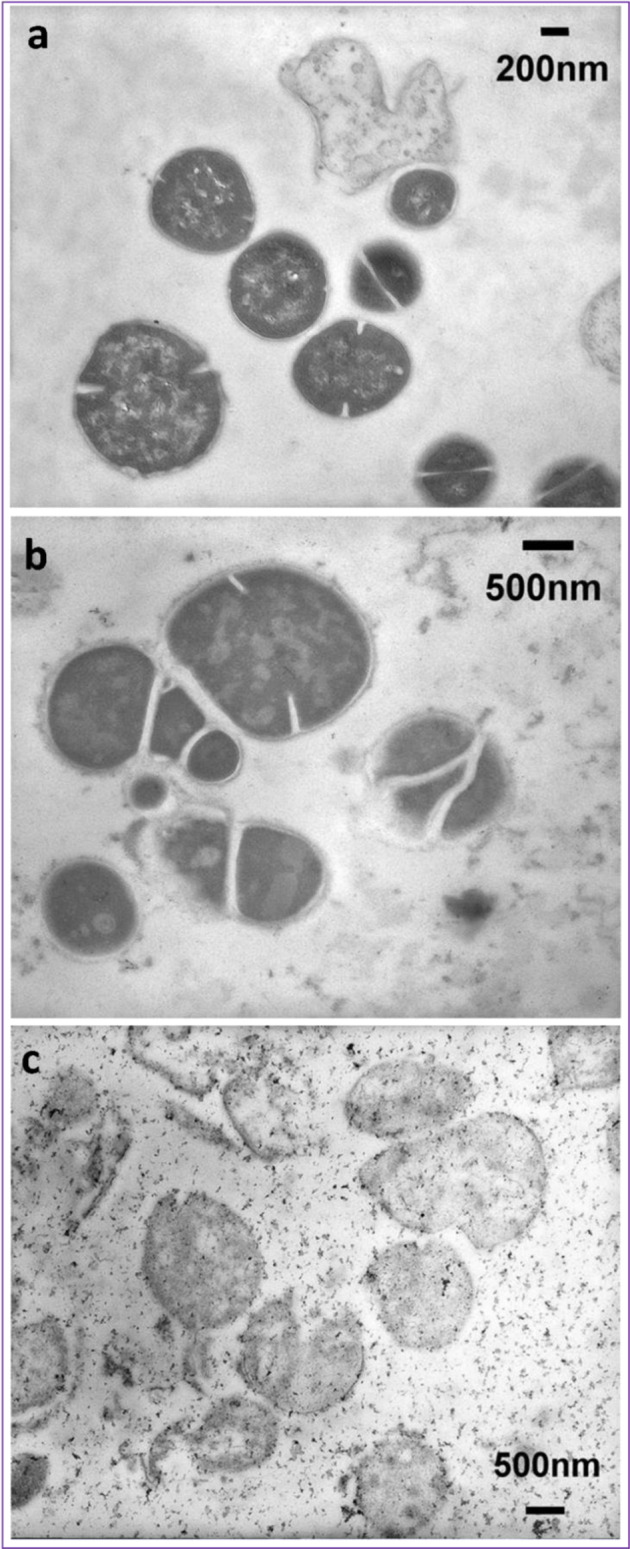
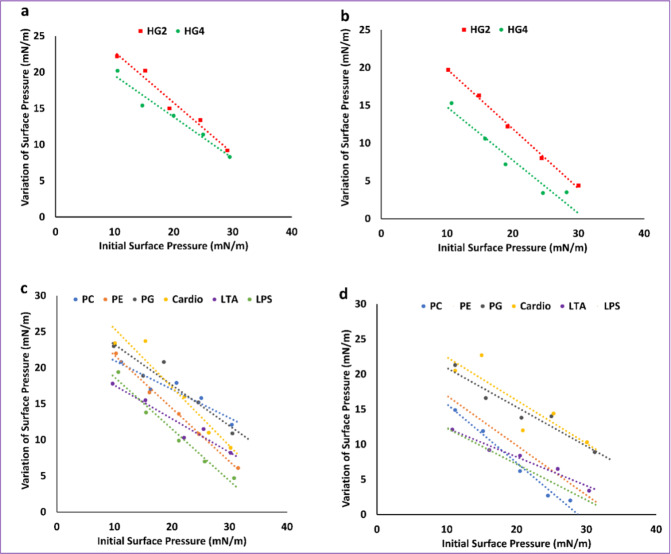
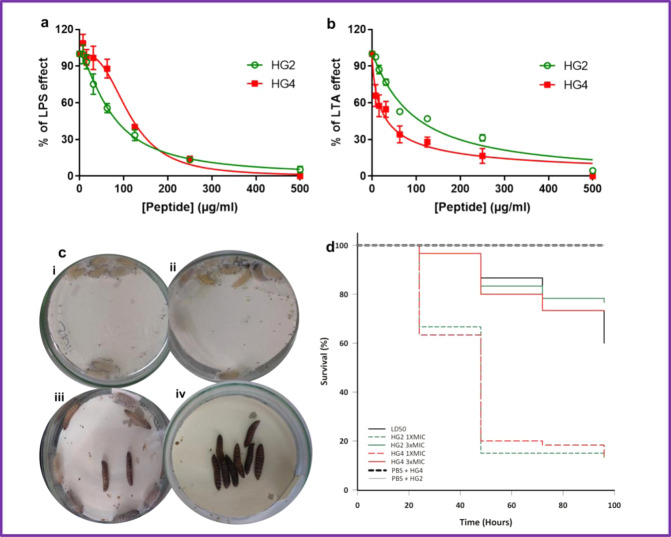
Here we report two antimicrobial peptides (AMPs), HG2 and HG4 identified from a rumen microbiome metagenomic dataset, with activity against multidrug-resistant (MDR) bacteria, especially methicillin-resistant Staphylococcus aureus (MRSA) strains, a major hospital and community-acquired pathogen. We employed the classifier model design to analyse, visualise, and interpret AMP activities. This approach allowed in silico discrimination of promising lead AMP candidates for experimental evaluation. The lead AMPs, HG2 and HG4, are fast-acting and show anti-biofilm and anti-inflammatory activities in vitro and demonstrated little toxicity to human primary cell lines. The peptides were effective in vivo within a Galleria mellonella model of MRSA USA300 infection. In terms of mechanism of action, HG2 and HG4 appear to interact with the cytoplasmic membrane of target cells and may inhibit other cellular processes, whilst preferentially binding to bacterial lipids over human cell lipids. Therefore, these AMPs may offer additional therapeutic templates for MDR bacterial infections.


Conflict of interest statement

The authors declare no competing interests.

Figures

Fig. 1
Fig. 1. In silico identification of peptides.
a Visualisation of distances for AA acids (AAD) and AA pairs (AAPD) for the first 68,274 sequences from library “Cow” meeting the first selection criteria: candidates with AAD <0.2 or AAPD <1.45 are selected as candidates (here: 65). b standard hydrophobicity (TERM1 SEQ Hopp-Woods)—loading (positively charged, TERM3 SEQ Isoelectric Point) plot. Blue dots are known AMPs (library ‘AMP’ consisting of AMPs from the APD2 and Hilpert Library), green coloured signs are AMP hits identified from library ‘Cow’, and finally selected peptides HG2 (magenta) and HG4 (red).
Fig. 2
Fig. 2. Predicted 3D structures for peptides.
Molecular 3D structures for a HG2, b HG4. Main-chain and side chains are depicted in ribbon and stick representation respectively and coloured according to atom type: Carbon, oxygen and nitrogen in green, red and blue respectively. Two orientations are shown rotated about the shown axis. Ct and Nt as well as selected residues are depicted in the figure. Figures were rendered using PyMol.
Fig. 3
Fig. 3. Antimicrobial susceptibility and activity of HG2 and HG4.
a Time-dependent kill of MRSA USA300 cells by AMPs and comparator antibiotics at 3x MIC concentration. bi Anti-biofilm activity of HG2 against MRSA USA300 biofilms and bii Anti-biofilm activity of HG4 against MRSA USA300 biofilms. (A total of 30 biological replicates were conducted per concentration per AMP treatment. The anti-biofilm activity plot (% biofilm reduction) was generated using the ‘ggplot2’ package in R with log-linear regression performed using lm() function. Black line = 50% reduction of the biofilm. Blue line = the log-linear regression with the grey area representing a 95% confidence level interval for predictions from the model. The R2 value of the regression are 0.74 for HG2 and 0.77 for HG4. c Resistance acquisition during serial passaging of MRSA USA300 cells in the presence of sub-MIC levels of antimicrobial agents. The y axis is the fold change in MIC during passaging. For mupirocin, 32x MIC was the highest concentration tested. The figure is representative of three independent experiments d ATP depletion activity in MRSA USA300 cells. Error bars (±) represent the standard deviation from the mean.
Fig. 4
Fig. 4. Membrane permeabilisation action of HG2 and HG4 against MRSA USA300 cells.
a Membrane permeabilisation activity of HG2 at different concentrations (µg/ml) against MRSA USA300 cells measured by propidium iodide assay over time. b Membrane permeabilisation activity of HG4 at different concentrations (µg/ml) against MRSA USA300 cells measured by propidium iodide assay over time. c Determination of EC50 (effective concentration 50) of HG2 and HG4 membrane permeabilisation measured after 80 min. d Membrane permeabilisation kinetics of HG2 and HG4 at their MIC concentration. In all cases, values are from three independent replicates; results are expressed as means ± standard deviation.
Fig. 5
Fig. 5. Representative transmission electron micrographs of MRSA USA300 cells.
a Untreated MRSA USA300 cells. b HG2-treated (3x MIC for 1 h) MRSA USA300 cells. c HG4-treated (3x MIC for 1 h) MRSA USA300 cells. Scale bars are 200 or 500 nm as shown on micrographs.
Fig. 6
Fig. 6. Peptide–lipid interaction and insertion measurements.
Interaction of HG2 and HG4 (at 1 µg/mL final concentration) with lipids (either total lipid extracts or pure lipids) was measured using lipid monolayers. a interaction HG2 and HG4 with total MRSA lipid extract. b interaction HG2 and HG4 with total lipid extract from human erythrocytes. c interaction of HG2 with pure lipids and d interaction of HG4 with pure lipids. 1-palmitoyl-2-oleoyl-sn-glycero-3-phospho-(1’-rac-glycerol) (PG), 1-palmitoyl-2-oleoyl-sn-glycero-3-phosphoethanolamine (PE), Cardiolipin (Cardio), Lipoteichoic acid (LTA) from S. aureus, Lipopolysaccharide (LPS) from E. coli and (1-palmitoyl-2-oleoyl-glycero-3-phosphocholine (PC).
Fig. 7
Fig. 7. Peptide-induced transcriptional changes in MRSA USA300 cells.
a Principal component plot and b Hierarchical clustering analysis plot in the HG2 treatment group after outlier(s) (HG2_1 and Untreated2_1) removal. c Principal component plot and d Hierarchical clustering analysis plot in the HG4 treatment group after outlier (Untreated_3) removal. Frequencies of top ten Gene Ontology (GO) terms in the DEGs in samples treated with e HG2 and f HG4. In total, 12 samples were sequenced (six per HG2 treatment group i.e., HG2_1, HG2_2, HG2_3, Unt_1, Unt_2 and Unt_3 and six per HG4 treatment group including HG4_1, HG4_2, HG4_3, Unt_1, Unt_2 and Unt_3). As the HG2 treatment experiment, was performed separately from the HG4 treatment experiment with each group having their own distinct untreated sample groups, the analysis of each treatment group was performed separately.
Fig. 8
Fig. 8. Peptide anti-inflammatory activity in murine macrophages and in vivo efficacy assessment in G. mellonella MRSA infection model.
Inhibitory action of HG2 and HG4 on LPS or LTA-driven inflammation in murine macrophages: eLUCidate™ Raw 264.7 NF-kB reporter cell line was used to measure the inhibitory action of HG2 and HG4 on LPS (a) or LTA (b) -mediated inflammation as explained in the Materials and Methods’ section. Data were plotted using GraphPad® Prism 7 software. Results are expressed as means ± standard deviation. Representative images of toxicity assay of peptides (c)(i) HG2 and (ii) HG4 in G. mellonella 120 h post-treatment with 3x MIC concentrations. The larvae remained alive and without melanisation. Virulence assay of MRSA USA300 in G. mellonella using a lethal dose inoculum of 106 CFU/per larvae—(iii) 24 h post-infection: some larvae were dead and partial melanisation was observed. (iv). 48 h post-infection: most larvae were dead and complete melanisation was evident. The experiment was done with three experimental replicates, each containing groups of 10 larvae. d Kaplan–Meier survival curves of G. mellonella infected with a lethal dose (LD50) of S. aureus (2.25 × 106 CFU/larvae) and treated with peptides HG2 and HG4 at 1x and 3x MIC concentrations and uninfected larvae treated with peptides in PBS at 3x MIC (placebo showing a 100% larvae survival rate).

References

    1. O’Neill, J. Tackling Drug-Resistant Infections Globally: Fnal Report and Recommendations (Review on Antimicrobial Resistance, 2016).
    1. Lee AS, et al. Methicillin-resistant Staphylococcus aureus. Nat. Rev. Dis. Prim. 2018;4:18033. doi: 10.1038/nrdp.2018.33. - DOI - PubMed
    1. Lewis, P. O., Heil, E. L., Covert, K. L. & Cluck, D. B. Treatment strategies for persistent methicillin-resistant Staphylococcus aureus bacteraemia. J. Clin. Pharm. Ther. 43, 614–625 10.1111/jcpt.12743 (2018). - PubMed
    1. WHO. Global priority list of antibiotic-resistant bacteria to guide research, discovery, and development of new antibiotics. (WHO, 2017).
    1. Chambers HF, DeLeo FR. Waves of resistance: Staphylococcus aureus in the antibiotic era. Nat. Rev. Microbiol. 2009;7:629. doi: 10.1038/nrmicro2200. - DOI - PMC - PubMed

Publication types

MeSH terms