

Network-medicine framework for studying disease trajectories in U.S. veterans
- PMID: 35835798
- PMCID: PMC9283486
- DOI: 10.1038/s41598-022-15764-9
Network-medicine framework for studying disease trajectories in U.S. veterans
Abstract
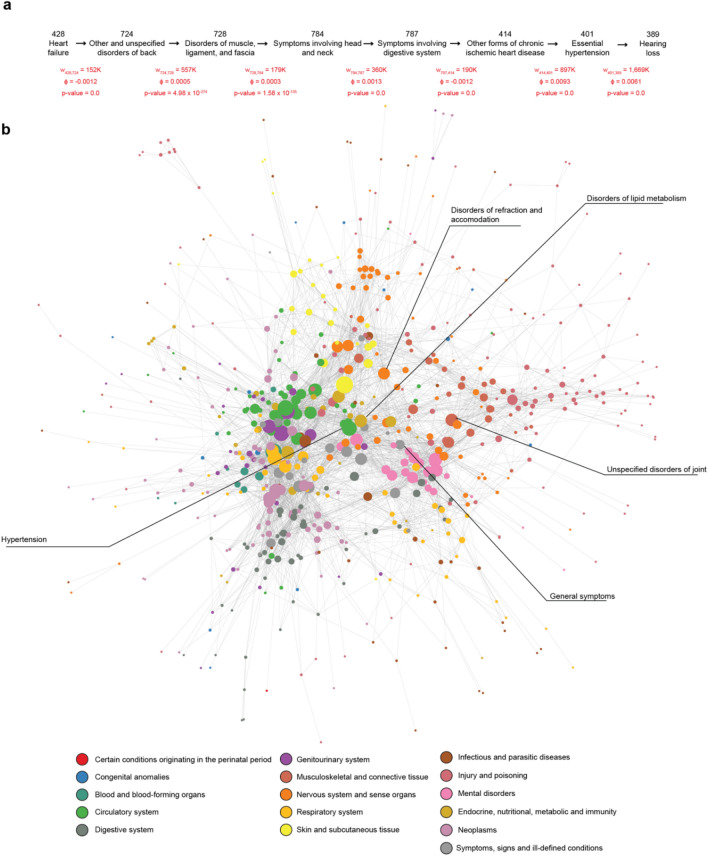
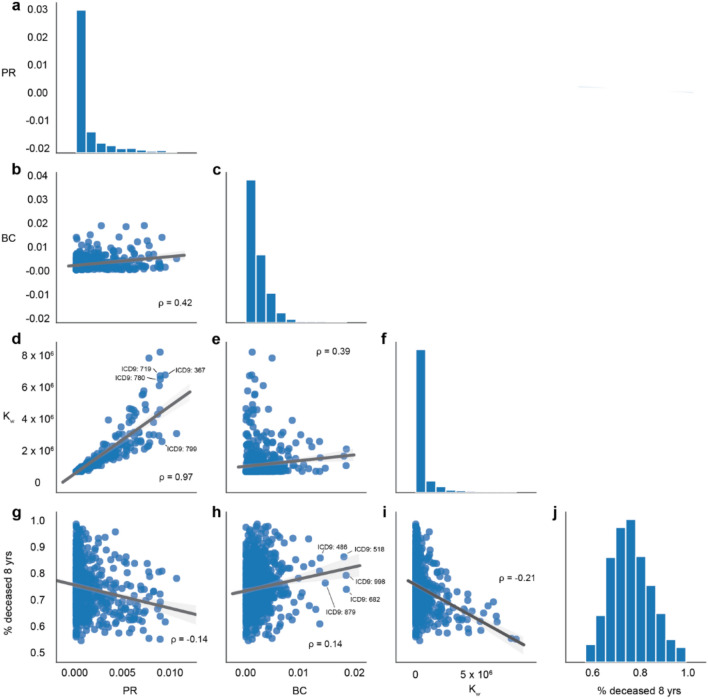
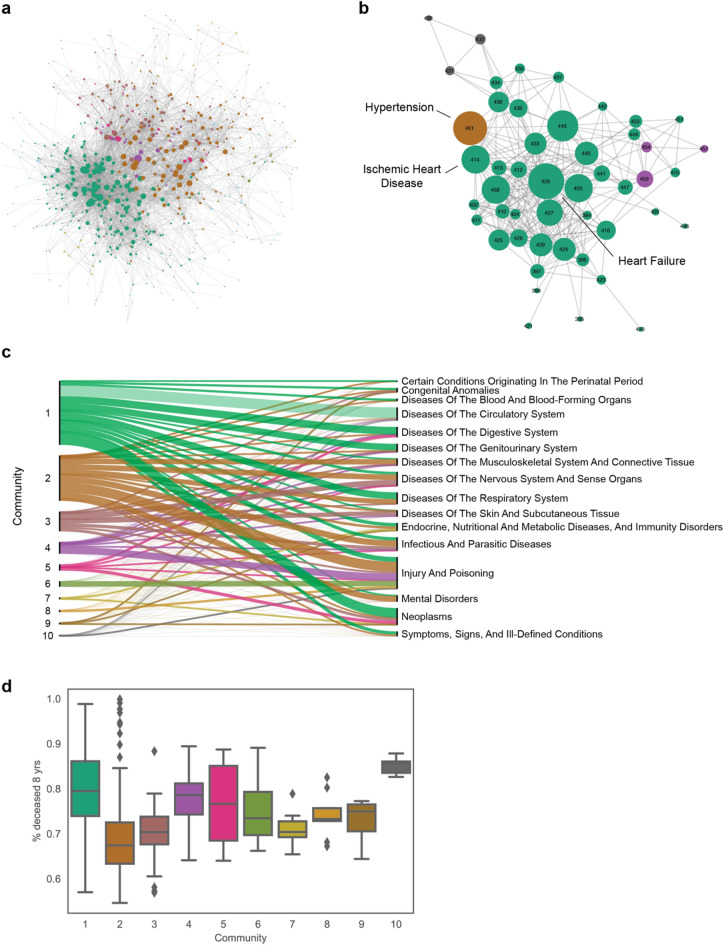
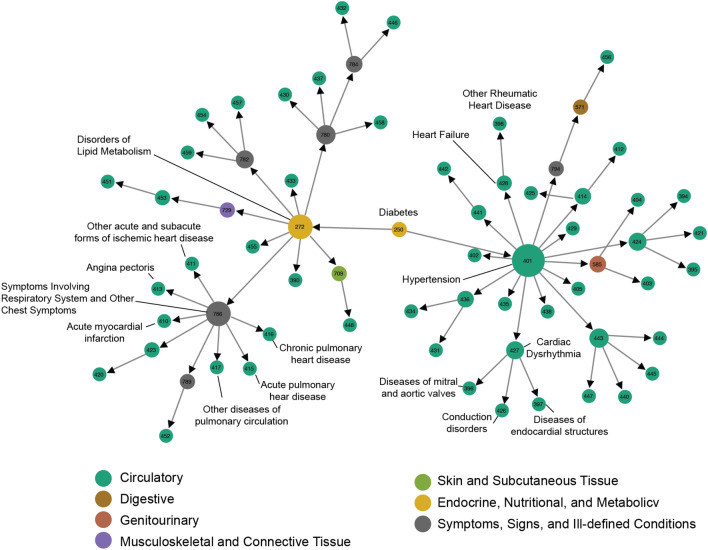
A better understanding of the sequential and temporal aspects in which diseases occur in patient's lives is essential for developing improved intervention strategies that reduce burden and increase the quality of health services. Here we present a network-based framework to study disease relationships using Electronic Health Records from > 9 million patients in the United States Veterans Health Administration (VHA) system. We create the Temporal Disease Network, which maps the sequential aspects of disease co-occurrence among patients and demonstrate that network properties reflect clinical aspects of the respective diseases. We use the Temporal Disease Network to identify disease groups that reflect patterns of disease co-occurrence and the flow of patients among diagnoses. Finally, we define a strategy for the identification of trajectories that lead from one disease to another. The framework presented here has the potential to offer new insights for disease treatment and prevention in large health care systems.
© 2022. This is a U.S. Government work and not under copyright protection in the US; foreign copyright protection may apply.
Conflict of interest statement
A.L.B is co-scientific founder of Scipher Medicine, Inc., which applies network medicine strategies to biomarker development and personalized drug selection and Foodome, Inc. that apply data science to health, and DataPolis, that explores the implications of human mobility. All other authors declare no competing interests.
Figures
References
-
- Dugoff EH, Canudas-Romo V, Buttorff C, Leff B, Anderson GF. Multiple chronic conditions and life expectancy: A life table analysis. Med. Care. 2014;52:688–694. - PubMed
-
- Gijsen R, et al. Causes and consequences of comorbidity: A review. J. Clin. Epidemiol. 2001;54:661–674. - PubMed
-
- Kadam UT, Croft PR, North Staffordshire GP Consortium Group North Staffordshire GP Consortium GroupClinical multimorbidity and physical function in older adults: A record and health status linkage study in general practice. Fam. Pract. 2007;24:412–419. - PubMed
Publication types
MeSH terms
Grants and funding
LinkOut - more resources
Full Text Sources
