. 2022 Jul 14;12(1):12029.
doi: 10.1038/s41598-022-15873-5.

Cabin1 domain-containing gene picd-1 interacts with pry-1/Axin to regulate multiple processes in Caenorhabditis elegans

Affiliations

Cabin1 domain-containing gene picd-1 interacts with pry-1/Axin to regulate multiple processes in Caenorhabditis elegans

Avijit Mallick et al. Sci Rep. .

Abstract

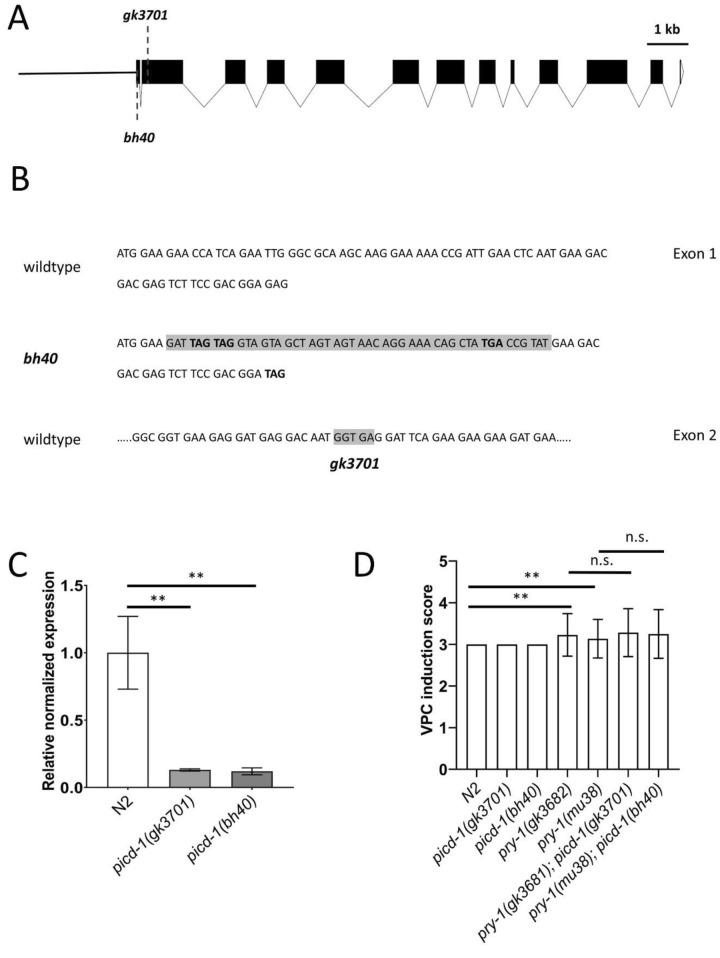
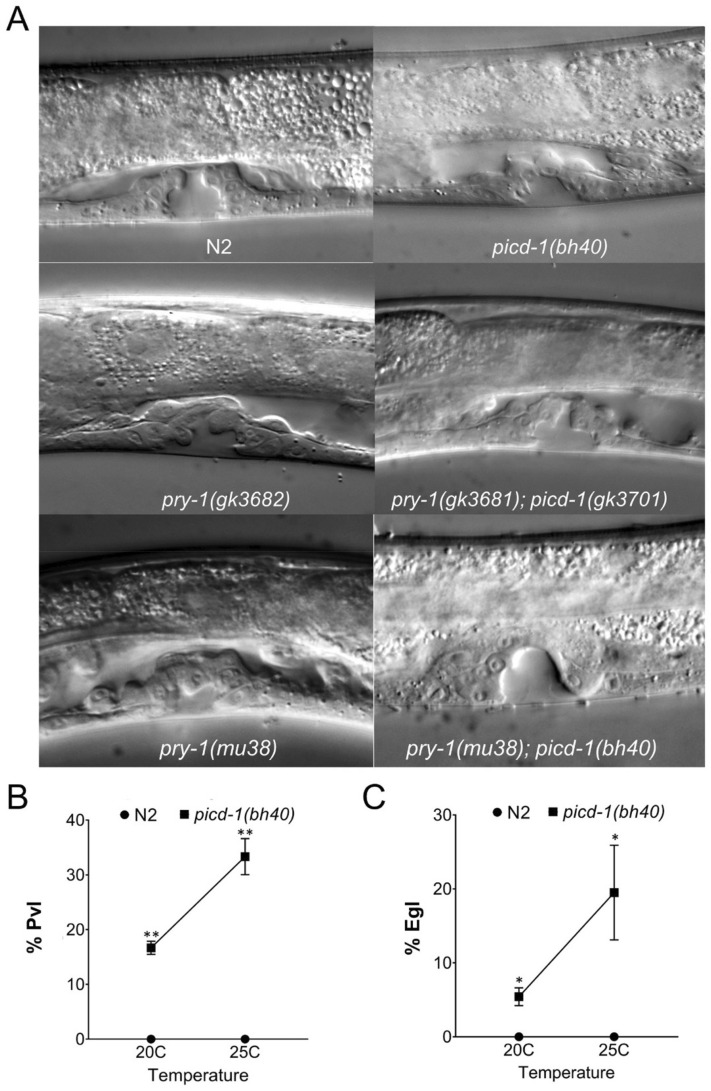
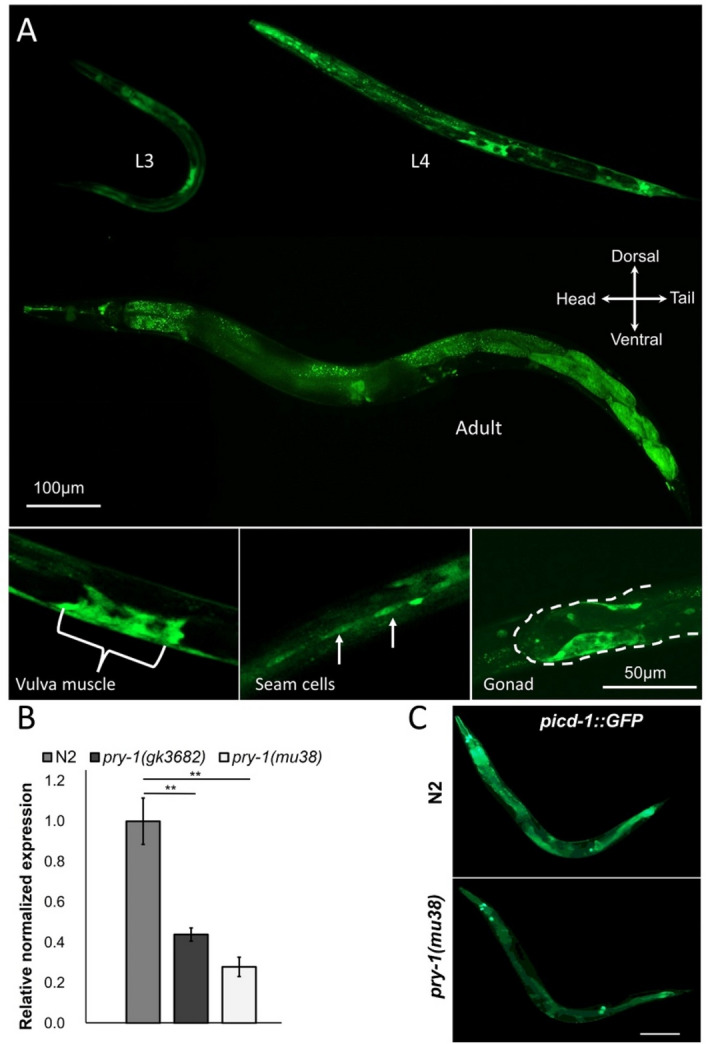
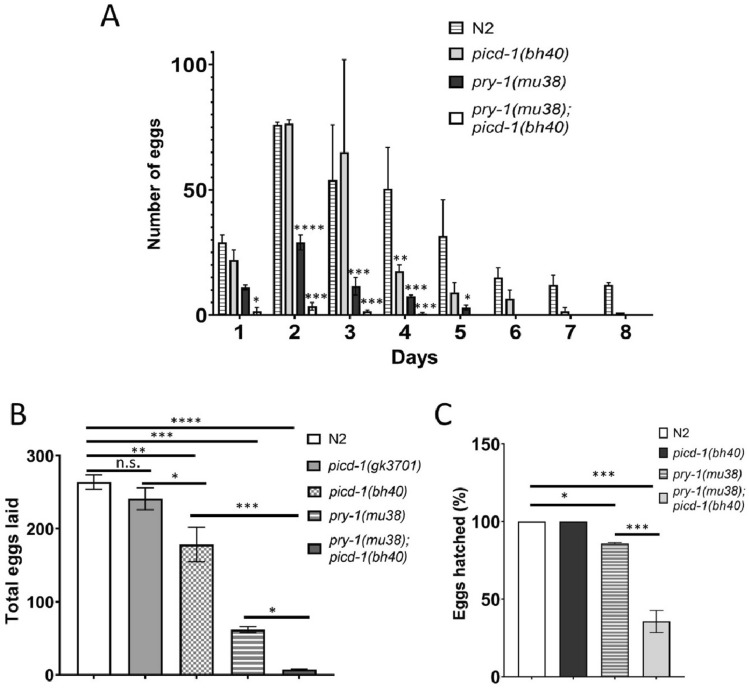
The Axin family of scaffolding proteins control diverse processes, such as facilitating the interactions between cellular components and providing specificity to signaling pathways. While several Axin family members have been discovered in metazoans and shown to play crucial roles, their mechanism of action are not well understood. The Caenorhabditis elegans Axin homolog, pry-1, is a powerful tool for identifying interacting genes and downstream effectors that function in a conserved manner to regulate Axin-mediated signaling. Our lab and others have established pry-1's essential role in developmental processes that affect the reproductive system, seam cells, and a posterior P lineage cell, P11.p. Additionally, pry-1 is crucial for lipid metabolism, stress responses, and aging. In this study, we expanded on our previous work on pry-1 by reporting a novel interacting gene named picd-1 (pry-1-interacting and Cabin1 domain-containing). PICD-1 protein shares sequence conservation with CABIN1, a component of the HUCA complex. Our findings have revealed that PICD-1 is involved in several pry-1-mediated processes, including stress response and lifespan maintenance. picd-1's expression overlapped with that of pry-1 in multiple tissues throughout the lifespan. Furthermore, PRY-1 and PICD-1 inhibited CREB-regulated transcriptional coactivator homolog CRTC-1, which promotes longevity in a calcineurin-dependent manner. Overall, our study has demonstrated that picd-1 is necessary for mediating pry-1 function and provides the basis to investigate whether Cabin-1 domain-containing protein plays a similar role in Axin signaling in other systems.


Conflict of interest statement

The authors declare no competing interests.

Figures

Figure 1
Figure 1
Phenotype of picd-1 mutants and sequence similarity of PICD-1 with CABIN1 proteins. (A) Representative images of Pvl phenotype in pry-1(gk3682) and pry-1(gk3681); picd-1(gk3701) animals. (B) picd-1 mutation enhances Pvl phenotype of pry-1 mutants. Data represent a cumulative of two replicates (n = 99 for pry-1(mu38), 160 for pry-1(mu38); picd-1(bh40), 118 for pry-1(gk3682) and 156 for pry-1(gk3682); picd-1(gk3701)) and error bars represent the standard deviation (Also see Table 1 and Fig. 3). Statistical analyses for panel (B) were done compared to pry-1 mutants alone using one-way ANOVA with Dunnett’s post hoc test and significant differences are indicated by stars (*): ** (p < 0.01). n.s., not significant. (C) Sequence comparison of C. elegans PICD-1 with mammalian CABIN1 and nematode homologs. Orange colors indicate regions of the proteins where alignments were identified by NCBI BLAST along with similarity and identity scores. Non-colored regions are those without sequence similarity. (D) Sequence alignment dendrogram generated by LIRMM (http://www.phylogeny.fr/simple_phylogeny.cgi) using default parameters.
Figure 2
Figure 2
Analysis of picd-1 alleles and their effect on pry-1 mutant Pvl phenotype. (A) Schematic diagram of the picd-1 open reading frame. The approximate locations of bh40 and gk3701 mutations have been indicated. (B) Sequences for bh40 and gk3701 mutations are shown in gray color. and stop codons are shown in bold (also see “Methods”). (C) Expression levels of picd-1 in pry-1(gk3682) and pry-1(mu38) mutants at the L1 stage compared to wild-type. Data represent the means of two replicates and error bars represent the standard error of means. p values were calculated using Bio-Rad software (one-way ANOVA). (D) Bar graph showing VPC induction score in picd-1 and pry-1 mutants alone, and pry-1; picd-1 double mutants compared to N2. Data represent the means of two replicates. The error bars show the standard deviation (n = 22). Statistical analyses were done using one-way ANOVA with Dunnett’s post hoc test. In panels (C,D), significant differences are indicated by stars (*): ** (p < 0.01). n.s., not significant.
Figure 3
Figure 3
picd-1 regulates vulval morphology. (A) Representative vulval images of wild-type, and picd-1 and pry-1 mutants at the mid-L4 stage. picd-1(bh40) animals exhibited abnormal vulva morphology (20.8 ± 5.8%, p < 0.01, n = 35) compared to N2 animals. Scale bar is 50 µm. (B) Line graph showing the percentage of control and picd-1(bh40) mutants showing Pvl phenotype at 20 °C and 25 °C compared to wild-type controls (Also see Table 1). (C) Line graph showing the percentage of control and picd-1(bh40) animals with Egl phenotype at 20 °C and 25 °C. (B, C) Data represent a cumulative of two replicates (n = 64 for picd-1(bh40) and 58 for N2) and error bars represent the standard deviation. Statistical analyses were done using an unpaired t-test and significant differences are indicated by stars (*): * (p < 0.05), ** (p < 0.01).
Figure 4
Figure 4
Expression analysis of picd-1. (A) Representative images of animals expressing picd-1::GFP in larvae and adults. Tissues that show fluorescence include pharynx, gonad, hypodermis, intestine, vulva, body wall muscles, and some in the tail region. Scale bars are shown. (B) Expression levels of picd-1 in pry-1 mutants. Data represent the means of two replicates and error bars represent the standard error of means. p values were calculated using Bio-Rad software (one-way ANOVA). In panel (B) significant differences are indicated by stars (*): ** (p < 0.01). (C) Representative images of N2 and pry-1(mu38) adults showing picd-1::GFP expression. Scale bar is 100 µm.
Figure 5
Figure 5
picd-1 regulates developmental timing, seam cell division and alae formation. (A) picd-1 mutants exacerbate the developmental delay of pry-1 mutants. The data shows the average time taken by picd-1(bh40), pry-1(mu38) and pry-1(mu38); picd-1(bh40) double mutants to reach adulthood compared to wild-type animals. The number of animals for two replicates are: n = 60 for N2, pry-1(mu38), and picd-1(bh40); and 95 for pry-1(mu38); picd-1(bh40)) The error bars represent the standard deviation. (B) Bar graph showing the average number of seam cells (two replicates, n = 30) in the wild-type and pry-1(mu38) animals following control (L4440) and picd-1 RNAi. The error bars represent the standard deviation. (C) Representative images showing alae (white arrowheads) in wild-type N2 and picd-1(bh40) animals. Normal alae are marked with an arrowhead and an extra alae in the picd-1 mutant is indicated by a star (*) (41.88 ± 0.22%, n = 43, p < 0.0001). Statistical analyses were done using multiple unpaired t-test and recorded in Table S2. In panel B, star (*) indicates p < 0.05. Scale bar in panel (C) is 25 µm.
Figure 6
Figure 6
picd-1 regulates brood size and embryonic viability. Bar graphs showing eggs laid on each day (A), totals number of eggs (B), and percentage of the hatched eggs (C) by N2 and single and double mutant animals. Data represent a cumulative of two replicates (total n = 10 for each genotype shown in panels (A) and (B); and n = 500 for N2, 120 for pry-1(mu38) and 14 for pry-1(mu38); picd-1(bh40) double mutants shown in panel (C) and error bars represent the standard deviation. (A) Statistical analyses were done using two-way ANOVA with Tukey’s multiple comparison test and recorded in Table S2. (B,C) Statistical analyses were done using one-way ANOVA with Dunnett’s multiple comparison test and significant differences are indicated by stars (*): * (p < 0.05), ** (p < 0.01), *** (p < 0.001), and **** (p < 0.0001). n.s., not significant.
Figure 7
Figure 7
picd-1 interacts with pry-1 to regulate oocyte development. (A) pry-1; picd-1 double mutants show abnormal oocytes. Scale bar is 25 µm. (B) Posterior gonad arms of wildtype, picd-1(bh40), pry-1(mu38) and pry-1(mu38); picd-1(bh40) adults. pry-1(mu38); picd-1(bh40) animals frequently lack oocytes (46 ± 6%, n = 45, p < 0.01) in the posterior gonad arm when compared to N2 and pry-1(mu38). Statistical analysis was done using an unpaired t-test. The spermatheca (Sp), embryos (E), and oocytes (Oo) are marked. Vulva opening is marked (#). Anterior is on the left. Scale bar is 100 mm.
Figure 8
Figure 8
picd-1 mutants are stress sensitive. (A, B) Expression levels of hsp-4, hsp-6, hsp-16.2, and sod-3 in picd-1(bh40) and pry-1(mu38) young adults. Data represent the means of three replicates and error bars represent the standard error of means. p values were calculated using Bio-Rad software (t-test). (C) Box and whisker plots represent normalized electrotaxis speeds of picd-1(gk3701), picd-1(bh40), pry-1(mu38) and pry-1(mu38); picd-1(bh40) mutants (n = 20). Measurements show 25 to 75th percentiles of data, central horizontal lines represent medians, and vertical lines extend to 10th and 90th percentiles. (D) Bar graphs represent percentage survival following 200 mM paraquat exposure for 4 h (n = 90). (E) Bar graphs represent percentage survival of animals following 25 ng/µl tunicamycin exposure for 4 h. (F) Bar graphs represent percentage survival of animals following 200 mM paraquat exposure for 2 h (n = 120 for N2, 150 for pry-1(mu38) and 169 for pry-1(mu38); picd-1(bh40)). For panels (CF), data are the cumulative of two replicates and error bars represent the standard deviation. (C, F) Statistical analyses were done using one-way ANOVA with Dunnett’s multiple comparison test. (D, E) Statistical analyses were done using two-way ANOVA with Tukey’s multiple comparison test. In all cases significant differences are indicated by stars (*): * (p < 0.05), ** (p < 0.01), *** (p < 0.001), **** (p < 0.0001). Refer to Table S2 for detailed statistical analyses.
Figure 9
Figure 9
picd-1 mutation reduces lifespan and causes age-associated deterioration. (A) picd-1 mutation does not affect the lifespan of pry-1 mutants. (B) picd-1 RNAi reduces the lifespan of control animals but not that of pry-1 mutants. (C,D) Lifespan of picd-1(gk3701) and picd-1(bh40) mutants at 20 °C and 25 °C. See “Materials and methods” section and Table 2 for lifespan data and statistical analyses. (E,F) Bar graphs showing the rates of body bending and pharyngeal pumping of picd-1 mutants compared to wild-type over a period of 5 days. Data represent a cumulative of two replicates (n = 10 animals) and error bars represent the standard deviation. Statistical analyses were done using two-way ANOVA with Tukey’s multiple comparison test. See Table S2 for detailed statistical analyses. (G) Expression analysis of fat-5, fat-6, fat-7, nhr-49, nhr-80 and sbp-1 genes in the picd-1(bh40) mutants compared to wild-type. Data represent the means of two replicates and error bars represent the standard error of means. p values were calculated using Bio-Rad software (one-way ANOVA). (H) Quantification of total lipid using Oil Red O in the wild-type and picd-1(bh40) animals. Data represent a cumulative of two replicates (n > 30 animals) and error bars represent the standard deviation. Statistical analysis was done using an unpaired t-test. In all cases, significant differences are indicated by stars (*): * (p < 0.05), ** (p < 0.01), *** (p < 0.001), and **** (p < 0.0001).
Figure 10
Figure 10
Reduced or loss of picd-1 function affects CRTC-1 localization and CRTC-1 transcriptional response. (A) picd-1, but not L4440 control, RNAi causes nuclear accumulation of CRTC-1::RFP fluorescence. (B) Quantification of nuclear localization in (A). (C) qPCR analysis of dod-24 and asp-12 in picd-1(bh40) animals shows increased expression. (D–F) Similar experiments performed in pry-1 mutants. For panels (C) and (F), data represent the means of two replicates and error bars represent the standard error of means. (G) CRTC-1::RFP localization analysis in N2 and pry-1(gk3682) mutants following L4440 control RNAi, bar-1 and crtc-1 RNAi treatments. Nuclear fluorescence is absent in the case of crtc-1 RNAi. (H) Quantification of nuclear localization in (G). (B,E,G) Data represent the means of three replicates and error bars represent the standard deviation. At least n > 50 animals were examined in each assay. (I) Lifespan of wild type and pry-1 mutant animals following L4440 control and crtc-1 RNAi (also see Table 2). (J) Bar graphs represent percentage survival of animals following 100 mM paraquat exposure for 2 h. Data represent a cumulative of two replicates (n > 60 animals) and error bars represent the standard deviation. For panels (B,E,G,J), statistical analyses were done using an unpaired t-test. Data for panels (C) and (F) were analyzed using Bio-Rad software (t-test). In all cases, significant differences are indicated by stars (*): * (p < 0.05), ** (p < 0.01), and **** (p < 0.0001). n.s., not significant.

Similar articles

Cited by

References

    1. Mallick A, Taylor SKB, Ranawade A, Gupta BP. Axin family of scaffolding proteins in development: lessons from C. elegans. J. Dev. Biol. 2019;7:1–23. doi: 10.3390/jdb7040020. - DOI - PMC - PubMed
    1. Clevers H, Nusse R. Wnt/β-catenin signaling and disease. Cell. 2012;149:1192–1205. doi: 10.1016/j.cell.2012.05.012. - DOI - PubMed
    1. Luo W, Lin SC. Axin: A master scaffold for multiple signaling pathways. Neurosignals. 2004;13:99–113. doi: 10.1159/000076563. - DOI - PubMed
    1. Mallick A, Gupta BP. AXIN-AMPK signaling : Implications for healthy aging. F1000Research. 2022;10:1–14. - PMC - PubMed
    1. Sawa H, Korswagen HC. Wnt signaling in C. elegans *. WormBook. 2013 doi: 10.1895/wormbook.1. - DOI - PMC - PubMed

Publication types

MeSH terms