

High B-value diffusion tensor imaging for early detection of hippocampal microstructural alteration in a mouse model of multiple sclerosis
- PMID: 35835801
- PMCID: PMC9283448
- DOI: 10.1038/s41598-022-15511-0
High B-value diffusion tensor imaging for early detection of hippocampal microstructural alteration in a mouse model of multiple sclerosis
Abstract
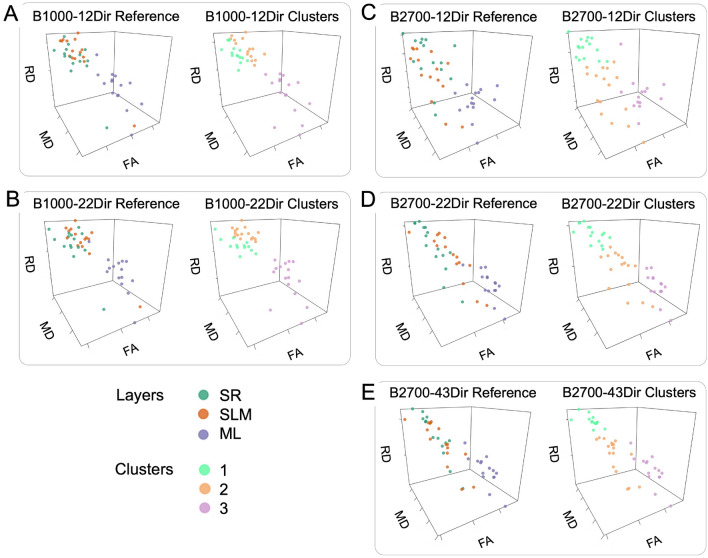
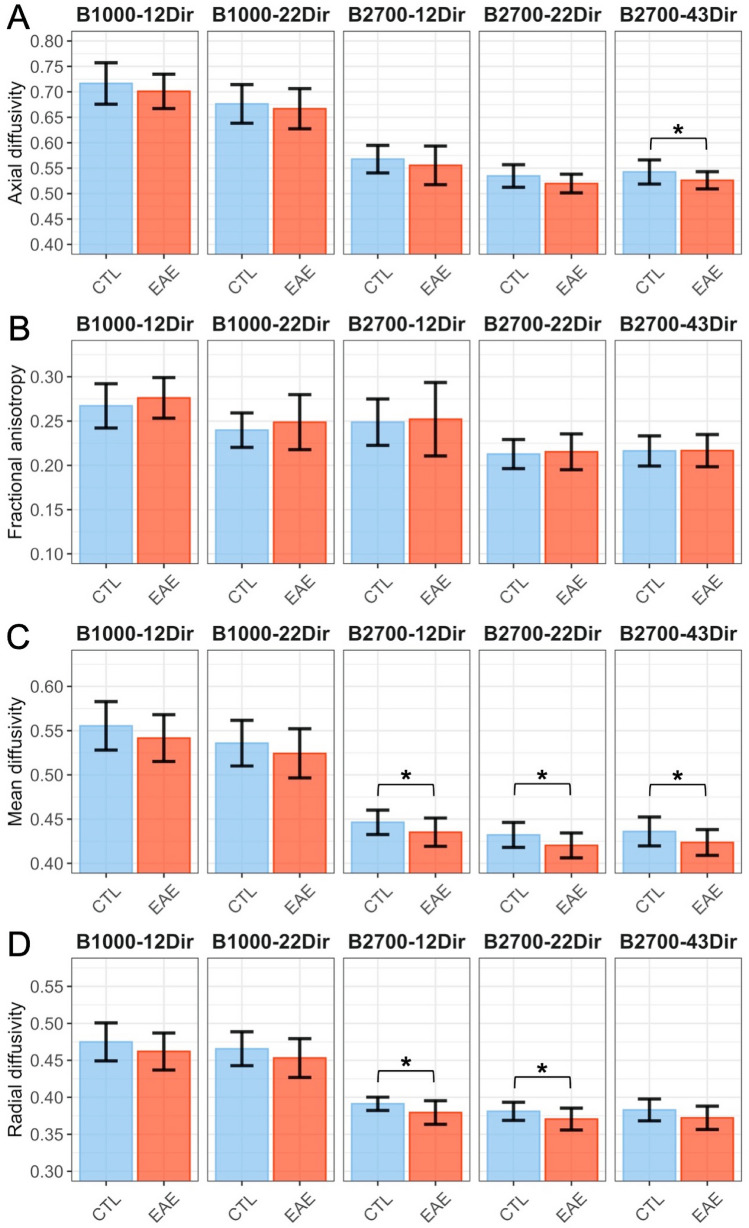
Several studies have highlighted the value of diffusion tensor imaging (DTI) with strong diffusion weighting to reveal white matter microstructural lesions, but data in gray matter (GM) remains scarce. Herein, the effects of b-values combined with different numbers of diffusion-encoding directions (NDIRs) on DTI metrics to capture the normal hippocampal microstructure and its early alterations were investigated in a mouse model of multiple sclerosis (experimental autoimmune encephalomyelitis [EAE]). Two initial DTI datasets (B2700-43Dir acquired with b = 2700 s.mm-2 and NDIR = 43; B1000-22Dir acquired with b = 1000 s.mm-2 and NDIR = 22) were collected from 18 normal and 18 EAE mice at 4.7 T. Three additional datasets (B2700-22Dir, B2700-12Dir and B1000-12Dir) were extracted from the initial datasets. In healthy mice, we found a significant influence of b-values and NDIR on all DTI metrics. Confronting unsupervised hippocampal layers classification to the true anatomical classification highlighted the remarkable discrimination of the molecular layer with B2700-43Dir compared with the other datasets. Only DTI from the B2700 datasets captured the dendritic loss occurring in the molecular layer of EAE mice. Our findings stress the needs for both high b-values and sufficient NDIR to achieve a GM DTI with more biologically meaningful correlations, though DTI-metrics should be interpreted with caution in these settings.
© 2022. The Author(s).
Conflict of interest statement
The authors declare no competing interests.
Figures


Similar articles
-
Diffusion Kurtosis Imaging maps neural damage in the EAE model of multiple sclerosis.Neuroimage. 2020 Mar;208:116406. doi: 10.1016/j.neuroimage.2019.116406. Epub 2019 Dec 10. Neuroimage. 2020. PMID: 31830588 Free PMC article.
-
Deciphering the microstructure of hippocampal subfields with in vivo DTI and NODDI: Applications to experimental multiple sclerosis.Neuroimage. 2018 May 15;172:357-368. doi: 10.1016/j.neuroimage.2018.01.061. Epub 2018 Jan 31. Neuroimage. 2018. PMID: 29409838
-
Investigation of microstructural abnormalities in white and gray matter around hippocampus with diffusion tensor imaging (DTI) in temporal lobe epilepsy (TLE).Epilepsy Behav. 2018 Jun;83:44-49. doi: 10.1016/j.yebeh.2017.12.002. Epub 2018 Apr 10. Epilepsy Behav. 2018. PMID: 29653337
-
Multiparametric magnetic resonance imaging for detection of pathological changes in the central nervous system of a mouse model of multiple sclerosis in vivo.NMR Biomed. 2023 Oct;36(10):e4964. doi: 10.1002/nbm.4964. Epub 2023 May 18. NMR Biomed. 2023. PMID: 37122101 Free PMC article.
-
Advanced Diffusion MR Imaging for Multiple Sclerosis in the Brain and Spinal Cord.Magn Reson Med Sci. 2022 Mar 1;21(1):58-70. doi: 10.2463/mrms.rev.2021-0091. Epub 2022 Feb 15. Magn Reson Med Sci. 2022. PMID: 35173096 Free PMC article. Review.
Cited by
-
Cardiovascular effects on high-resolution 3D multi-shot diffusion MRI of the rhesus macaque brain.Imaging Neurosci (Camb). 2023 Dec 8;1:imag-1-00039. doi: 10.1162/imag_a_00039. eCollection 2023. Imaging Neurosci (Camb). 2023. PMID: 40799687 Free PMC article.
-
Multi-TE Diffusion MRI Dataset for Exploring Combined Diffusion-Relaxometry Methods in Microstructure Imaging.Sci Data. 2025 Jul 10;12(1):1191. doi: 10.1038/s41597-025-05544-1. Sci Data. 2025. PMID: 40640197 Free PMC article.
-
Concussions in young adult athletes: No effect on cerebral white matter.Front Hum Neurosci. 2023 Mar 1;17:1113971. doi: 10.3389/fnhum.2023.1113971. eCollection 2023. Front Hum Neurosci. 2023. PMID: 36936617 Free PMC article.
References
Publication types
MeSH terms
LinkOut - more resources
Full Text Sources
Medical
