

Longitudinal surveillance of influenza in Japan, 2006-2016
- PMID: 35835833
- PMCID: PMC9281223
- DOI: 10.1038/s41598-022-15867-3
Longitudinal surveillance of influenza in Japan, 2006-2016
Abstract
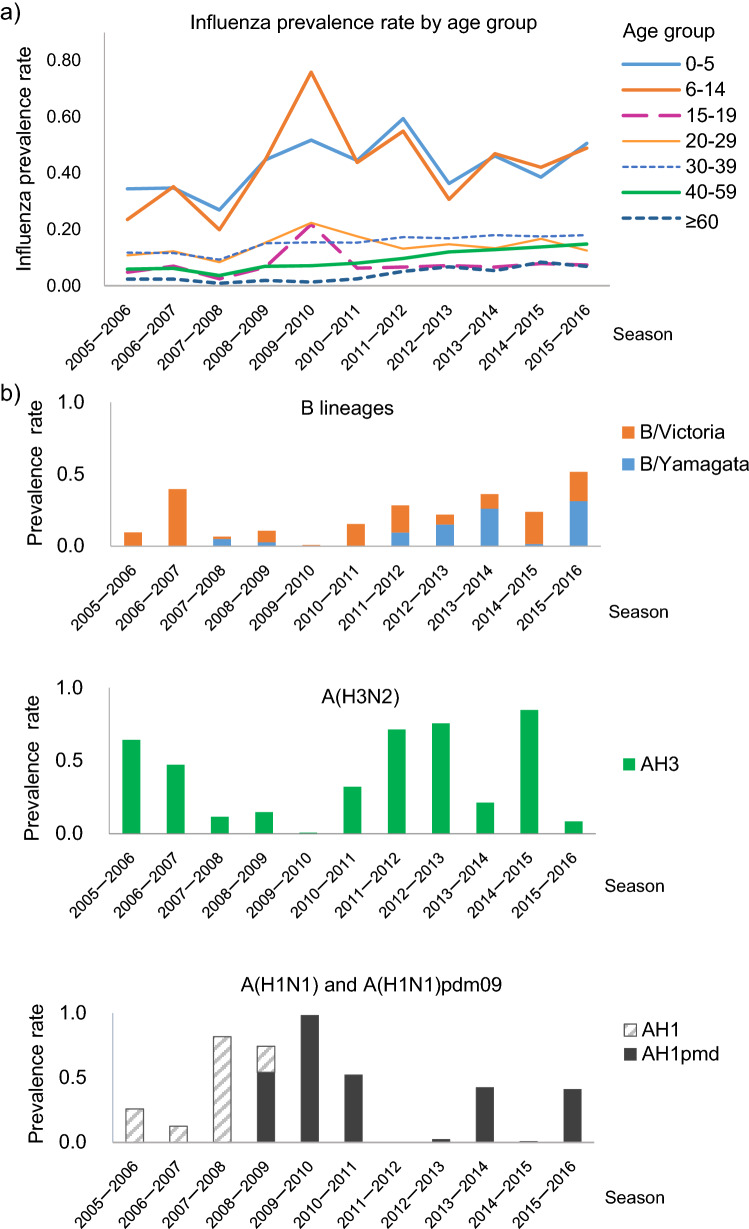
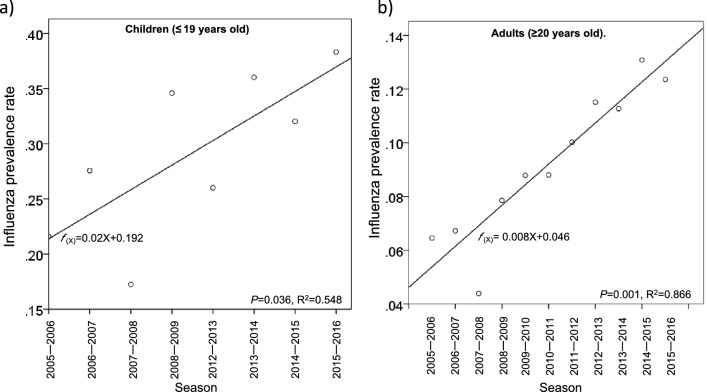
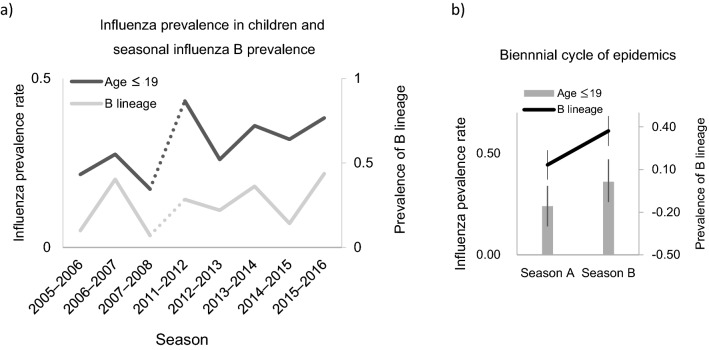
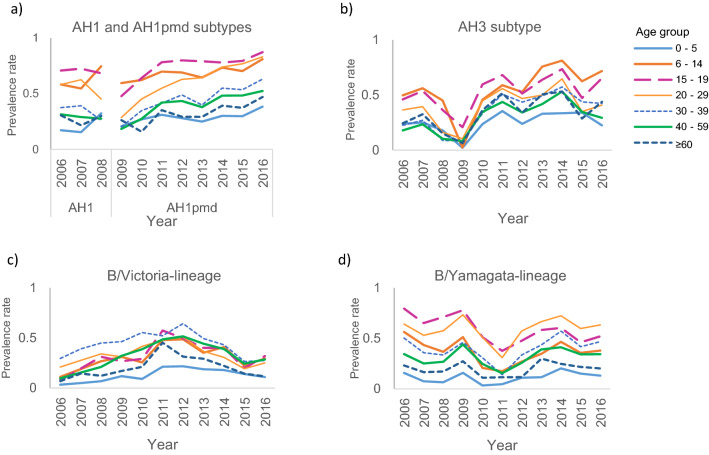
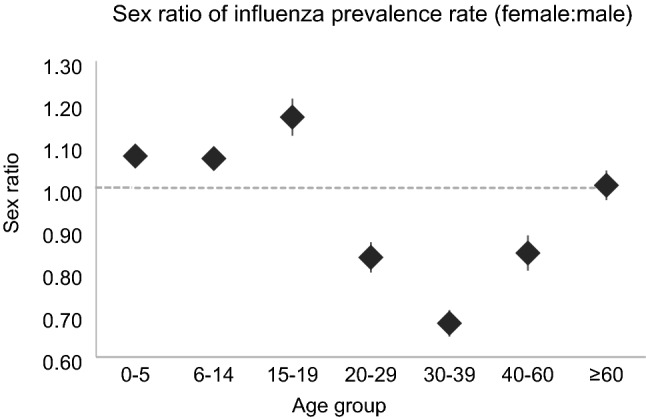
We analysed 2006-2016 national influenza surveillance data in Japan with regards to age-, sex-, and predominant virus-related epidemic patterns and the prevalence of serum influenza virus antibodies. We found a significant increase in influenza prevalence in both children (≤ 19 years old) and adults (≥ 20 years old) over time. The influenza prevalence was higher in children (0.33 [95% CI 0.26-0.40]) than in adults (0.09 [95% CI 0.07-0.11]). Additionally, the mean prevalence of antibodies for A(H1N1)pdm09 and A(H3N2) was significantly higher in children than in adults, whereas the mean prevalence of antibodies for B lineages was relatively low in both children and adults. There was a biennial cycle of the epidemic peak in children, which was associated with a relatively higher prevalence of B lineages. The female-to-male ratios of the influenza prevalence were significantly different in children (≤ 19 years old; 1.10 [95% CI:1.08-1.13]), adults (20-59 years old; 0.79 [95% CI 0.75-0.82]), and older adults (≥ 60 years old; 1.01 [95% CI 0.97-1.04]). The significant increase in influenza prevalence throughout the study period suggests a change of immunity to influenza infection. Long-term surveillance is important for developing a strategy to monitor, prevent and control for influenza epidemics.
© 2022. The Author(s).
Conflict of interest statement
The authors declare no competing interests.
Figures
Similar articles
-
Estimation of the Effectiveness of Quadrivalent Influenza Vaccines by Distinguishing Between Influenza A (H1N1) pdm09 and Influenza A (H3N2) Using Rapid Influenza Diagnostic Tests During the 2018-2019 Season.Intern Med. 2020 Apr 1;59(7):933-940. doi: 10.2169/internalmedicine.3616-19. Epub 2019 Nov 29. Intern Med. 2020. PMID: 31787695 Free PMC article.
-
Reduced replication capacity of influenza A(H1N1)pdm09 virus during the 2010-2011 winter season in Tottori, Japan.J Med Virol. 2013 Nov;85(11):1871-7. doi: 10.1002/jmv.23700. J Med Virol. 2013. PMID: 23983181
-
Children under 10 years of age were more affected by the 2018/19 influenza A(H1N1)pdm09 epidemic in Canada: possible cohort effect following the 2009 influenza pandemic.Euro Surveill. 2019 Apr;24(15):1900104. doi: 10.2807/1560-7917.ES.2019.24.15.1900104. Euro Surveill. 2019. PMID: 30994107 Free PMC article.
-
[Influenza surveillance in five consecutive seasons during post pandemic period: results from National Influenza Center, Turkey].Mikrobiyol Bul. 2016 Jul;50(3):401-17. doi: 10.5578/mb.27775. Mikrobiyol Bul. 2016. PMID: 27525396 Turkish.
-
An Epidemiological Analysis of Summer Influenza Epidemics in Okinawa.Intern Med. 2016;55(24):3579-3584. doi: 10.2169/internalmedicine.55.7107. Epub 2016 Dec 15. Intern Med. 2016. PMID: 27980256 Free PMC article. Review.
Cited by
-
The Burden of Seasonal Influenza and Its Potential Complications Among Older Japanese Adults: A Real-World Database Study.Influenza Other Respir Viruses. 2024 Nov;18(11):e70032. doi: 10.1111/irv.70032. Influenza Other Respir Viruses. 2024. PMID: 39533850 Free PMC article.
-
Phylogenetic Study of Local Patterns Influenza A(H3N2) Virus Transmission in a Semi-Isolated Population in a Remote Island in Japan Between 2011 and 2013.Influenza Other Respir Viruses. 2025 Mar;19(3):e70089. doi: 10.1111/irv.70089. Influenza Other Respir Viruses. 2025. PMID: 40065520 Free PMC article.
-
Clinical and Virologic Outcomes of Baloxavir Compared with Oseltamivir in Pediatric Patients with Influenza in Japan.Infect Dis Ther. 2025 Apr;14(4):833-846. doi: 10.1007/s40121-025-01131-4. Epub 2025 Mar 28. Infect Dis Ther. 2025. PMID: 40155497 Free PMC article.
-
Respiratory virus detections in children presenting to an Australian paediatric referral hospital pre-COVID-19 pandemic, January 2014 to December 2019.PLoS One. 2025 Jan 22;20(1):e0313504. doi: 10.1371/journal.pone.0313504. eCollection 2025. PLoS One. 2025. PMID: 39841690 Free PMC article.
-
Surveillance of seasonal influenza viruses during the COVID-19 pandemic in Tokyo, Japan, 2018-2023, a single-center study.Influenza Other Respir Viruses. 2024 Jan 5;18(1):e13248. doi: 10.1111/irv.13248. eCollection 2024 Jan. Influenza Other Respir Viruses. 2024. PMID: 38188373 Free PMC article.
References
-
- Li Y, Reeves RM, Wang X, Bassat Q, Brooks WA, Cohen C, Moore DP, Nunes M, Rath B, Campbell H, Nair H. Global patterns in monthly activity of influenza virus, respiratory syncytial virus, parainfluenza virus, and metapneumovirus: A systematic analysis. Lancet Glob Health. 2019;7:e1031–e1045. doi: 10.1016/S2214-109X(19)30264-5. - DOI - PubMed
MeSH terms
Substances
LinkOut - more resources
Full Text Sources
Medical
