. 2022 Jul;29(7):628-638.
doi: 10.1038/s41594-022-00799-3. Epub 2022 Jul 14.

Molecular basis for the regulation of human glycogen synthase by phosphorylation and glucose-6-phosphate

Affiliations

Molecular basis for the regulation of human glycogen synthase by phosphorylation and glucose-6-phosphate

Thomas J McCorvie et al. Nat Struct Mol Biol. 2022 Jul.

Abstract

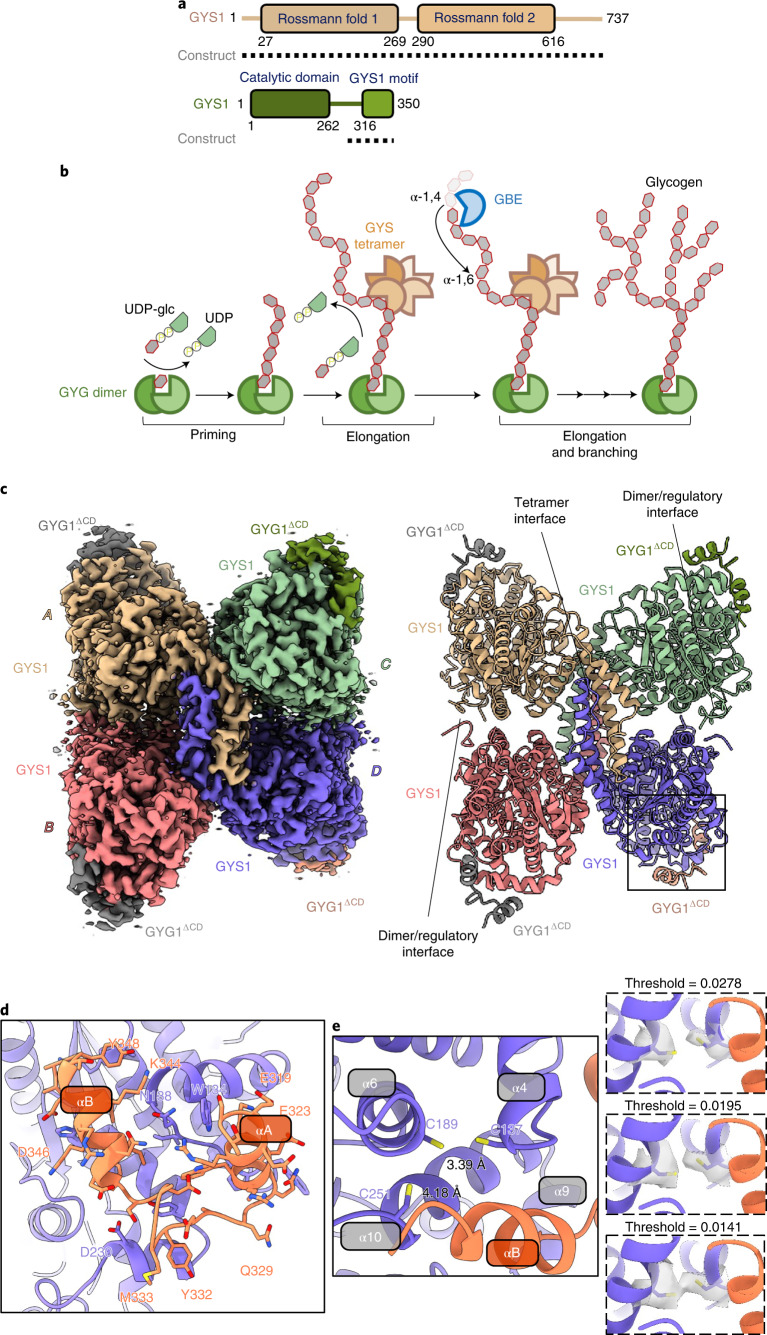
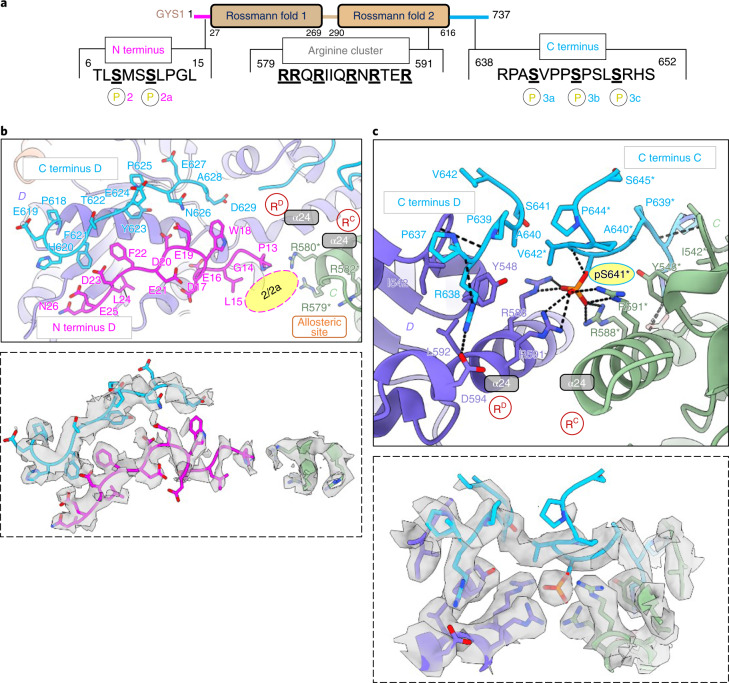
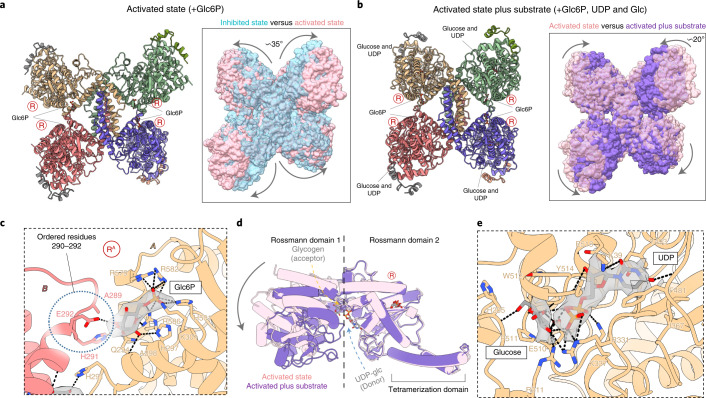
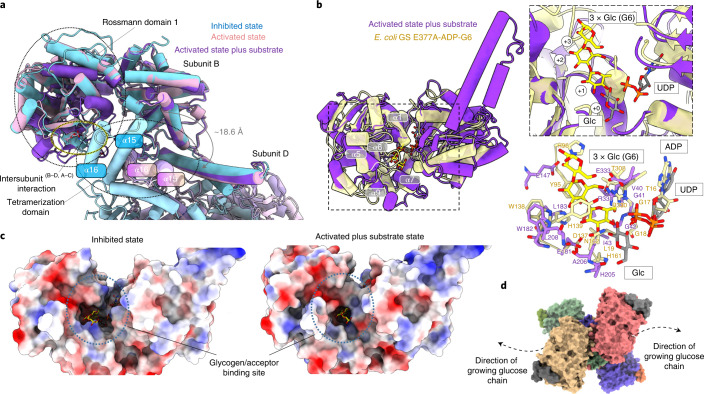
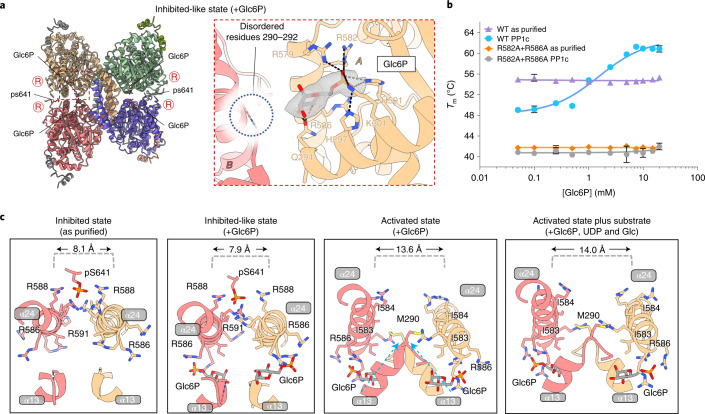
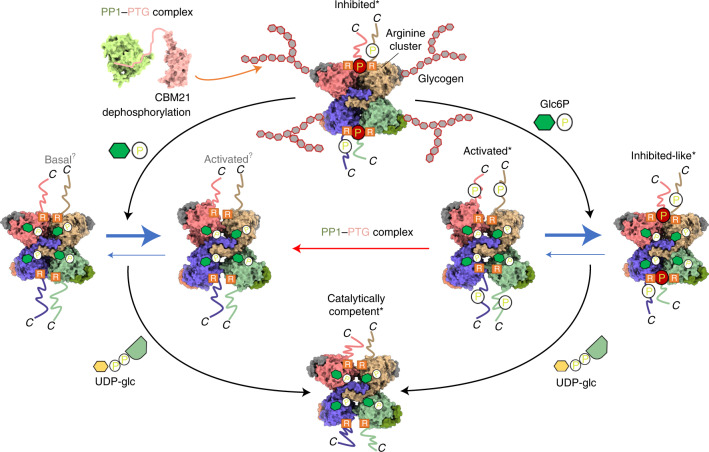
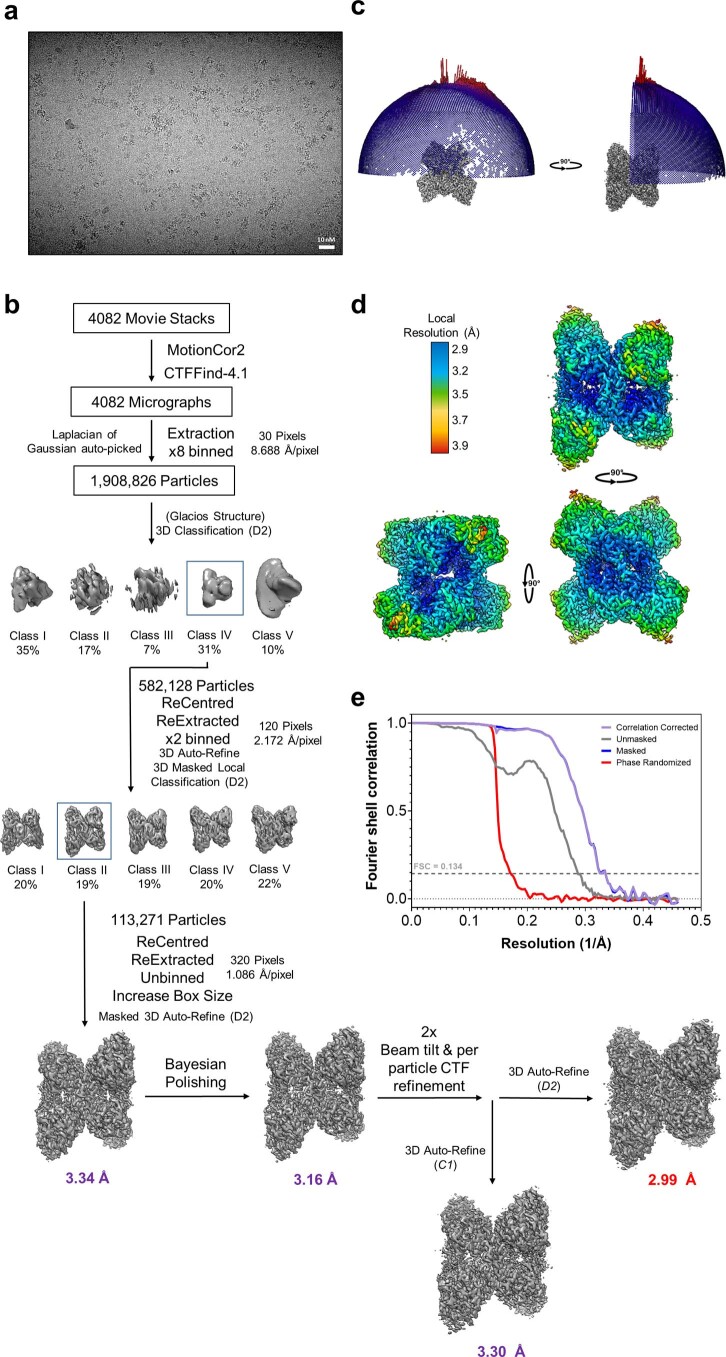
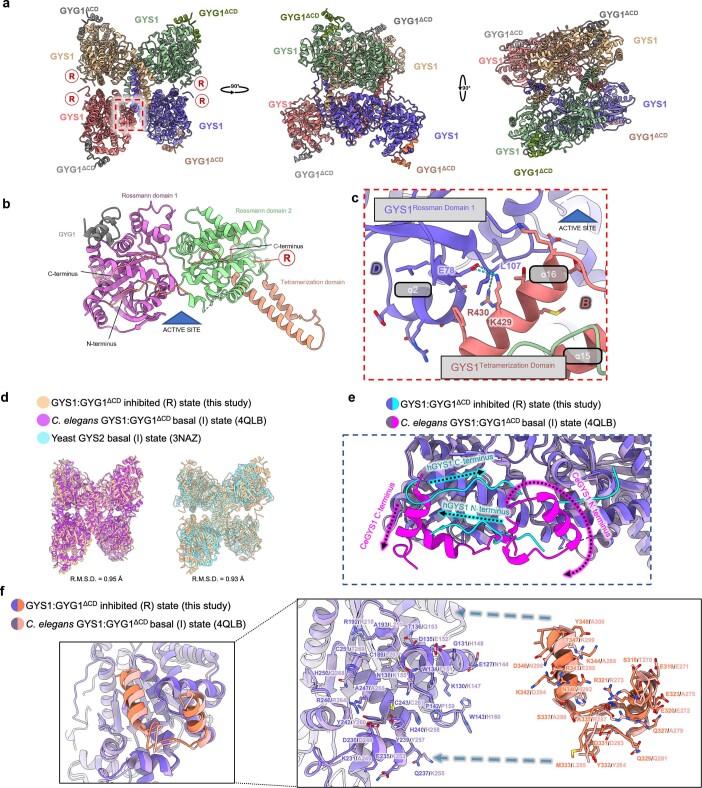
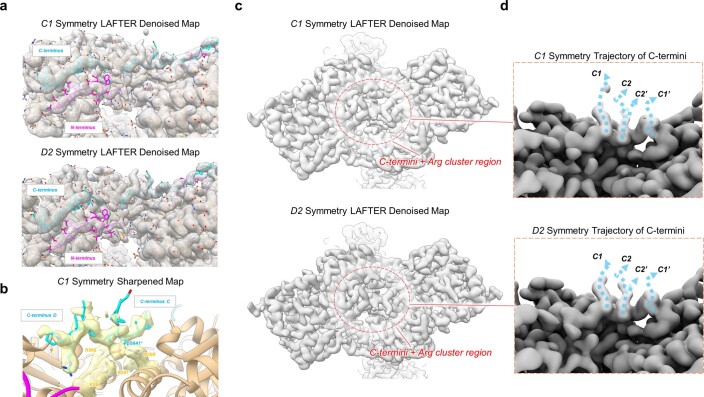
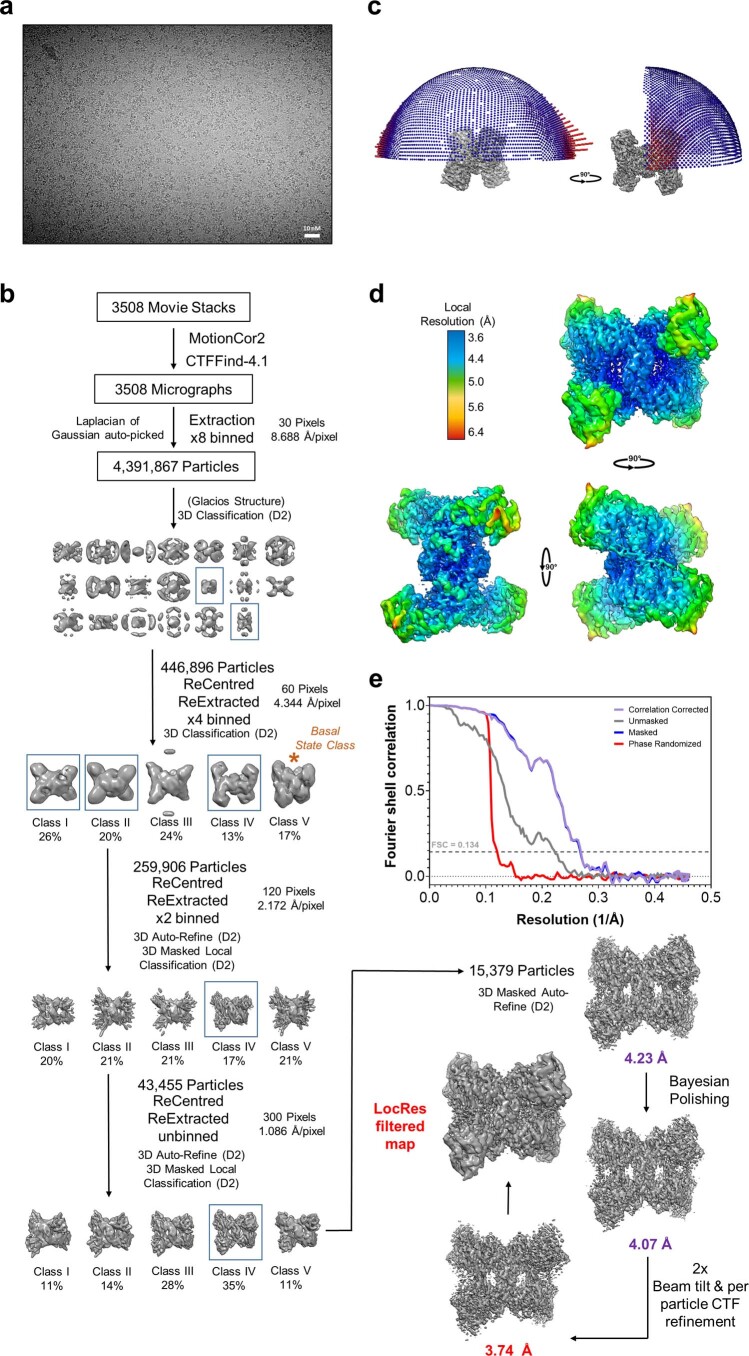
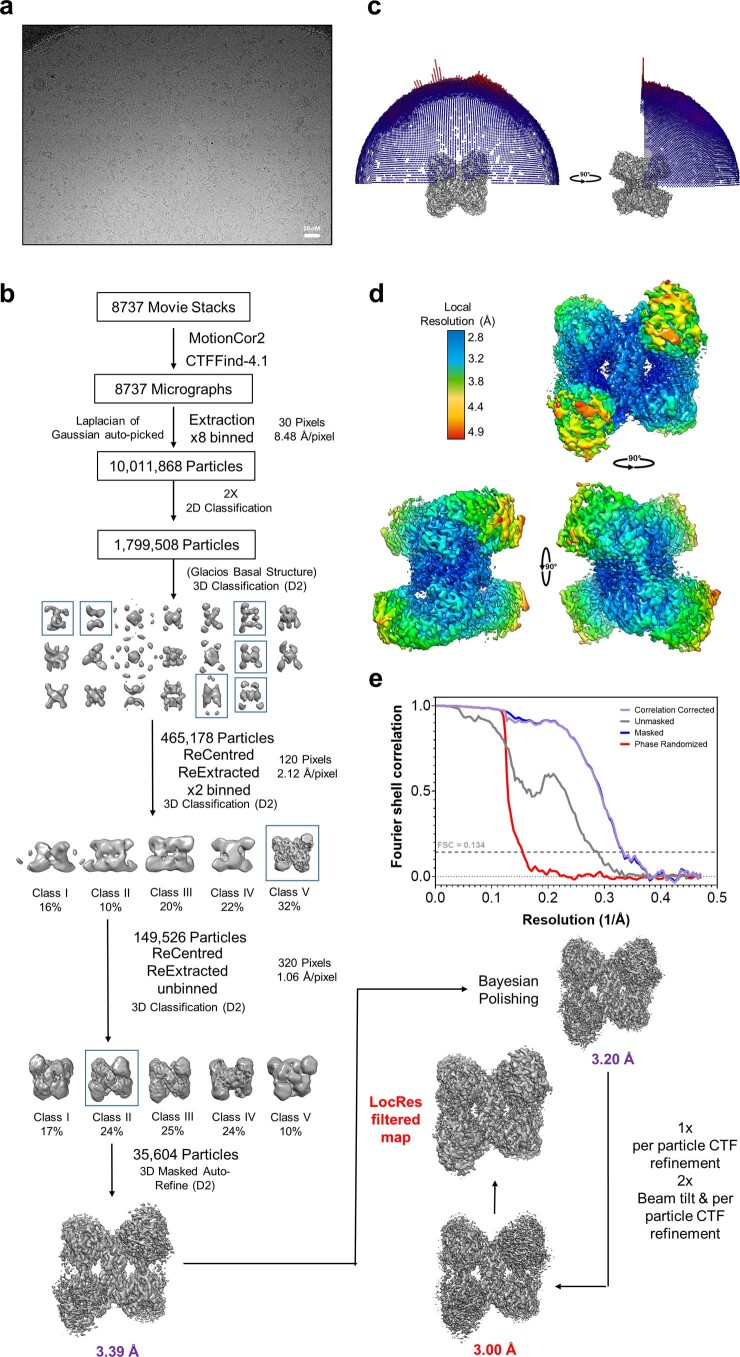
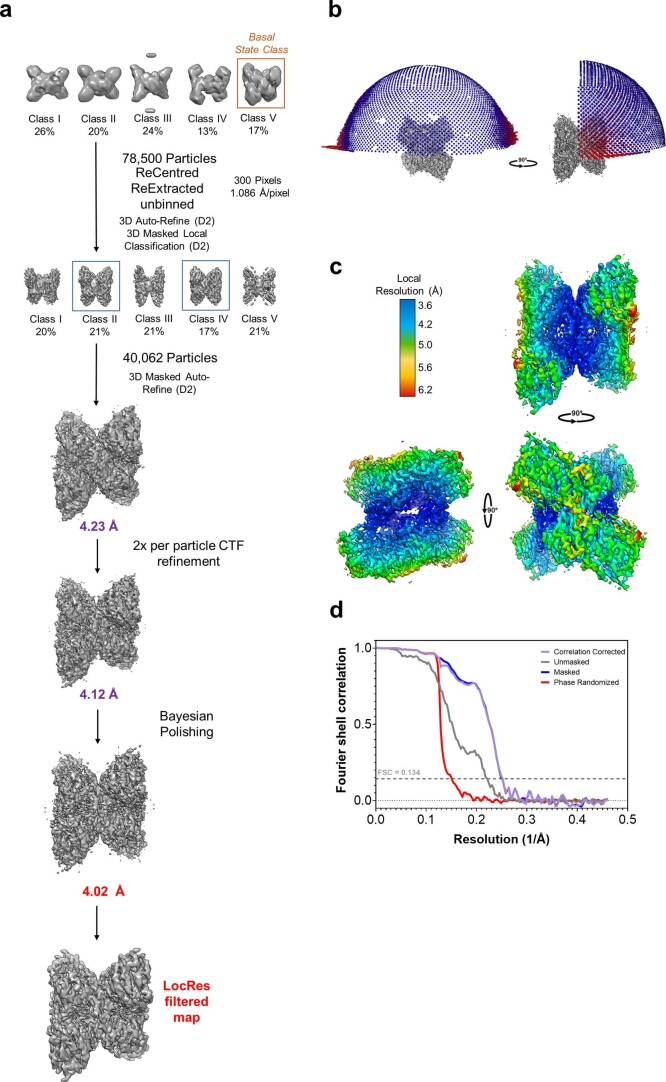
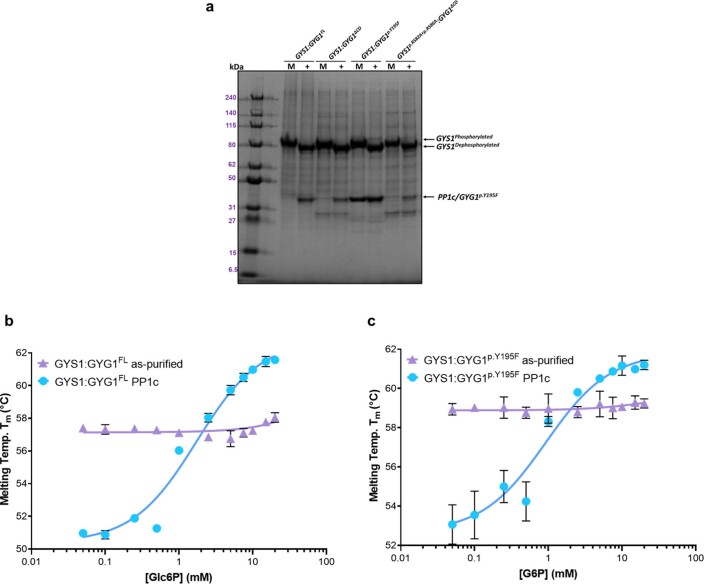
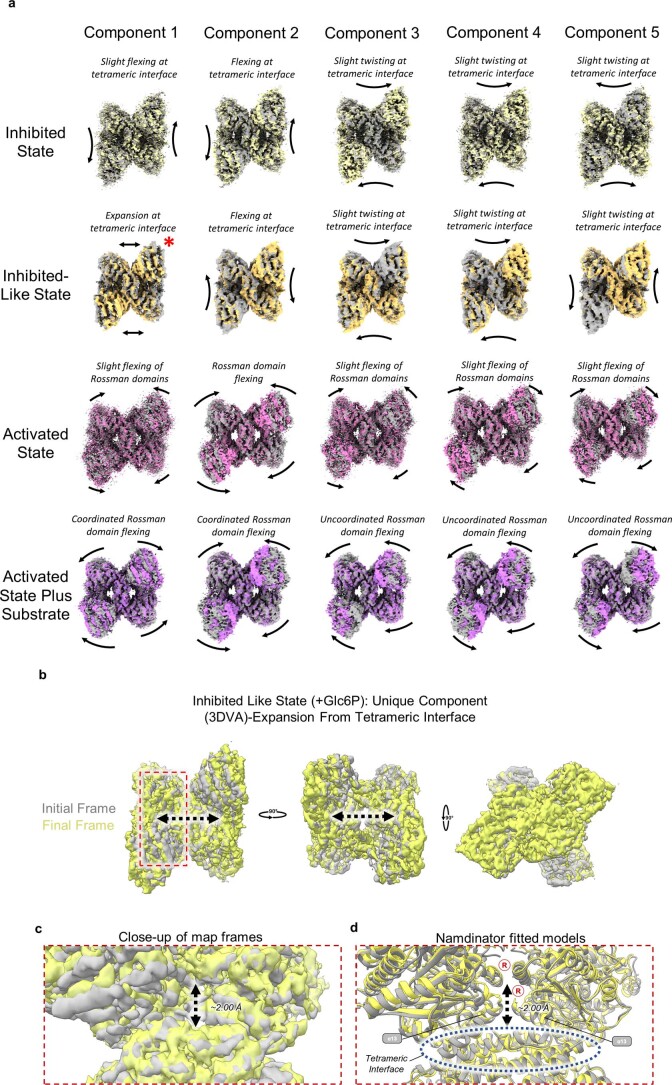
Glycogen synthase (GYS1) is the central enzyme in muscle glycogen biosynthesis. GYS1 activity is inhibited by phosphorylation of its amino (N) and carboxyl (C) termini, which is relieved by allosteric activation of glucose-6-phosphate (Glc6P). We present cryo-EM structures at 3.0-4.0 Å resolution of phosphorylated human GYS1, in complex with a minimal interacting region of glycogenin, in the inhibited, activated and catalytically competent states. Phosphorylations of specific terminal residues are sensed by different arginine clusters, locking the GYS1 tetramer in an inhibited state via intersubunit interactions. The Glc6P activator promotes conformational change by disrupting these interactions and increases the flexibility of GYS1, such that it is poised to adopt a catalytically competent state when the sugar donor UDP-glucose (UDP-glc) binds. We also identify an inhibited-like conformation that has not transitioned into the activated state, in which the locking interaction of phosphorylation with the arginine cluster impedes subsequent conformational changes due to Glc6P binding. Our results address longstanding questions regarding the mechanism of human GYS1 regulation.


Conflict of interest statement

P.M.L., M.T., S.H. and A.B. are employees of Pfizer Inc. T.J.M., L.S., D.S.F., I.M.F. and W.W.Y. declare no competing interests.

Figures

Fig. 1
Fig. 1. Structure of the phosphorylated inhibited (T state) GYS1–GYG1ΔCD complex.
a, Domain diagrams of human GYS1 and GYG1. Dotted lines represent the construct boundaries of the GYS1–GYG1ΔCD complex used in all cryo-EM experiments. b, Schematic of the enzyme-catalyzed reactions of GYG1, GYS1 and GBE. Glycogen synthesis is a multistep process consisting of a priming step by GYG followed by an elongation step carried out by GYS and then a branching step by GBE. c, Cryo-EM map and model of the tetrameric GYS1–GYG1ΔCD complex at 3.0 Å resolution. Individual GYS1 and GYG1 subunits are coloured separately. d, Enlarged view of the GYG1 region interacting with GYS1. GYS1 is coloured purple and GYG1 is coloured coral. e, Residues Cys137, Cys189 and Cys251 form a cysteine-rich pocket on GYS1 at the interface with GYG1. Inset shows different contour levels for the cryo-EM density of Cys137 and Cys189.
Fig. 2
Fig. 2. N and C termini of phosphorylated GYS1–GYG1ΔCD complex in the inhibited (T) state.
a, Key sites of phosphorylation and arginine cluster of a GYS1 subunit. b, Model of the N and C termini of one subunit (D shown) pointing towards the allosteric sites and arginine clusters (RC and RD) at the dimeric C–D interface. Inset shows the EM density of both termini, along with arginine residues from the neighbouring subunit that would interact with phosphorylation sites 2 and 2a. c, Model of C-terminal residues 637–645 from two neighbouring subunits (C and D shown) interacting with their arginine clusters at the dimeric C–D interface. Inset shows EM density of both C termini along with arginine clusters from both subunits interacting with a single site 3a phosphorylation (pS641). Asterisks indicate residues from the neighbouring subunit. Arginine clusters containing α24 helices are labelled. Putative locations for phosphorylation sites 2 and 2a are indicated by pink ovals.
Fig. 3
Fig. 3. Activated structures of the phosphorylated R-state GYS1–GYG1ΔCD complex with and without substrate.
a, Structure of the Glc6P-bound activated (R) state determined from a 3.7 Å map. Inset shows the global conformational changes resulting from Glc6P activation in comparison with the inhibited (T) state. b, Structure of the R state bound to Glc6P, UDP and glucose determined from a 3.0 Å map. Inset shows the global conformational changes resulting from substrate binding in the activated state. Arginine clusters-containing regulatory α24 helices are labelled ‘R’. c, Cis and trans interactions with the Glc6P activator in the R state determined from the higher-resolution substrate-bound map. Interactions with Glc6P in the lower-resolution map without substrate were the same. Cryo-EM density for Glc6P is shown. d, Conformational changes of Rossmann domain 1 in relation to Rossmann domain 2 due to UDP and glucose binding in the R state. e, Interactions with UDP and glucose in the R state. Cryo-EM densities for both ligands are shown.
Fig. 4
Fig. 4. Structural comparison of the GYS1–GYG1ΔCD inhibited and activated states with oligosaccharide-bound E. coli GS.
a, Structural alignment of one subunit of the inhibited, activated and activated plus substrate-bound GYS1 structures. Tetramerization helices are highlighted to show relative movement between adjacent subunits within tetrameric GYS1. b, Structural alignment of the activated plus substrate-bound state against E. coli GS incubated with maltohexaose (G6) bound to three glucose moieties in the active site. The first inset shows the active site of the two structures. The second inset demonstrates conservation of key residues involved in glucan binding. c, Electrostatic surfaces of the inhibited and activated plus substrate-bound states. The predicted glycogen-binding site cleft is highlighted. d, Surface model of the activated state bound to UDP and glucose and the predicted direction of the growing glucose chain. Tm, melting temperature. Source data
Fig. 5
Fig. 5. Phosphorylation hinders transition into the activated (R) state as shown by the phosphorylated inhibited (T) state bound to Glc6P.
a, Overall model of the phosphorylated T state bound to Glc6P and the interactions with this activator. Inset shows cryo-EM density for Glc6P. Arginine clusters-containing regulatory α24 helices are labelled ‘R’. b, Thermal shift assay of as-purified (phosphorylated) versus PP1c-treated (dephosphorylated) GYS1–GYG1ΔCD (labelled WT) and GYS1p.R582A+p.R586A–GYG1ΔCD (labelled R582A + R586A) complexes in the presence of increasing concentrations of Glc6P. Median melting temperatures and standard deviations are shown (n = 4 technical repeats). c, Regulatory helix interactions and conformational changes as seen in our cryo-EM structures. Key residues are labelled. Distances between the regulatory α24 helices were determined as the distances between the Cα atoms of the Asn587 residues.
Fig. 6
Fig. 6. CBM21 domain of PTG binds to the GYS1–GYG1 complex via the associated glucose chain.
a, Structural alignment of the AlphaFold predicted structure of the PTG(CBM21) domain against the starch-binding domain (SBD) from R. oryzae glucoamylase bound to maltotetraose and maltotriose at site I and site II, respectively. Panels show how site I and site II align with the putative GYS-binding motif and putative glycogen-binding motif. Both motifs are coloured green. Y203 and W246 labels are highlighted red. b, PTG(CBM21) was incubated with GYS1–GYG1FL, GYS1–GYG1pY195F or GYS1–GYG1ΔCD. The ability of PTG to bind GYS1–GYG1 complexes was assessed by affinity pull-down, followed by SDS–PAGE (n = 4 technical repeats). c, PTG(CBM21) was incubated with GYG1 or GYG1p.Y195F catalytic domain constructs, passed onto affinity resin and analysed by SDS–PAGE (n = 4 technical repeats). The GYG1 catalytic domain exists as a mixture of glucosylated states and runs at a higher apparent molecular weight in SDS–PAGE than GYG1p.Y195F, which is nonglucosylated. d, Thermal shift analysis of PTG(CBM21) in the presence of various sugars and ligands (n = 4 technical repeats). P values between the apo and plus sugar samples were determined by two-tailed unpaired t-test. e, Thermal shift analysis of PTG(CBM21) wild type (labelled WT), PTG(CBM21)p.Y203R variant (labelled Y203R) and PTG(CBM21)p.W246R variant (labelled W246R) in the presence of increasing concentrations of maltoheptaose. Median melting temperatures (Tm) and standard deviations are shown (n = 3 technical repeats). Source data
Fig. 7
Fig. 7. Proposed model of phosphorylation and Glc6P regulation of GYS1 activity.
Only the C termini and 3a phosphorylation site are shown for simplicity. In addition, the associated glycogen is only shown for the inhibited state, although it is present in all other states. Asterisk indicates structures that have been experimentally determined. Question mark indicates theoretical structures. Our model based on the structural data proposes that the inhibited (T) state is catalytically inactive because the phosphorylated N and C termini bind to a subunit interface. This locking interaction reduces GYS1 flexibility and prevents active site closure by the two Rossmann domains. Glc6P binding to the allosteric site overcomes these inhibitory effects to promote a conformational change to the activated (R) state. However, the R state is in a dynamic equilibrium with an inhibited-like state, owing to competition between the locking interactions of phosphorylated termini at the subunit interface and the conformational change due to Glc6P binding. The inhibition of phosphorylation can also be relieved by the concerted actions of the PP1–PTG complex that binds to the associated glycogen and dephosphorylates the GYS1 N and C termini, resulting in the basal (I) state. This intermediate state is more susceptible to the allosteric effects of Glc6P binding, shifting the dynamic equilibrium more toward the activated state. In the activated state, binding of the substrate UDP-glc promotes the closure of the cleft between the two Rossmann domains, resulting in a catalytically competent state for extending the associated glycogen chain.
Extended Data Fig. 1
Extended Data Fig. 1. Purification and preliminary characterization of GYS1:GYG1 complexes.
a, Coomassie stained SDS-PAGE of small-scale test purifications of GYS1 complexed with differently tagged truncated GYG1. b, Coomassie stained SDS-PAGE of the three GYS1:GYG1 complexes used in this study. c, Blue native PAGE of the three GYS1:GYG1 complexes used in this study. d, Example micrographs of GYS1:GYG1FL and GYS1:GYG1ΔCD complexes collected using a Glacios microscope. e, 2D classes of the GYS1:GYG1ΔCD complex from an initial dataset collected using a Glacios microscope. Arrows indicate regions of fuzzy density protruding from an inter-subunit interface. f, Denaturing mass-spectra of GYS1 and GYG1, as purified and treated with PP1. g, UDP-Glo activity assay of the three GYS1:GYG1 constructs without and with exogenous glycogen. ‘Full’ is the activity assay with all substrates. ‘- Glycogen’ is the assay carried out in the absence of exogenously added glycogen. ‘- Glc6P’ is the assay carried out in the absence of Glc6P. Median and standard deviation of activity is shown (n = 3 technical repeats). Source data
Extended Data Fig. 2
Extended Data Fig. 2. Image processing workflow of the GYS1:GYG1ΔCD inhibited state.
a, Representative K3 micrograph of the GYS1:GYG1ΔCD inhibited state from 4082 micrographs collected. b, Processing flow chart of the GYS1 + GYG1ΔCD inhibited state. c, Angular distribution of the 3.0 Å GYS1:GYG1ΔCD inhibited state map. d, Local resolution variation of the 3.0 Å GYS1:GYG1ΔCD inhibited state map. e, FSC curve of the 3.0 Å GYS1:GYG1ΔCD inhibited state map.
Extended Data Fig. 3
Extended Data Fig. 3. Structure of the GYS1:GYG1ΔCD inhibited state and comparison with the C. elegans gsy-1 and yeast Gsy2p basal/intermediate state structures.
a, Model of the GYS1:GYG1ΔCD inhibited state in three orthogonal views. R represents the location of the regulatory helix. b, Structural model of a GYS1:GYG1ΔCD subunit showing the three domains of GYS1 as well as the GYG1 C-terminus. c, Close up of the inter-subunit interactions close to the active site cleft. d, Structural alignment of the inhibited/T state of the human GYS1:GYG1ΔCD complex with the basal/I states of yeast Gsy2p and C. elegans gsy-1:gyg-1ΔCD complex. e, A zoom in view of the GYG1 interacting region of GYS1 of human and C. elegans. f, A structural alignment of the inhibited/T state of human GYS1 against the basal/I state of C. elegans gsy-1 highlighting the different trajectories of the N- and C- termini.
Extended Data Fig. 4
Extended Data Fig. 4. Modelling of the N- and C- termini of the inhibited/T state of the GYS1:GYG1 complex.
a, Fitting of the N- and C- termini model into the C1 and D2 symmetry LAFTER denoised maps. b, Fitting of the phosphorylated C- termini model into the sharpened C1 symmetry map. c, Views of the regulatory dimeric interface of the C1 and D2 symmetry LAFTER maps. The phosphorylated C-termini region density is symmetric in both maps. d, Predicted directions of the phosphorylated C-termini in C1 and D2 symmetry LAFTER denoised maps. The C-termini are predicted to continue away from the dimeric regulatory interface from two adjacent but different locations.
Extended Data Fig. 5
Extended Data Fig. 5. Image processing workflow of the GYS1:GYG1ΔCD + Glc6P activated state.
a, Representative K3 micrograph of the GYS1:GYG1ΔCD + Glc6P activated state from 3508 micrographs collected. b, Processing flow chart of the GYS1:GYG1ΔCD + Glc6P activated state. c, Angular distribution of the 3.74 Å GYS1:GYG1ΔCD + Glc6P activated state map. d, Local resolution variation of the 3.74 Å GYS1:GYG1ΔCD + Glc6P activated state map. e, FSC curve of the 3.74 Å GYS1:GYG1ΔCD + Glc6P activated state map.
Extended Data Fig. 6
Extended Data Fig. 6. Image processing workflow of the GYS1:GYG1ΔCD + Glc6P+UDP-glc activated state.
a, Representative K3 micrograph of the GYS1:GYG1ΔCD + Glc6P+UDP-glc activated state from 8737 micrographs collected. b, Processing flow chart of the GYS1:GYG1ΔCD + Glc6P+UDP-glc activated state. c, Angular distribution of the 3.00 Å GYS1:GYG1ΔCD + Glc6P+UDP-glc activated state map. d, Local resolution variation of the 3.00 Å GYS1:GYG1ΔCD + Glc6P+UDP-glc activated state map. e, FSC curve of the 3.00 Å GYS1:GYG1ΔCD + Glc6P+UDP-glc activated state map.
Extended Data Fig. 7
Extended Data Fig. 7. Image processing workflow of the GYS1:GYG1ΔCD + Glc6P inhibited-like state.
a, Processing flow chart of the GYS1:GYG1ΔCD + Glc6P inhibited-like state. b, Angular distribution of the 4.02 Å GYS1:GYG1ΔCD + Glc6P inhibited-like state map. c, Local resolution variation of the 4.02 Å GYS1:GYG1ΔCD + Glc6P inhibited-like state map. d, FSC curve of the 4.02 Å GYS1:GYG1ΔCD + Glc6P inhibited-like state map.
Extended Data Fig. 8
Extended Data Fig. 8. Thermal shift assay of phosphorylated (as purified) versus dephosphorylated (PP1 treated) GYS1:GYG1 complexes in the presence of increasing concentrations of Glc6P.
a, Gel shift of GYS1:GYG complexes mock (M) or treated with PP1c (+) for 2 hours at room temperature. 5 µg of each complex was loaded and ran on SDS-PAGE. A decrease in the molecular weight of GYS1 after PP1 treatment is apparent. b, Thermal shift assay of GYS1:GYG1FL against Glc6P. c, Thermal shift assay of GYS1:GYG1p.Y195F against Glc6P. Median melting temperatures and standard deviations are shown (n = 4). Source data
Extended Data Fig. 9
Extended Data Fig. 9. 3D variability analysis of the four different states of GYS1 and the unique component of the inhibited like Glc6P bound state.
a, 3D variability analysis components of all four states of GYS1 reported in this study. Initial and final frames are shown. The unique component of the inhibited like-state is highlighted by a red asterisk. Most movements are either slight flexing at the tetrameric interface or flexing of the N-terminal Rossman domains. b, Alignment of initial and final frames showing a global expansion from the central helical tetrameric interface. c, Close-up of the frames around the allosteric/G6P binding density. d, Namdinator fitted models into the initial and final frames showing a clear movement of the alpha-helices 13 from both subunits towards the regulatory helices.

Similar articles

Cited by

References

    1. Roach PJ. Glycogen and its metabolism. Curr. Mol. Med. 2002;2:101–120. doi: 10.2174/1566524024605761. - DOI - PubMed
    1. Smythe C, Cohen P. The discovery of glycogenin and the priming mechanism for glycogen biogenesis. Eur. J. Biochem. 1991;200:625–631. doi: 10.1111/j.1432-1033.1991.tb16225.x. - DOI - PubMed
    1. Cid E, Geremia RA, Guinovart JJ, Ferrer JC. Glycogen synthase: towards a minimum catalytic unit? FEBS Lett. 2002;528:5–11. doi: 10.1016/S0014-5793(02)03313-6. - DOI - PubMed
    1. Thon VJ, Khalil M, Cannon JF. Isolation of human glycogen branching enzyme cDNAs by screening complementation in yeast. J. Biol. Chem. 1993;268:7509–7513. doi: 10.1016/S0021-9258(18)53204-X. - DOI - PubMed
    1. Villar-Palasi C, Larner J. A uridine coenzyme-linked pathway of glycogen synthesis in muscle. Biochim. Biophys. Acta. 1958;30:449. doi: 10.1016/0006-3002(58)90086-6. - DOI - PubMed

Publication types

LinkOut - more resources