. 2022 Aug;54(8):1103-1116.
doi: 10.1038/s41588-022-01113-z. Epub 2022 Jul 14.

Genetic regulation of OAS1 nonsense-mediated decay underlies association with COVID-19 hospitalization in patients of European and African ancestries

A Rouf Banday #  1 Megan L Stanifer #  2   3 Oscar Florez-Vargas #  1 Olusegun O Onabajo  1 Brenen W Papenberg  1 Muhammad A Zahoor  4 Lisa Mirabello  5 Timothy J Ring  1 Chia-Han Lee  1 Paul S Albert  6 Evangelos Andreakos  7 Evgeny Arons  8 Greg Barsh  9 Leslie G Biesecker  10 David L Boyle  11 Mark S Brahier  12 Andrea Burnett-Hartman  13 Mary Carrington  14   15   16 Euijin Chang  17 Pyoeng Gyun Choe  17 Rex L Chisholm  18 Leandro M Colli  19 Clifton L Dalgard  20 Carolynn M Dude  21 Jeff Edberg  22 Nathan Erdmann  23 Heather S Feigelson  13 Benedito A Fonseca  24 Gary S Firestein  11 Adam J Gehring  4   25 Cuncai Guo  26 Michelle Ho  1 Steven Holland  27 Amy A Hutchinson  28 Hogune Im  29 Les'Shon Irby  21 Michael G Ison  30 Naima T Joseph  31 Hong Bin Kim  17   32 Robert J Kreitman  8 Bruce R Korf  33 Steven M Lipkin  34 Siham M Mahgoub  35 Iman Mohammed  36 Guilherme L Paschoalini  19 Jennifer A Pacheco  18 Michael J Peluso  37 Daniel J Rader  38 David T Redden  39 Marylyn D Ritchie  38 Brooke Rosenblum  10 M Elizabeth Ross  36 Hanaisa P Sant Anna  40 Sharon A Savage  5 Sudha Sharma  41 Eleni Siouti  7 Alicia K Smith  21 Vasiliki Triantafyllia  7 Joselin M Vargas  1 Jose D Vargas  42 Anurag Verma  38 Vibha Vij  43 Duane R Wesemann  44 Meredith Yeager  28 Xu Yu  16 Yu Zhang  27 Steeve Boulant  3   26   45 Stephen J Chanock  40 Jordan J Feld  4   25 Ludmila Prokunina-Olsson  46
Affiliations

Genetic regulation of OAS1 nonsense-mediated decay underlies association with COVID-19 hospitalization in patients of European and African ancestries

A Rouf Banday et al. Nat Genet. 2022 Aug.

Abstract

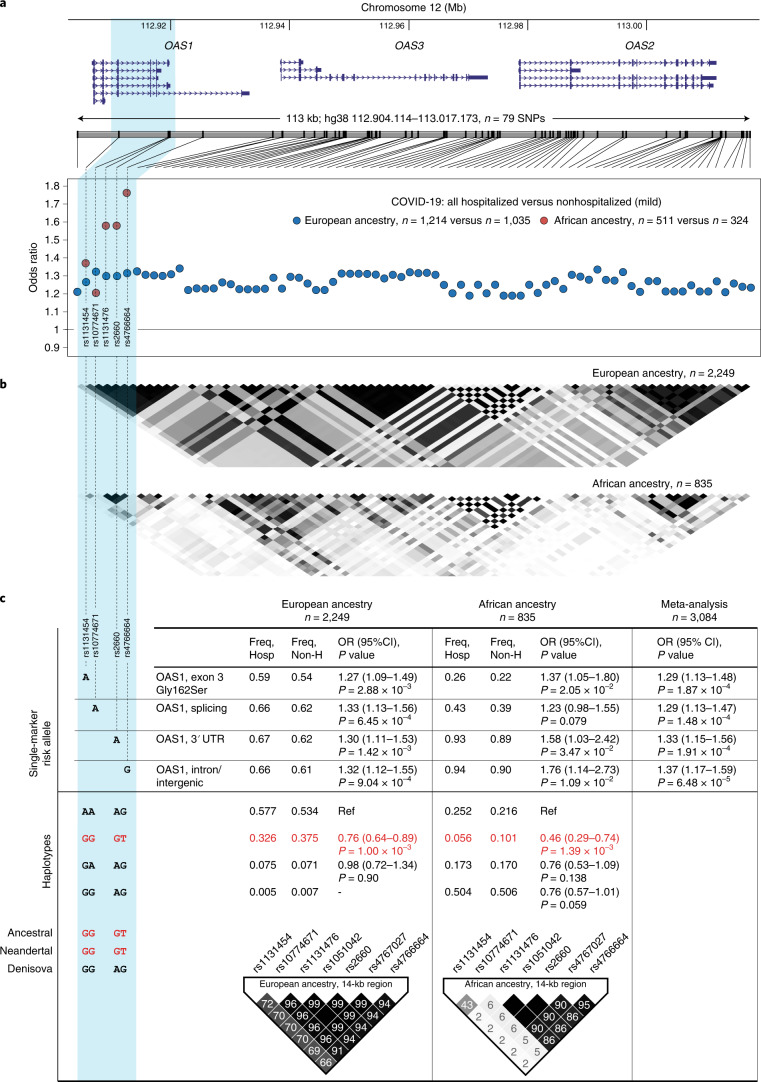
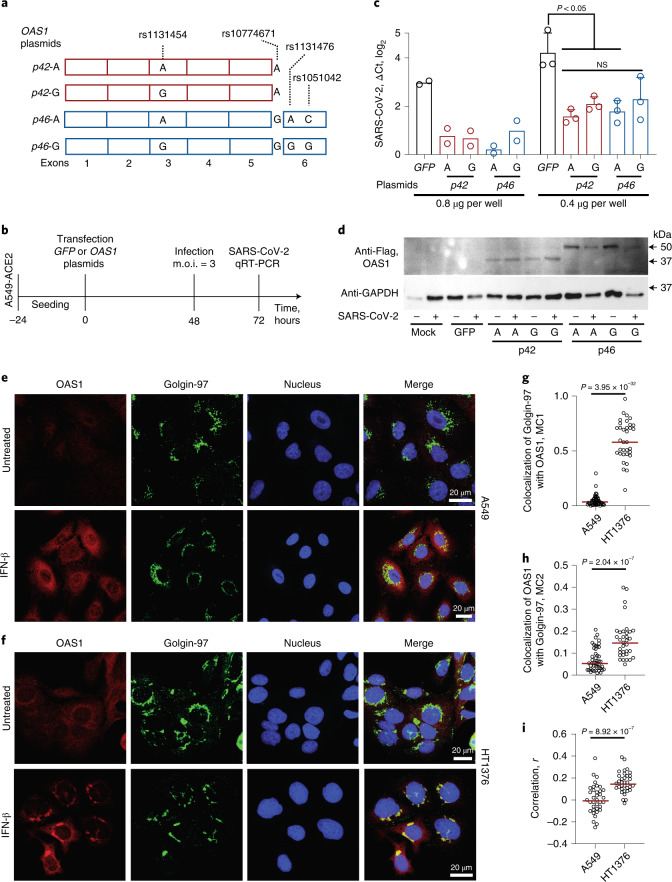
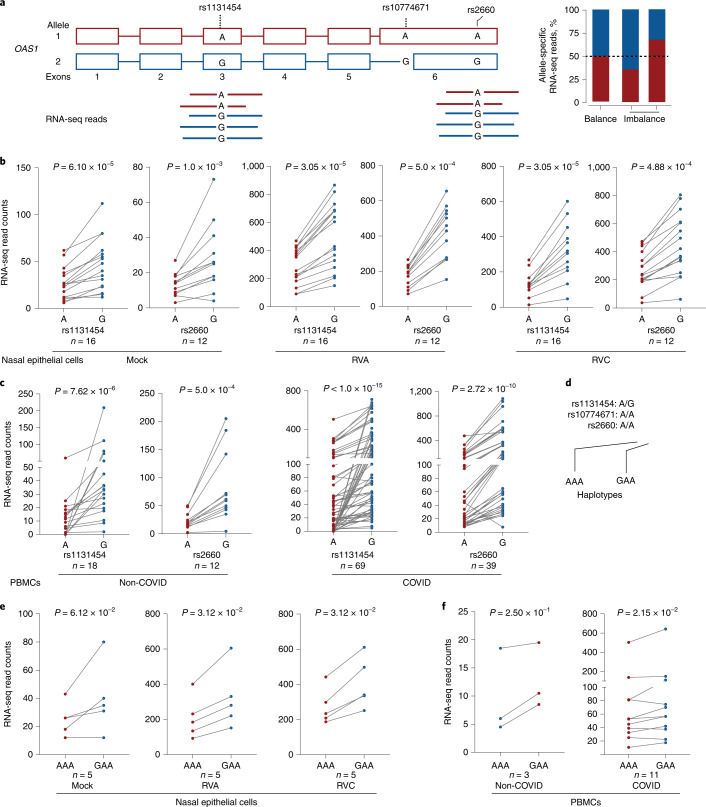
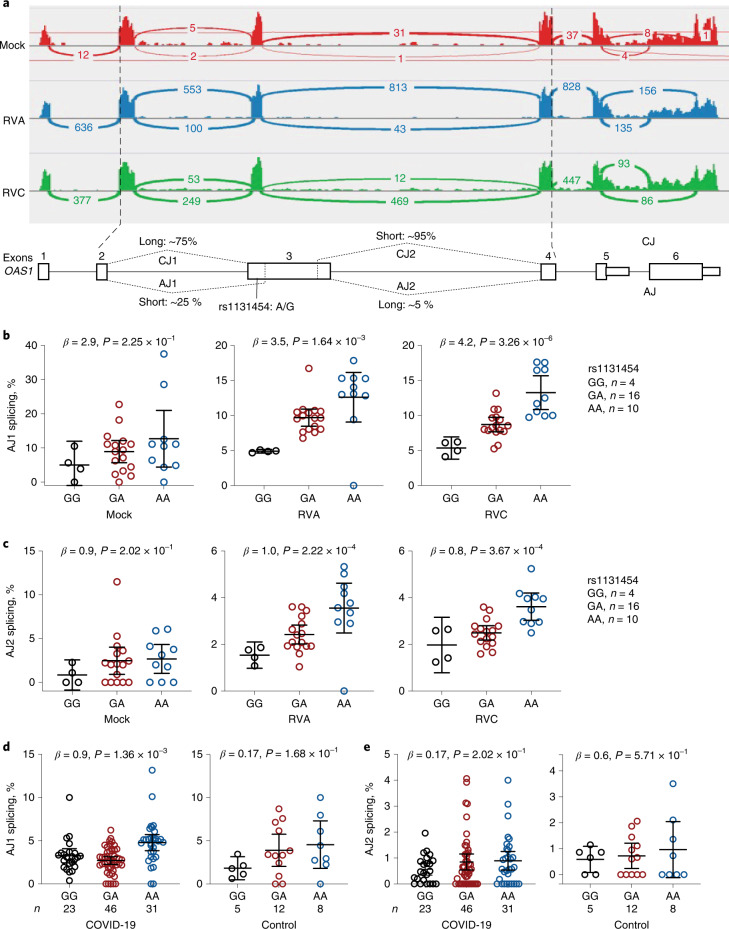
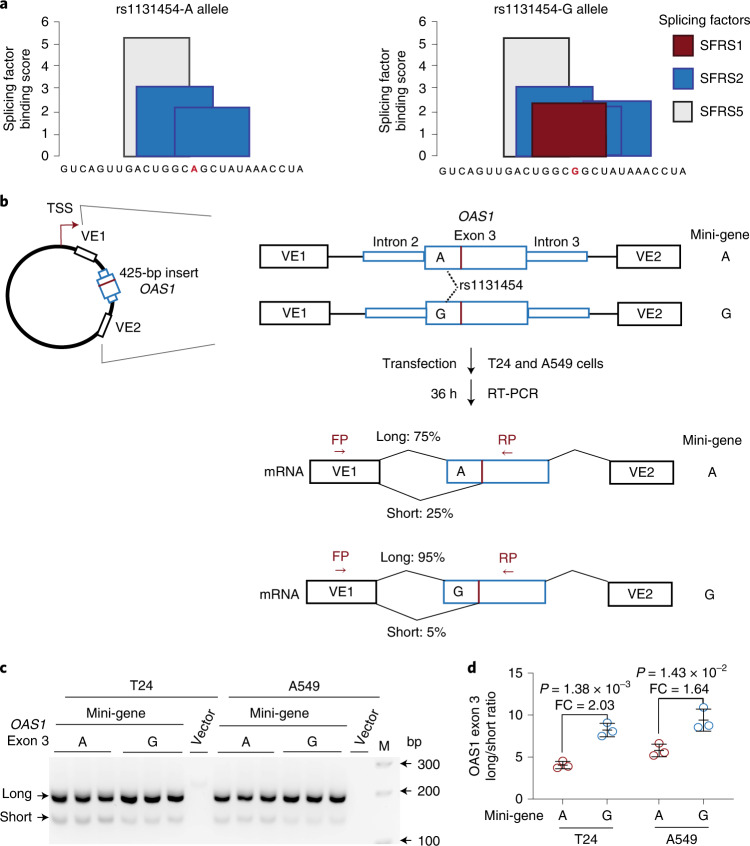
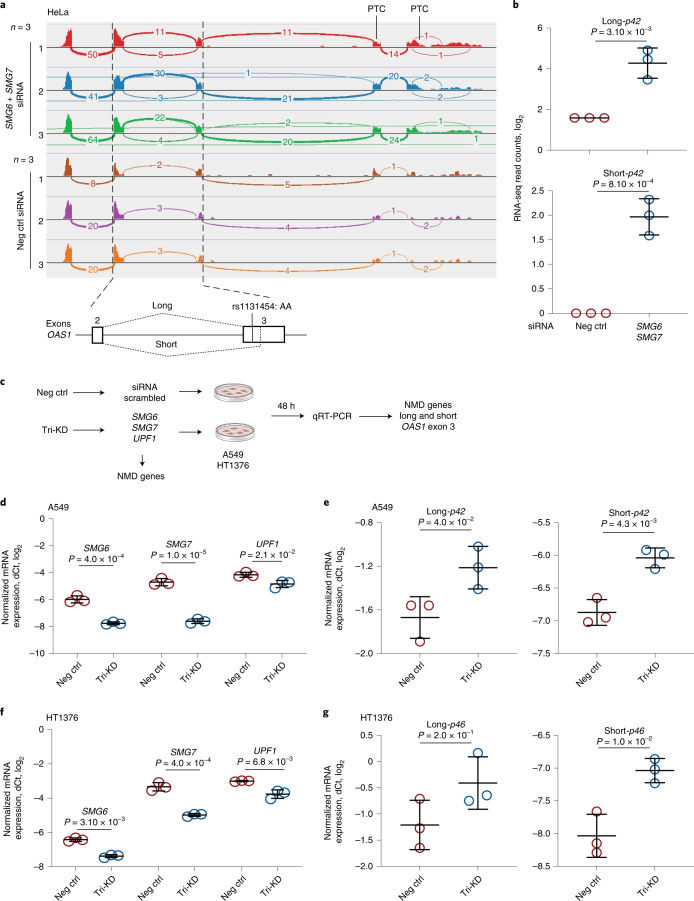
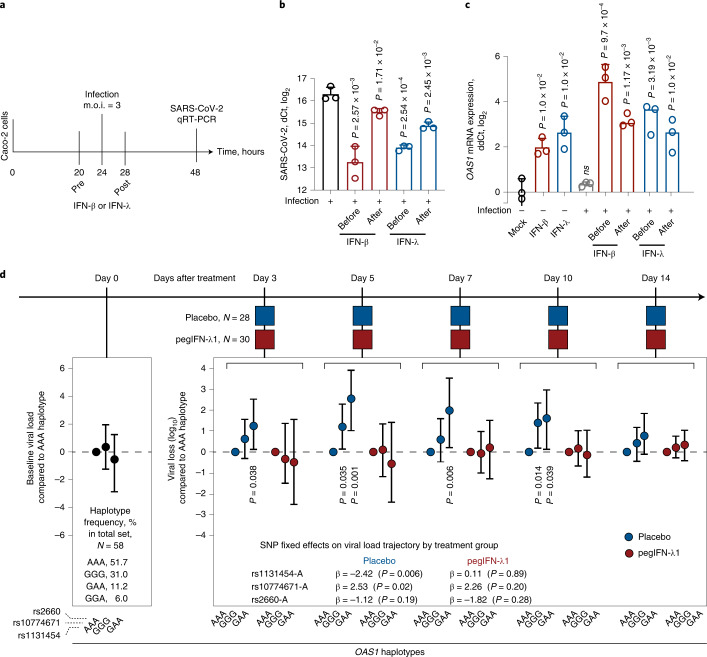
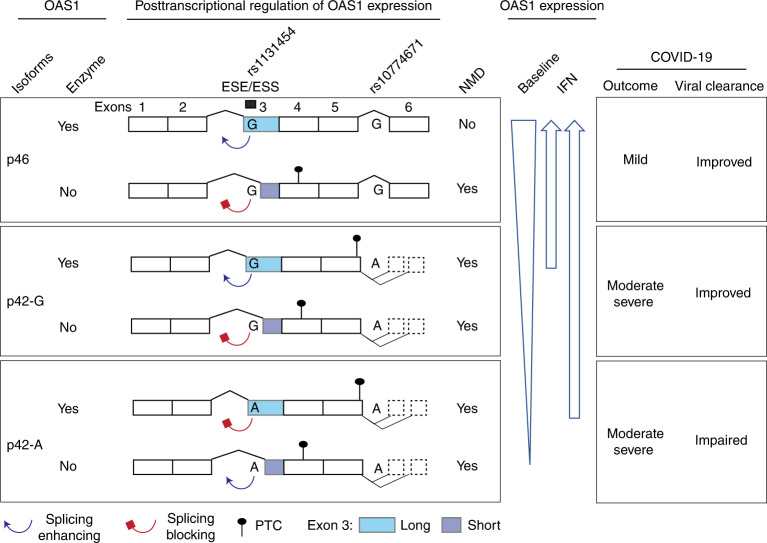
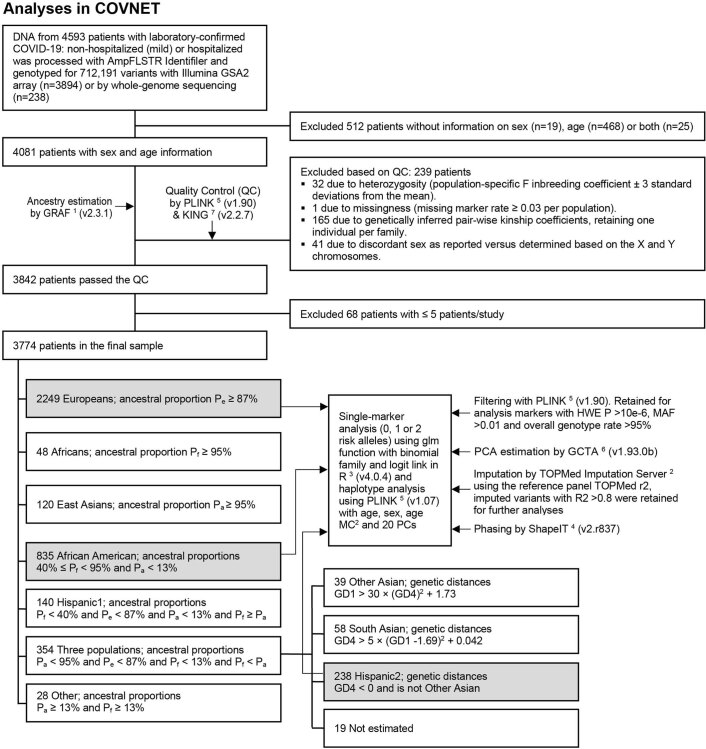
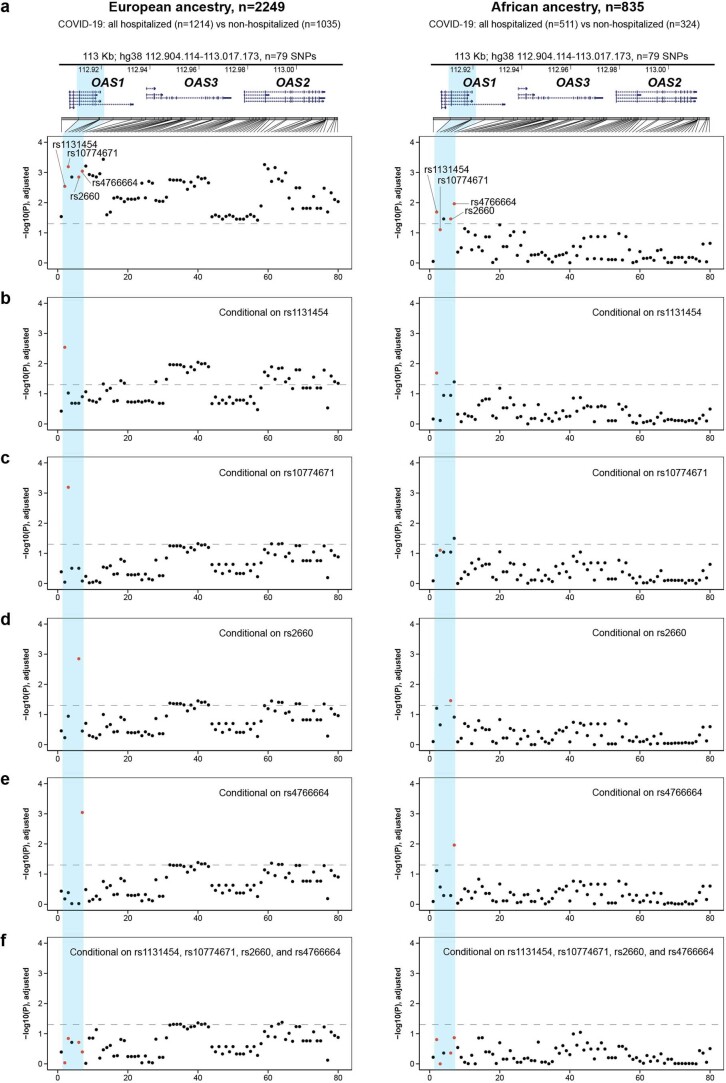
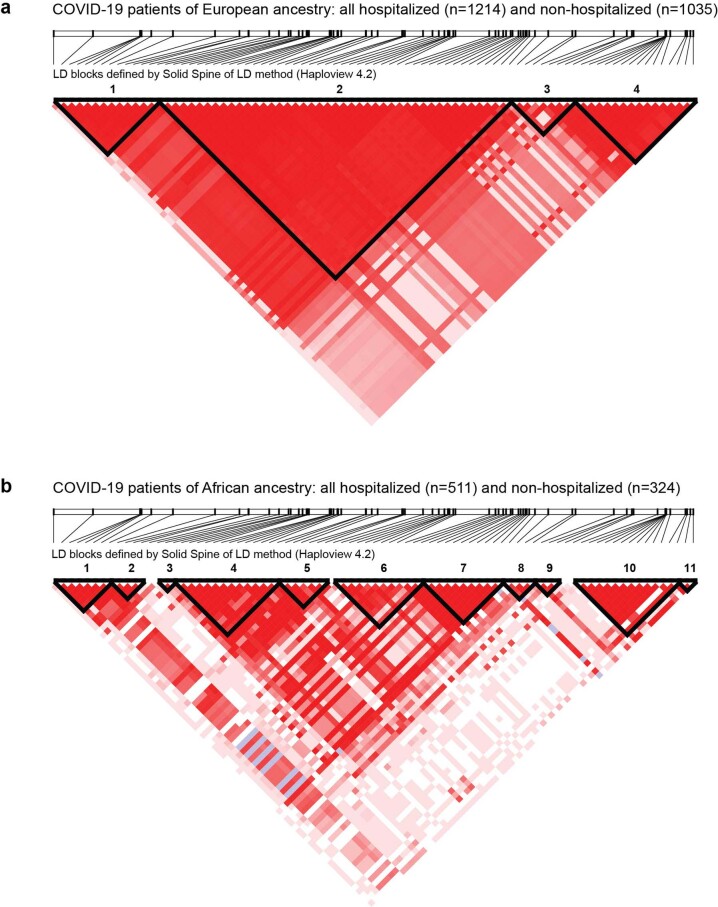
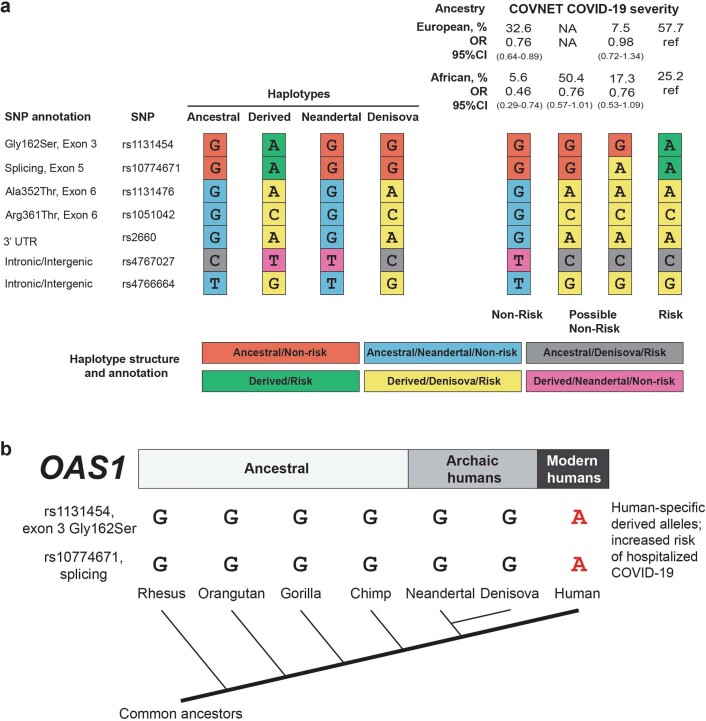
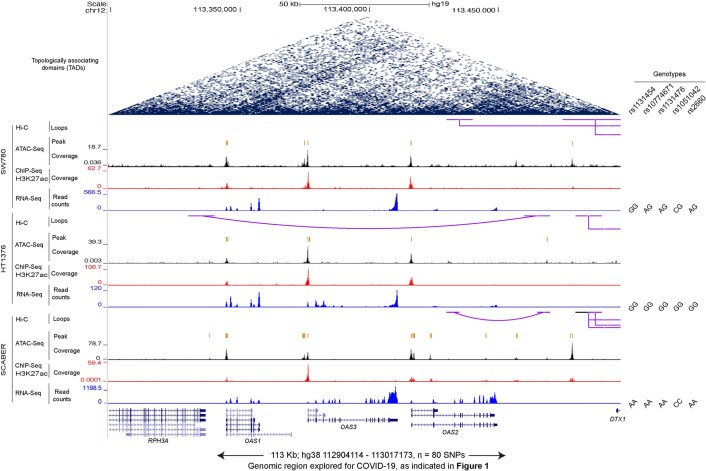
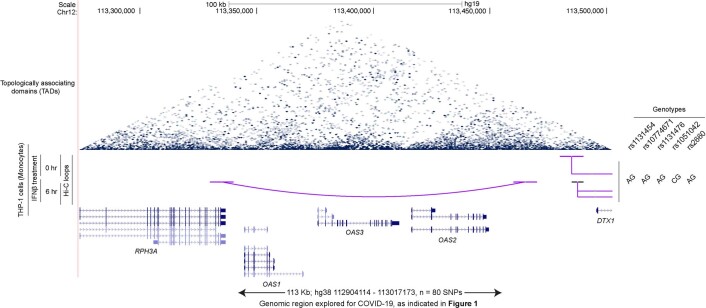
The chr12q24.13 locus encoding OAS1-OAS3 antiviral proteins has been associated with coronavirus disease 2019 (COVID-19) susceptibility. Here, we report genetic, functional and clinical insights into this locus in relation to COVID-19 severity. In our analysis of patients of European (n = 2,249) and African (n = 835) ancestries with hospitalized versus nonhospitalized COVID-19, the risk of hospitalized disease was associated with a common OAS1 haplotype, which was also associated with reduced severe acute respiratory syndrome coronavirus 2 (SARS-CoV-2) clearance in a clinical trial with pegIFN-λ1. Bioinformatic analyses and in vitro studies reveal the functional contribution of two associated OAS1 exonic variants comprising the risk haplotype. Derived human-specific alleles rs10774671-A and rs1131454 -A decrease OAS1 protein abundance through allele-specific regulation of splicing and nonsense-mediated decay (NMD). We conclude that decreased OAS1 expression due to a common haplotype contributes to COVID-19 severity. Our results provide insight into molecular mechanisms through which early treatment with interferons could accelerate SARS-CoV-2 clearance and mitigate against severe COVID-19.


Conflict of interest statement

J.J.F. reports receiving research support unrelated to this work from Eiger BioPharmaceuticals. All other authors declare no competing interests.

Figures

Fig. 1
Fig. 1. Association analyses within the chr12q24.13 region for COVID-19 hospitalization in patients of European and African ancestries.
a, Genomic region and association results (ORs) for 79 genotyped or confidently imputed (r2 > 0.8) markers associated (logistic regression, P < 0.05) with hospitalized compared to nonhospitalized (mild) COVID-19 in patients of European (blue dots) or African (red dots) ancestries. The COVID-19 susceptibility GWAS lead SNP (rs10774671) is included, although it is not significantly associated in patients of African ancestry (P = 0.079). A blue highlight indicates the OAS1 region with markers significantly associated in both ancestries. b, LD (r2) plots of the region in COVID-19 patients of European and African ancestries. Darker shading in the plots indicates stronger correlations between markers. c, Single-marker and haplotype association analyses in patients with hospitalized compared to nonhospitalized COVID-19 performed with logistic regression and omnibus haplotype tests, respectively, controlling for sex, age, squared mean-centered age and 20 principal components. The GGGT haplotype comprised of ancestral alleles of the corresponding markers is shared with the Neandertal lineage of archaic humans and is protective from hospitalized COVID-19 in COVNET patients of European and African ancestries. Regional LD plots (r2, 14-kb region) are shown for the OAS1 region associated with protection from hospitalized COVID-19. Full association results for individual variants and haplotypes are provided in Supplementary Tables 1–4.
Fig. 2
Fig. 2. Anti-SARS-CoV-2 activity and subcellular localization of OAS1-p42 and p46 isoforms.
a, Description of OAS1-p42 and OAS1-p46 plasmids with Flag-tags. b, Experimental outline: plasmids were transiently transfected in A549-ACE2 cells, followed by infection with SARS-CoV-2 and qRT-PCR for viral detection. c, SARS-CoV-2 load in A549-ACE2 cells transfected with OAS1 or GFP plasmids in six-well plates with 0.4 μg per well (n = 2, P values and error bars are not applicable) or 0.8 μg per well (n = 3, P values are for unpaired, two-sided Student’s t tests, the data are presented as means and standard deviation (s.d.)). Expression of SARS-CoV-2 was detected by qRT-PCR and normalized to the expression of an endogenous control (HPRT1). Full results are presented in Supplementary Table 5. The experiment was independently repeated three times with comparable results; the results of one experiment are presented. d, A representative western blot showing similar expression of all Flag-tagged OAS1 protein isoforms in mock and SARS-CoV-2-infected A549-ACE2 cells, with GAPDH used as a loading control. e,f, Representative confocal images for endogenous OAS1 expression in untreated and interferon β (IFN-β)-treated A549 cells (rs10774671-AA, OAS1-p42, cytosolic expression) and HT1376 (rs10774671-GG, OAS1-p46, enrichment in trans-Golgi compartment); OAS1 (red), Golgin-97 (green) and nuclei (4,6-diamidino-2-phenylindole (DAPI), blue). Scale bars, 20 µm. g, Mander’s coefficient 1 (MC1) for colocalization of Golgin-97 with OAS1 in confocal images. h, Mander’s coefficient 2 (MC2) for colocalization of OAS1 with Golgin-97 in confocal images. i, Overall correlation (Pearson’s r) between colocalization of Golgin-97 and OAS1 expression in confocal images. The results presented as individual points and group means are based on data collected from 5-7 fields of view from one of two comparable independent experiments. P values are for nonparametric, two-sided Mann–Whitney U tests. The full western blot is provided as Source Data. Source data
Fig. 3
Fig. 3. Allelic expression imbalance of OAS1 transcripts.
a, Analysis of allelic expression imbalance for transcribed OAS1 variants based on RNA-seq reads. b,c, Counts of allele-specific RNA-seq reads in heterozygous samples for transcribed OAS1 variants rs1131454 and rs2660 in nasal epithelial cells uninfected (Mock) and infected with rhinovirus (RV) strains A or C (RVA or RVC) (b) or in PBMCs from patients with COVID-19 and healthy controls (labeled as non-COVID) (c). d, Haplotypes of the three OAS1 variants used for analysis. e, Haplotype-specific imbalance in OAS1 expression contributed by rs1131454. All P values are for nonparametric, Wilcoxon matched-pairs two-sided signed-rank tests.
Fig. 4
Fig. 4. Splicing of OAS1 exon 3 is associated with rs1131454 alleles.
a, RNA-seq plots showing splicing patterns of OAS1 exons in representative samples from nasal epithelial cells uninfected (Mock) and rhinovirus (RV)-infected with strains A or C (RVA or RVC). OAS1 exon 3 shows alternative splicing at both 5’ acceptor and 3’ donor splice sites, resulting in four splicing junctions: two canonical junctions (CJ) and two alternative junctions (AJ) producing long and short versions of exon 3. Exon junctions AJ1 (major) and AJ2 (minor) account for approximately 25% and 5% of total RNA-seq reads, respectively. be, Splice quantitative trait locus (sQTL) analysis of AJ1 and AJ2 with rs1131454 in nasal epithelial cells uninfected (Mock) or infected with RVA or RVC (b,c) and in PBMCs from COVID-19 patients and healthy controls (labeled as non-COVID) (d,e). For b–e, P values are for linear regressions, adjusting for sex and age. All graphs show individual data points with means and 95% confidence intervals (CIs).
Fig. 5
Fig. 5. Exontrap assays demonstrate the functional effect of rs1131454 on OAS1 exon 3 splicing.
a, In silico prediction of allele-specific splicing factor binding sites within OAS1 exon 3. Only rs1131454-G allele creates a binding site for SFRS1 splicing factor; binding sites for SFRS2 are created by both alleles, with three or two sites created in the presence of non-risk G or risk A alleles, respectively. b, Experimental outline: description of allele-specific mini-genes with OAS1 exon 3 inserts, transfection in T24 and A549 cells, and splicing ratios of amplicons detected by RT-PCR with FP and RP primers. c, Representative agarose gel showing splicing events of mini-genes detected by RT-PCR in T24 and A549 cells. Vector corresponds to negative control, and M corresponds to 100-bp size marker. Upper and lower bands correspond to long and short exon 3 splicing events with vector exon 1 (VE1). No alternative splicing events were identified between exon 3 insert and VE2. Each mini-gene was analyzed in three biological replicates, and the results of one of two independent experiments are shown. d, The ratios of long/short OAS1 exon 3 expression quantified by densitometry of agarose gel bands. Splicing of long exon 3 is significantly higher from the mini-gene with non-risk rs1131454-G allele compared to the mini-gene with risk rs1131454-A allele. Fold changes (FC) were calculated from the splicing ratios. The dot plots are presented with means and s.d.; P values are for unpaired, two-sided Student’s t tests. The full agarose gel is provided as Source Data. Source data
Fig. 6
Fig. 6. NMD targets OAS1 isoforms with short exon 3 upregulated by the risk rs1131454-A allele.
a, RNA-seq plots showing OAS1 expression and splicing patterns in HeLa cells (rs10774671-AA, OAS1-p42) targeted by siRNA KD of NMD-pathway genes SMG6 and SMG7 or by scrambled siRNA (Neg Ctrl). b, Expression of both long and short OAS1-p42 isoforms is increased in HeLa cells with siRNA KD of NMD genes. c, Schematics for characterizing effects of KD of NMD genes on the expression of long and short exon 3 in the context of OAS1-p42 (in A549) and OAS1-p46 (in HT1376). d,e, Downregulation of NMD-pathway genes (SMG6, SMG7 and UPF1) targeted by siRNA KD in A549 cells. Expression of both long and short exon 3 OAS1-p42 isoforms is increased in cells with siRNA KD of NMD genes. Tri-KD, triple KD. f,g, Downregulation of NMD-pathway genes (SMG6, SMG7 and UPF1) targeted by siRNA-KD in HT1376 cells. Only expression of short-exon 3 OAS1-p46 isoform is increased by siRNA-KD of NMD genes. Expression in three biological replicates was analyzed by qRT-PCR and normalized to an endogenous control (HPRT1). The dot plots are presented with means and s.d.; P values are for unpaired, two-sided Student’s t tests.
Fig. 7
Fig. 7. Effects of interferons on SARS-CoV-2 viral loads in vitro and a clinical trial.
a, Outline of an experiment in Caco2 cell line. Cells were infected with SARS-CoV-2 and treated with IFN-β or IFN-λ 4 h before or after infection, and SARS-CoV-2 and OAS1 expression was measured by qRT-PCR 24 h after infection. b,c, Expression of SARS-CoV-2 (b) and OAS1 (c) normalized by the expression of endogenous control (HPRT1). P values are for comparison with infection alone or Mock, with three biological replicates for each condition. The dot plots are presented with means and s.d.; P values are for unpaired, two-sided Student’s t tests. d, Outline of the clinical trial: a single subcutaneous injection of 180 μg pegIFN-λ1 (n = 30) or saline placebo (n = 28) was administered at day 0, and longitudinal trajectory of SARS-CoV-2 load (log10 copies per ml of blood) was evaluated at indicated days compared to day 0 using linear mixed-effect models. The analysis included genotypes of OAS1 variants rs1131454, rs10774671 and rs2660 used in haplotype analyses of COVID-19 severity. The model that included genotypes of these variants in interaction with treatment arms showed significantly better fit (two-way ANOVA P = 0.02; likelihood ratio test degrees of freedom (d.f.) = 3) compared to the base model, justifying analysis stratified by treatment arms. In the placebo group, the rs1131454-A risk allele was most significantly associated with less efficient viral loss (P = 0.006). Results are also presented as a post-hoc analysis for indicated haplotypes as viral loss (log10) at specific days compared to day 0, using the risk AAA haplotype as a reference. The results are presented as point estimates (β, with 95% CI); P values are for omnibus haplotype test, adjusting for sex, age and viral load at day 0. Haplotypes are not associated with viral load at day 0. Full results are presented in Supplementary Tables 6–10.
Fig. 8
Fig. 8. Proposed model for mechanisms underlying association between OAS1 genetic variants and COVID-19 outcomes.
Two OAS1 variants, the splice site variant (rs10774671-A/G) and exon 3 missense variant (rs1131454-A/G, Gly162Ser), determine the structure and expression levels of OAS1 isoforms. Alleles of the splicing variant rs10774671 define the OAS1 isoforms OAS1-p42 (A allele) and OAS1-p46 (G allele). Alleles of rs1131454 create an ESE/ESS for splicing of the canonical/long versus alternative/short exon 3. Transcripts with short exon 3 are terminated by PTCs within exon 4 and efficiently targeted by NMD. The stop codon for OAS1-p42 is located within exon 5, followed by several additional exons creating OAS1-p44 and OAS1-p48 isoforms, making this stop codon a PTC. Thus, OAS1-p42 is also targeted by NMD, albeit less efficiently than transcripts with PTCs in exon 4. The combined splicing effects of rs10774671, which creates alternative OAS1 isoforms, and rs1131454, which regulates the inclusion of short or long exon 3 and thus the introduction of additional PTCs, result in variable degradation of OAS1 transcripts by NMD. At baseline, the expression is highest for OAS1-p46 and the lowest for OAS1-p42-A. However, treatment with interferons may compensate for NMD, allowing OAS1-p42 protein to reach expression levels comparable to OAS1-p46. Thus, the effects of genetic variants on OAS1 expression can be compensated by IFN treatment to overcome impaired viral clearance and prevent progression to severe COVID-19 requiring hospitalization.
Extended Data Fig. 1
Extended Data Fig. 1. Outline of genetic analyses in COVNET.
COVNET: Large-scale Genome-wide Association Study and Whole Genome Sequencing of COVID-19 Severity (https://dceg.cancer.gov/research/how-we-study/genomic-studies/covnet). Analyses were done in sets shaded in gray, which have more than 100 patients per ancestry and outcome group (hospitalized versus nonhospitalized); this included patients of European (n = 2,249: 1,214 versus 1,035) and African (n = 835: 511 versus 324) ancestries. For rs10774671 and rs1131454, genotyped data based on TaqMan assays were used for all non-European patients and a subset of European patients (see Methods).
Extended Data Fig. 2
Extended Data Fig. 2. Quantile-Quantile plots and genomic inflation factors (λ) for COVNET GWAS analyses of COVID-19 severity.
a,b, The analyses are based on 511,229 genome-wide array-genotyped markers in hospitalized versus nonhospitalized COVID-19 patients of European ancestry (n = 2,249: 1,214 versus 1,035) (a) and African ancestry (n = 835: 511 versus 324) (b). P-values are for two-sided Fisher’s exact test adjusting for age, sex, squared mean-centered age, and 20 PCs.
Extended Data Fig. 3
Extended Data Fig. 3. Conditional association analyses for COVID-19 severity within the chr12q24.13 region in COVNET patients of European and African ancestries.
a, Genomic region and association results (P-values) for 79 genotyped or confidently imputed markers for hospitalized compared to nonhospitalized COVID-19 in patients of European and African ancestries. Presented results are for logistic regression analyses conditioning on markers indicated by red dots. b, rs1131454. c, rs10774671. d, rs2660. e, rs4766664. f, rs1131454, rs10774671, rs2660, and rs4766664 combined. The horizontal dotted line represents the P = 0.05 significance threshold. All association analyses were performed using logistic regression models, adjusting for sex, age, squared mean-centered age, and 20 PCs. Full conditional association results for individual variants are provided in Supplementary Table 2.
Extended Data Fig. 4
Extended Data Fig. 4. Linkage disequilibrium blocks within the chr12q24.13 region in COVNET patients of European and African ancestries.
a,b, Analysis of the 113-kb region (hg38:112,904,114-113,017,173, n = 79 SNPs) at chr12q24.13 with Solid Spine method (Haploview version 4.2) identified 4 linkage disequilibrium (LD, D’) blocks in COVNET COVID-19 patients of European ancestry (a) and 11 LD blocks in patients of African ancestry (b). Dark red shading denotes D’ > 0.80.
Extended Data Fig. 5
Extended Data Fig. 5. Structure of OAS1 haplotypes in relation to ancestral status and association with COVID-19 severity.
a, Analysis of the OAS1 haplotypes (14.13 kb, hg38:112,911,065-112,925,192) comprised of 7 markers. The color-coding indicates the ancestral status of specific alleles – human (ancestral or derived), archaic humans (Neandertal or Denisova lineages), and COVID-19 severity status (Non-risk/Risk). Haplotype frequencies are shown for hospitalized patients with COVID-19 of European and African ancestry from COVNET. NA, haplotype is not detected. Odds ratios (ORs) and 95% confidence intervals (95%CIs) are for comparison with the common Risk haplotype (also marked as ref); full results can be found in Supplementary Table 4. The Non-risk haplotypes differ from the Risk haplotype by the alleles of rs1131454 and rs10774671. The COVID-19 risk is associated with human-specific derived alleles rs1131454-A and rs10774671-A. Additionally, the Risk haplotype includes a Denisova-type fragment of derived alleles spanning rs1131476 to rs4766664. Human polymorphisms rs1131454, rs1131476, rs1051042, and rs2660 were also explored and found monomorphic in genomic sequences of 29 chimpanzees: Pan troglodytes verus (n = 24) and Pan troglodytes troglodytes (n = 5). Source: European Nucleotide Archive https://www.ebi.ac.uk, accession numbers FM163403.1FM163432.1. b, OAS1 haplotypes and phylogenetic tree. COVID-19 risk alleles rs1131454-A and rs10774671-A are human-specific and derived.
Extended Data Fig. 6
Extended Data Fig. 6. Allele-specific OAS1 plasmids show similar effects on cell growth.
A549 cells were untransfected or transiently transfected in four biological replicates with plasmids: GFP, OAS1-p42-A, OAS1-p42-G, OAS1-p46-A, or OAS1-p46-G (see Fig. 2a for plasmid details). Cells were counted by automated live-cell imaging using Lionheart microscopy right after transfection (0 h) and then every 24 h for 96 h. The plots are presented with means and s.d. P-value is for comparison between all plasmids using one-way ANOVA with Tukey’s multiple comparison test. NS, not significant.
Extended Data Fig. 7
Extended Data Fig. 7. Mean expression levels of OAS1 isoforms in tumor-adjacent normal tissues in TCGA.
Expression of OAS1 isoforms was analyzed in RNA-seq data in The Cancer Genome Atlas (TCGA), using tumor-adjacent normal tissues with RNA-seq data in ≥15 samples. RNA-seq reads for each OAS1 isoform were calculated based on unique splice junctions (OAS1-p44, p46, and p48) or unique 3’UTR (p42). For normalization, the total counts of RNA-seq reads for exon–exon junctions for p44, p46 and p48 were divided by 50 (length of an RNA-seq read), and unique RNA-seq reads for p42 exon 5 by its length (317 bp). The mean expression levels of each isoform were calculated from all the samples with ≥3 RNA-seq reads. Overall, the mean expression of OAS1-p46 is higher than OAS1-p42, with an average fold change (FC) of 3.9 across tissues.
Extended Data Fig. 8
Extended Data Fig. 8. Mean expression levels of OAS1 isoforms in nasal epithelial cells, pulmonary alveolar cells and PBMCs.
a-c, Expression of OAS1 isoforms was analyzed in RNA-seq data of nasal epithelial cells (SRA: PRJNA627860) (a), organoids of pulmonary alveolar type 1 cells (SRA: PRJNA673197) (b), and PBMCs (SRA: PRJNA660067) (c). The bar graphs show the mean expression levels of each OAS1 isoform normalized as described in Extended Data Figure 7. The expression of OAS1-p46 is higher than OAS1-p42 in all cell types and conditions tested.
Extended Data Fig. 9
Extended Data Fig. 9. Multi-omics profile of the OAS1-OAS3-OAS2 genomic region.
Multi-omics data for genome-wide Hi-C, ATAC-seq, H3K27ac ChIP-seq, and RNA-seq of three bladder cancer cell lines (SRA: PRJNA623018) were analyzed and visualized using UCSC genome browser. OAS1, OAS2, and OAS3 expression was observed in all samples, but there is no evidence of open chromatin, enhancer activity, or chromatin interactions within the region that includes 79 variants associated with hospitalized versus nonhospitalized COVNET COVID-19 in patients of European ancestry (Fig. 1).
Extended Data Fig. 10
Extended Data Fig. 10. Hi-C chromatin interaction analysis in the OAS1-OAS3-OAS2 genomic region.
Chromatin interaction (Hi-C) data for the THP-1 monocytic cell line untreated and treated with IFNβ for 6 h (SRA: PRJNA401748) were analyzed and visualized using UCSC genome browser. No chromatin interactions were detected with the region that includes 79 variants associated with hospitalized versus nonhospitalized COVNET COVID-19 in patients of European ancestry (Fig. 1).

Update of

  • Genetic regulation of OAS1 nonsense-mediated decay underlies association with risk of severe COVID-19.
    Banday AR, Stanifer ML, Florez-Vargas O, Onabajo OO, Zahoor MA, Papenberg BW, Ring TJ, Lee CH, Andreakos E, Arons E, Barsh G, Biesecker LG, Boyle DL, Burnett-Hartman A, Carrington M, Chang E, Choe PG, Chrisholm RL, Dalgard C, Edberg J, Erdmann N, Feigelson HS, Firestein GS, Gehring AJ, Ho M, Holland S, Hutchinson AA, Im H, Ison MG, Kim HB, Kreitman RJ, Korf BR, Mirabello L, Pacheco JA, Peluso MJ, Rader DJ, Redden DT, Ritchie MD, Rosenbloom B, Sant Anna HP, Savage S, Siouti E, Triantafyllia V, Vargas JM, Verma A, Vij V, Wesemann DR, Yeager M, Yu X, Zhang Y, Boulant S, Chanock SJ, Feld JJ, Prokunina-Olsson L. Banday AR, et al. medRxiv [Preprint]. 2021 Jul 13:2021.07.09.21260221. doi: 10.1101/2021.07.09.21260221. medRxiv. 2021. Update in: Nat Genet. 2022 Aug;54(8):1103-1116. doi: 10.1038/s41588-022-01113-z. PMID: 34282422 Free PMC article. Updated. Preprint.

References

    1. Pairo-Castineira E, et al. Genetic mechanisms of critical illness in Covid-19. Nature. 2020;591:92–98. doi: 10.1038/s41586-020-03065-y. - DOI - PubMed
    1. COVID-19 Host Genetics Initiative. Mapping the human genetic architecture of COVID-19. Nature. 2021;600:472–477. doi: 10.1038/s41586-021-03767-x. - DOI - PMC - PubMed
    1. Sadler AJ, Williams BR. Interferon-inducible antiviral effectors. Nat. Rev. Immunol. 2008;8:559–568. doi: 10.1038/nri2314. - DOI - PMC - PubMed
    1. Kerr IM, Brown RE, Hovanessian AG. Nature of inhibitor of cell-free protein synthesis formed in response to interferon and double-stranded RNA. Nature. 1977;268:540–542. doi: 10.1038/268540a0. - DOI - PubMed
    1. Duggal P, Gillanders EM, Holmes TN, Bailey-Wilson JE. Establishing an adjusted p-value threshold to control the family-wide type 1 error in genome wide association studies. BMC Genomics. 2008;9:516. doi: 10.1186/1471-2164-9-516. - DOI - PMC - PubMed

Publication types

Substances