. 2022 Jul 14;12(1):12063.
doi: 10.1038/s41598-022-16186-3.

Border tissue morphology is associated with the pattern of visual field progression in open-angle glaucoma

Affiliations

Border tissue morphology is associated with the pattern of visual field progression in open-angle glaucoma

Hyun Joo Kee et al. Sci Rep. .

Abstract

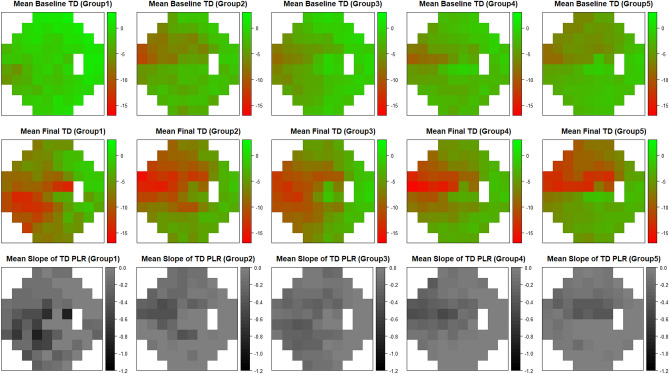
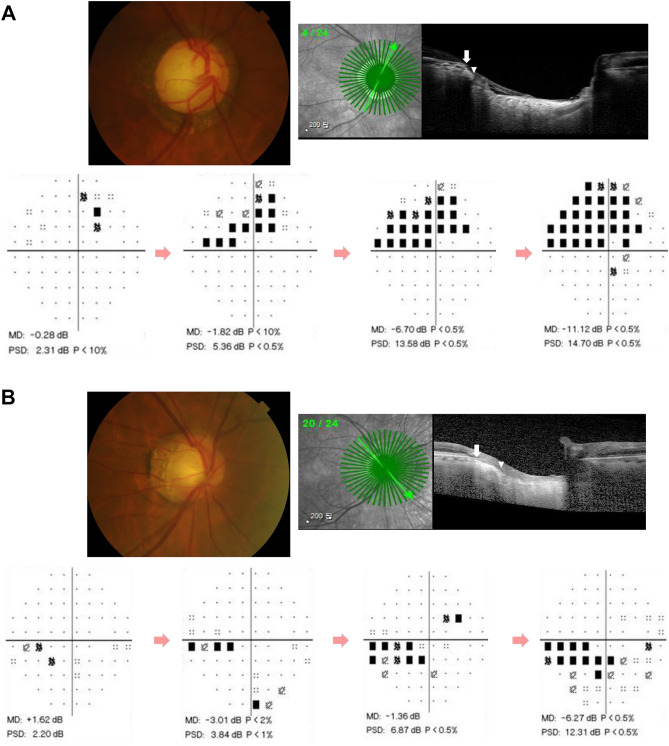
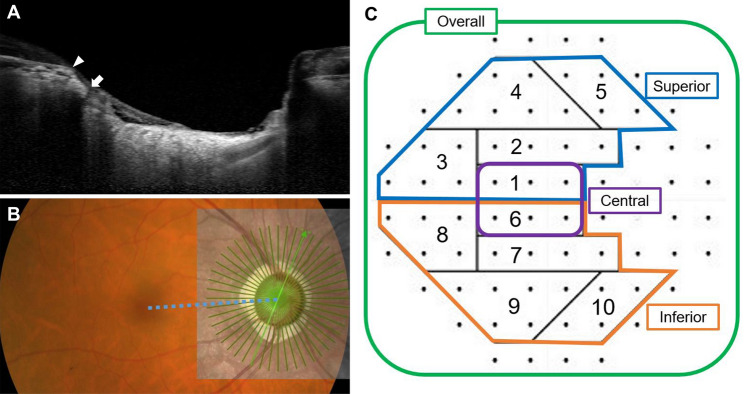
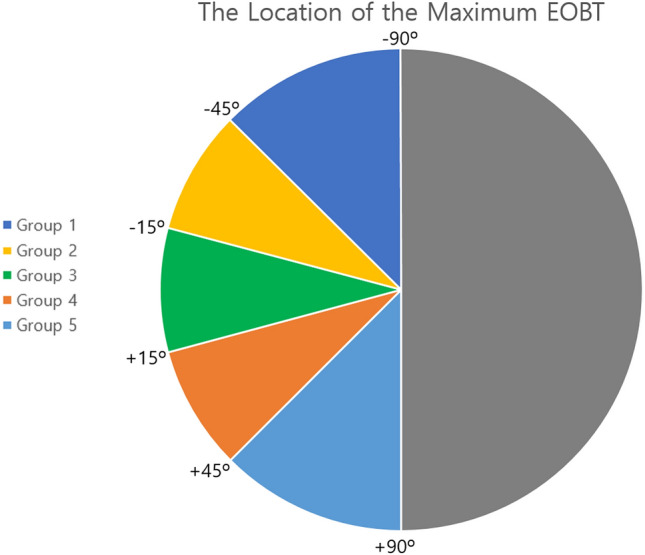
The etiology of open-angle glaucoma (OAG) is yet unclear. This study investigated possible risk factors, such as the morphology of the border tissue that affect the pattern of visual field (VF) progression in eyes with OAG. 166 eyes of 166 OAG patients with an externally oblique border tissue (EOBT) at least in one direction were included. EOBT was obtained by analyzing enhanced depth imaging spectral-domain optical coherence tomography images. A pointwise linear regression was used to determine VF progression by measuring the deterioration rate of each point in the VF. The odds ratio of VF progression for each risk factor was estimated using logistic regression analysis. Seventy (42.2%) eyes showed VF deterioration. In multivariate analysis, longer follow-up period, higher baseline intraocular pressure (IOP), lower mean ocular perfusion pressure (MOPP), and smaller angular location of the longest EOBT were associated with VF progression (all p values were below 0.05). In the multivariate analysis, the location of the longest EOBT was significantly associated with inferior (p = 0.002) and central (p = 0.017) VF progression. In conclusion, VF progression pattern in OAG eyes is associated with the location of the longest EOBT as well as other known risk factors.


Conflict of interest statement

The authors declare no competing interests.

Figures

Figure 1
Figure 1
Relationship between the location of the maximum externally oblique border tissue (EOBT) and visual field (VF) progression. Columns show the five groups classified by location of the maximum EOBT. The first and second rows compare the mean total deviation plots (dB) at first and last visit, and the gray scale plot on the bottom row indicates the average slope of the total deviation plot at each point (dB/year). Progression rates are shown in grayscale in the bottom row; the lightest sectors showed the slowest progression while the darkest sectors showed the fastest progression. At the first visit, most of the groups showed VF defect at the superior hemifield except group 1, and at the last visit, the pattern of VF defect seems to be more obvious according to the location of the maximum EOBT. VF progression was dominantly in the inferior hemifield in group 1, whereas it was dominantly in the superior hemifield in group 5. TD = total deviation, PLR = point-wise linear regression.
Figure 2
Figure 2
Representative cases showing the relationship between the direction of the maximum externally oblique border tissue (EOBT) and the location of glaucomatous damage. (A) Images from a 79-year-old man with primary open-angle glaucoma (spherical equivalent, – 0.75 diopters [D]; axial length, 23.03 mm). The location of the maximum EOBT was + 30°. Mean deviations (MD) on static automated perimetry C30-2 were – 6.30 decibels (dB) on the first exam in 2001 and – 11.12 dB with superior visual field progression on the last exam in 2018. (B) Images from a 60-year-old man with NTG with myopia (spherical equivalent, – 3.75 D; axial length, 25.97 mm). MDs were + 1.62 dB on the first exam in 2006 and – 6.27 dB with inferior visual field progression on the last exam in 2017. The location of the maximum EOBT was – 37.5°.
Figure 3
Figure 3
Methods for measuring the length and angular location of the longest externally oblique border tissue (EOBT) and classification of visual field test points. (A) Cross-sectional image of the optic nerve head. EOBT length was measured as the distance between Bruch’s membrane opening (BMO) (arrowhead) and the inner end of the border tissue (arrow). (B) Enhanced depth imaging optical coherence tomography (EDI-OCT) scan was obtained using 48 radial line B-scans (each at an angle of 3.75°). The OCT image was superimposed on the fundus photo of the same eye. The angular location of the maximum EOBT was defined as the angle between the fovea-BMO axis (dotted blue line) and the reference line (light green line with an arrowhead) obtained while measuring the maximum EOBT length. (C) Ten visual field sectors based on anatomical relationships between visual field test points in the Humphrey 30–2 test and location of retinal nerve fiber layer bundles. Sectors 1 and 6 were regarded as the central zone. Five upper sectors—sectors 1 to 5—and five lower sectors—sectors 6 to 10—were regarded as the superior zone and inferior zone, respectively.
Figure 4
Figure 4
Classification for subgroup analysis according to the angular location of the longest externally oblique border tissue (EOBT). Since this figure shows the angular location with respect to the right eye, in the case of the left eye, the angular location was indicated by flipping it horizontally. Group 1: < – 45°, Group 2: – 45° ~ – 15°, Group 3: – 15° ~  + 15°, Group 4: + 15° ~  + 45°, Group 5: >  + 45°.

Similar articles

References

    1. Kwon YH, Fingert JH, Kuehn MH, Alward WL. Primary open-angle glaucoma. N. Engl. J. Med. 2009;360:1113–1124. doi: 10.1056/NEJMra0804630. - DOI - PMC - PubMed
    1. Ramulu PY, West SK, Munoz B, Jampel HD, Friedman DS. Driving cessation and driving limitation in glaucoma: the Salisbury Eye Evaluation Project. Ophthalmology. 2009;116:1846–1853. doi: 10.1016/j.ophtha.2009.03.033. - DOI - PMC - PubMed
    1. Ramulu PY, West SK, Munoz B, Jampel HD, Friedman DS. Glaucoma and reading speed: the Salisbury Eye Evaluation project. Arch. Ophthalmol. 2009;127:82–87. doi: 10.1001/archophthalmol.2008.523. - DOI - PMC - PubMed
    1. Hu S, Smith ND, Saunders LJ, Crabb DP. Patterns of binocular visual field loss derived from large-scale patient data from glaucoma clinics. Ophthalmology. 2015;122:2399–2406. doi: 10.1016/j.ophtha.2015.08.005. - DOI - PubMed
    1. Cheng HC, et al. Patient-reported vision-related quality of life differences between superior and inferior hemifield visual field defects in primary open-angle glaucoma. JAMA Ophthalmol. 2015;133:269–275. doi: 10.1001/jamaophthalmol.2014.4908. - DOI - PubMed

Publication types

MeSH terms