. 2022 Nov;6(11):1298-1316.
doi: 10.1038/s41551-022-00909-y. Epub 2022 Jul 14.

Mapping and targeted viral activation of pancreatic nerves in mice reveal their roles in the regulation of glucose metabolism

Affiliations

Mapping and targeted viral activation of pancreatic nerves in mice reveal their roles in the regulation of glucose metabolism

M Jimenez-Gonzalez et al. Nat Biomed Eng. 2022 Nov.

Abstract

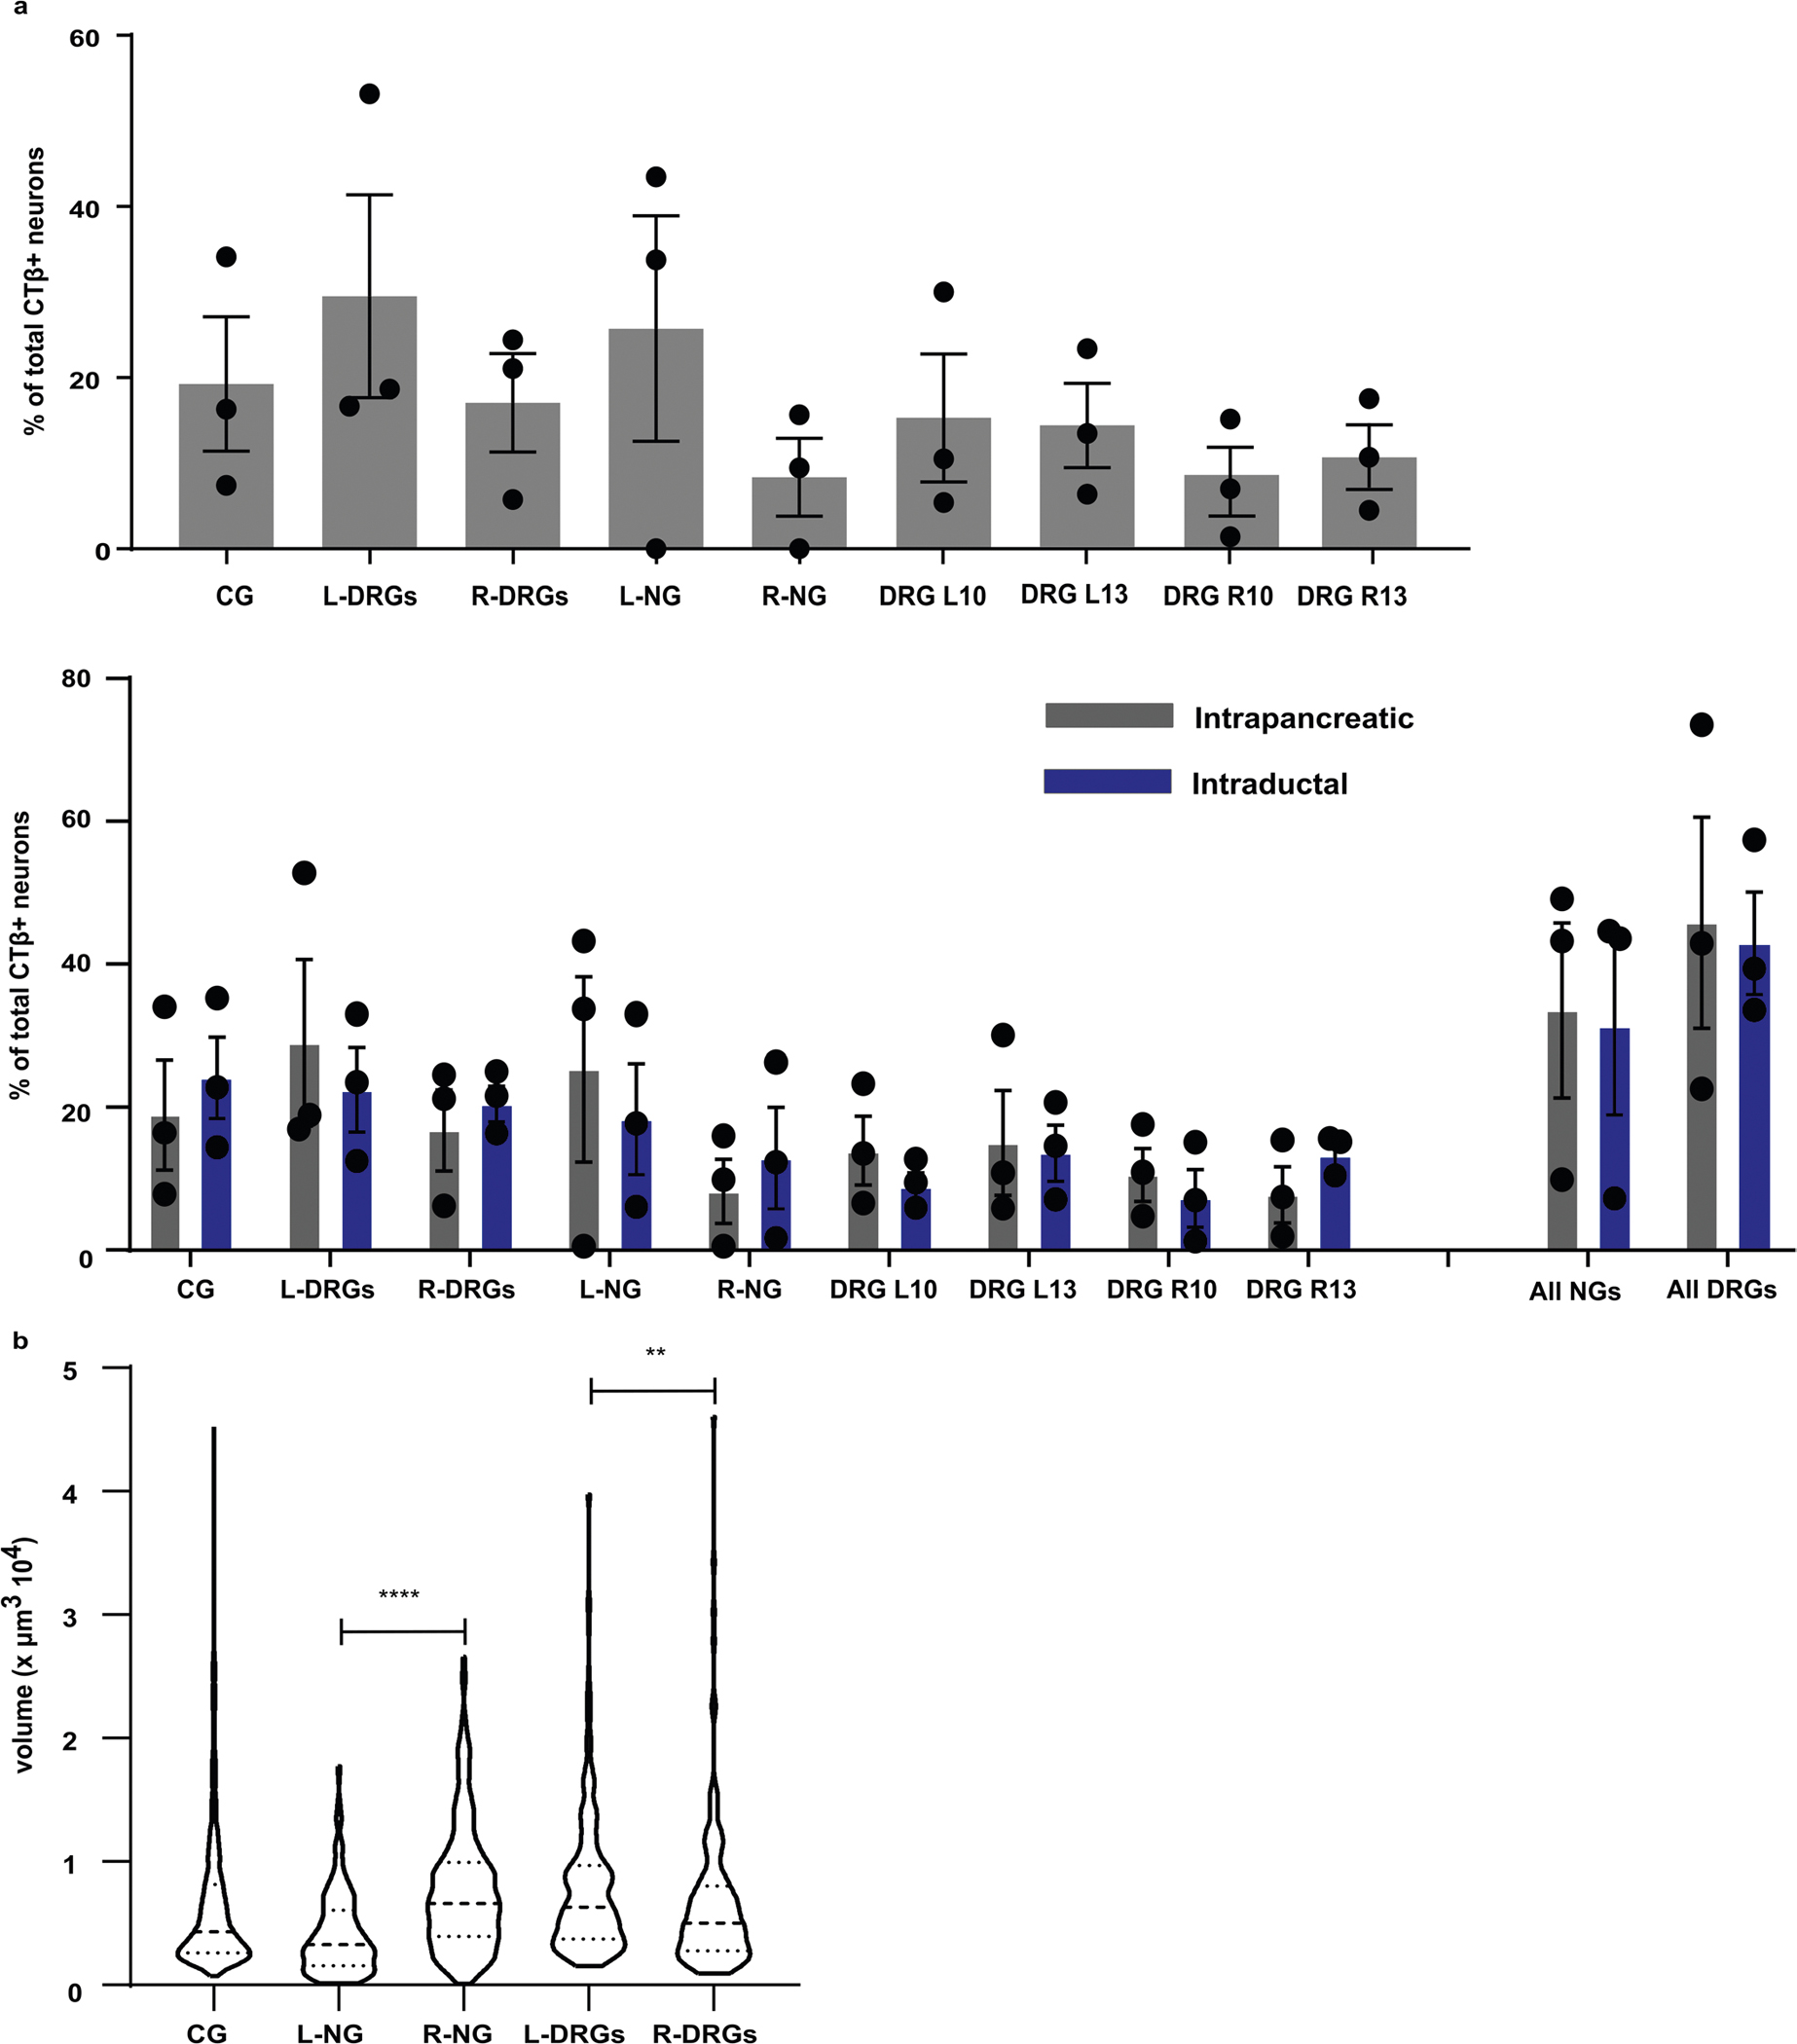
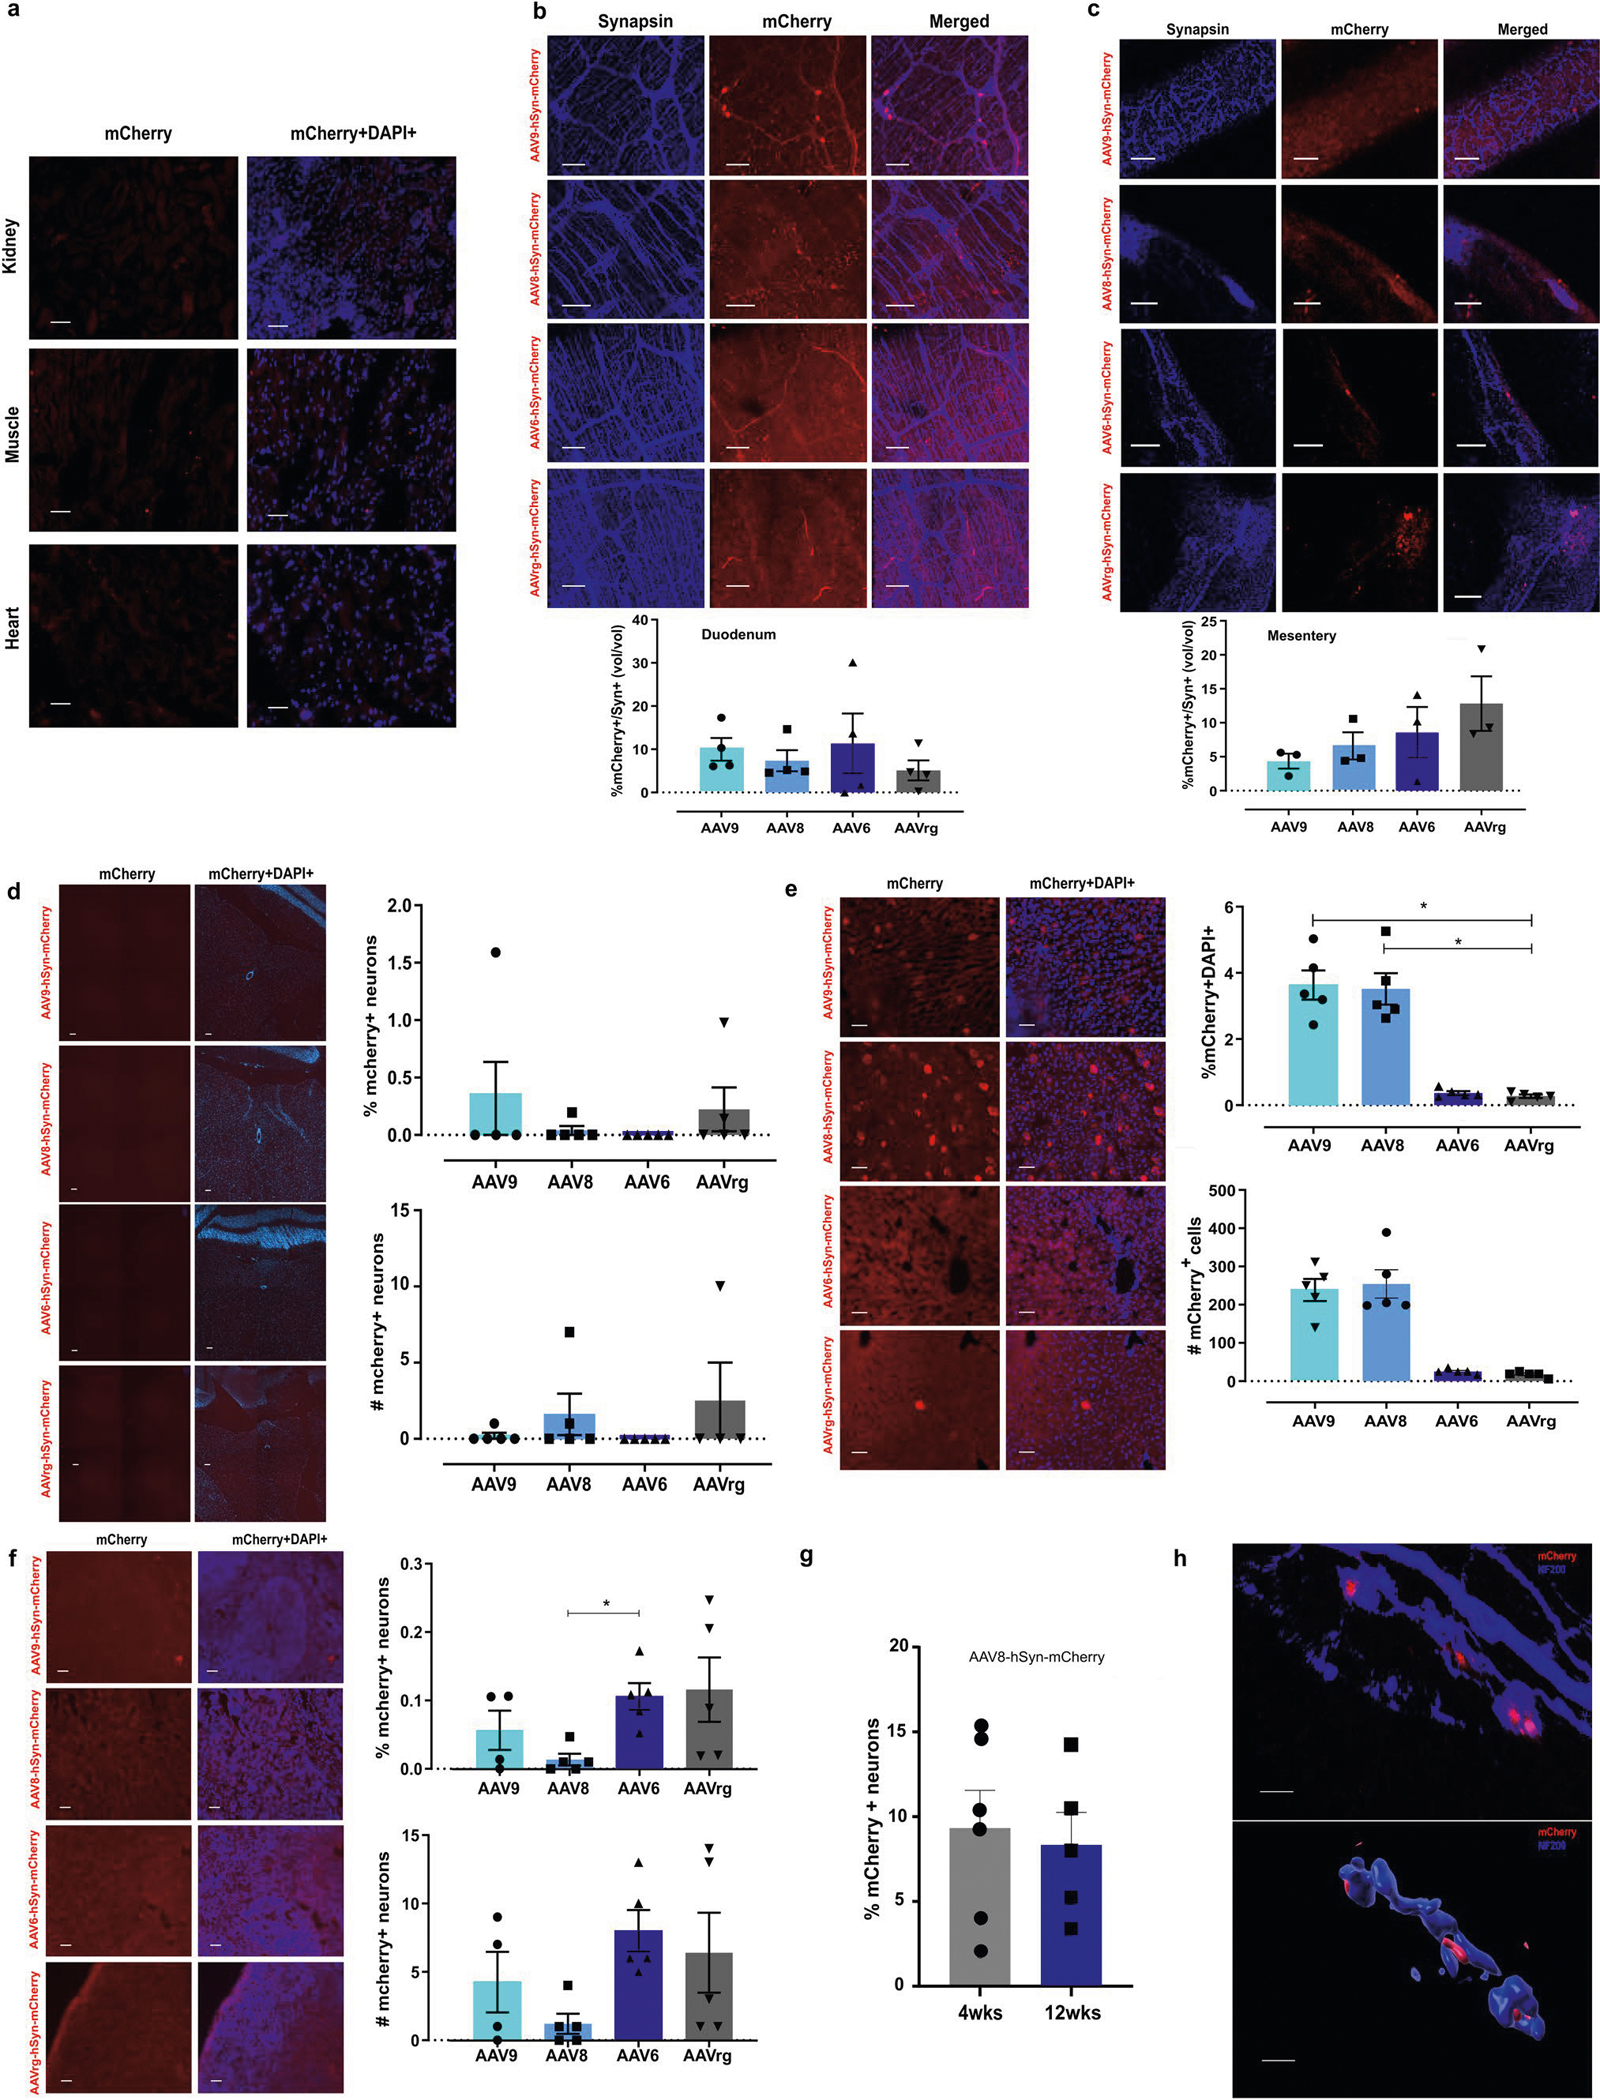
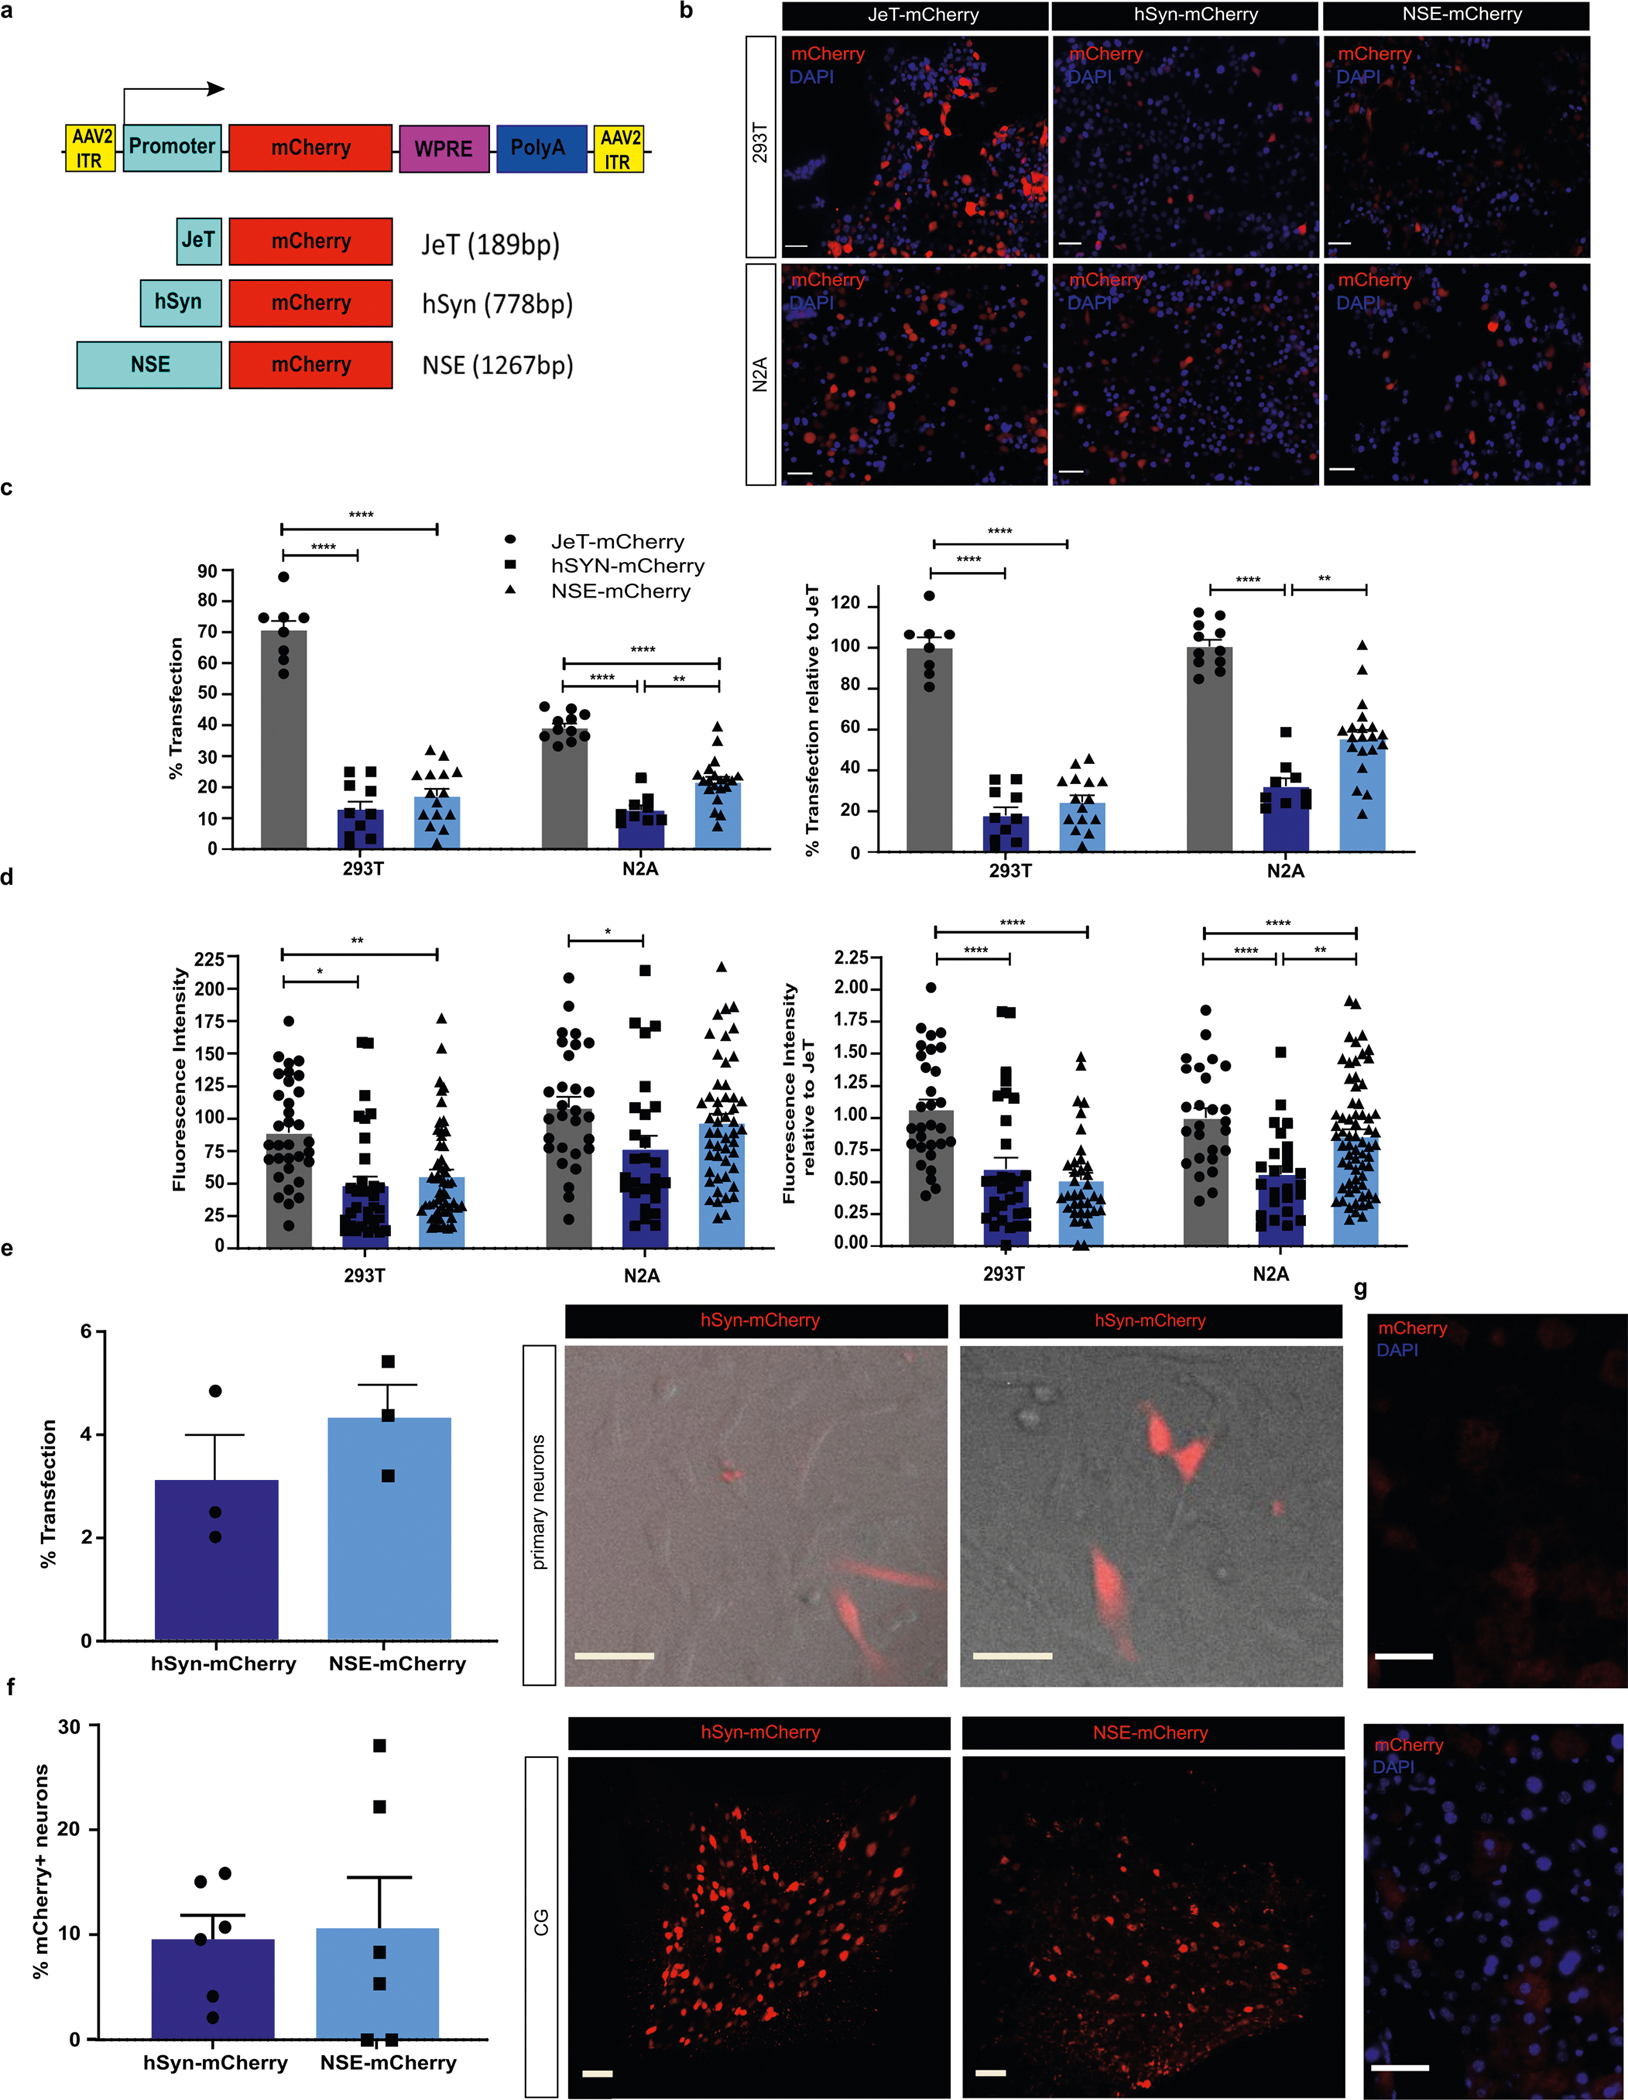
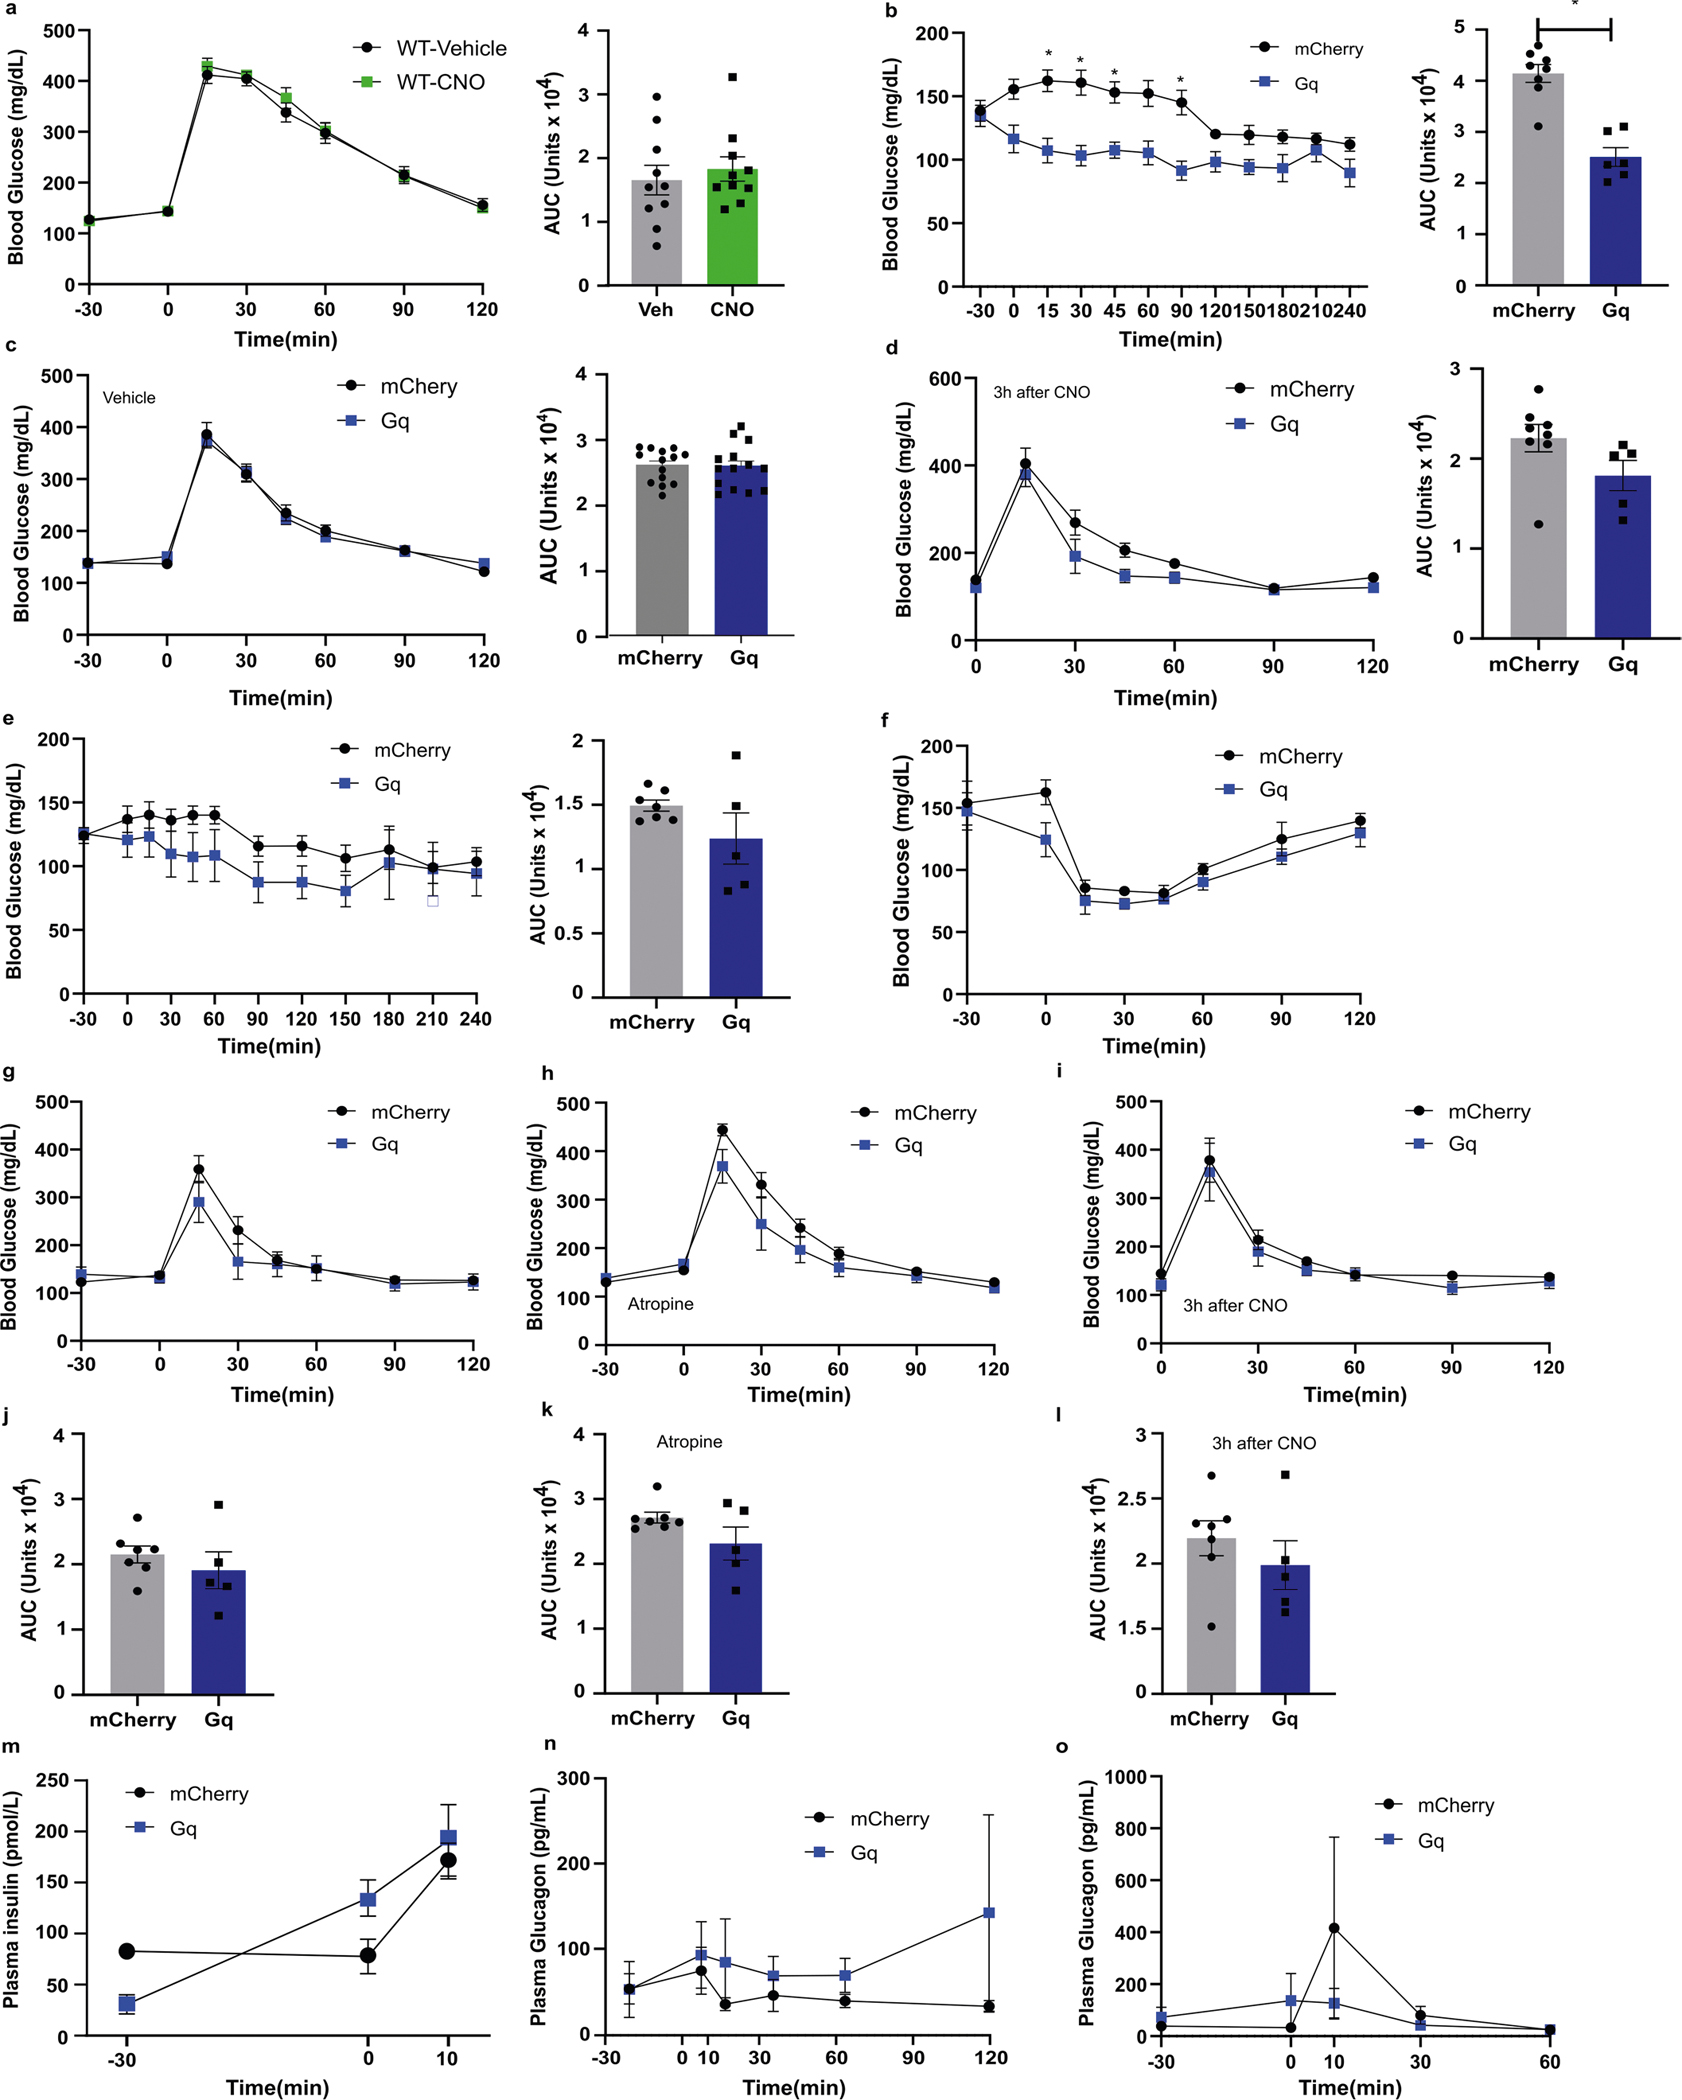
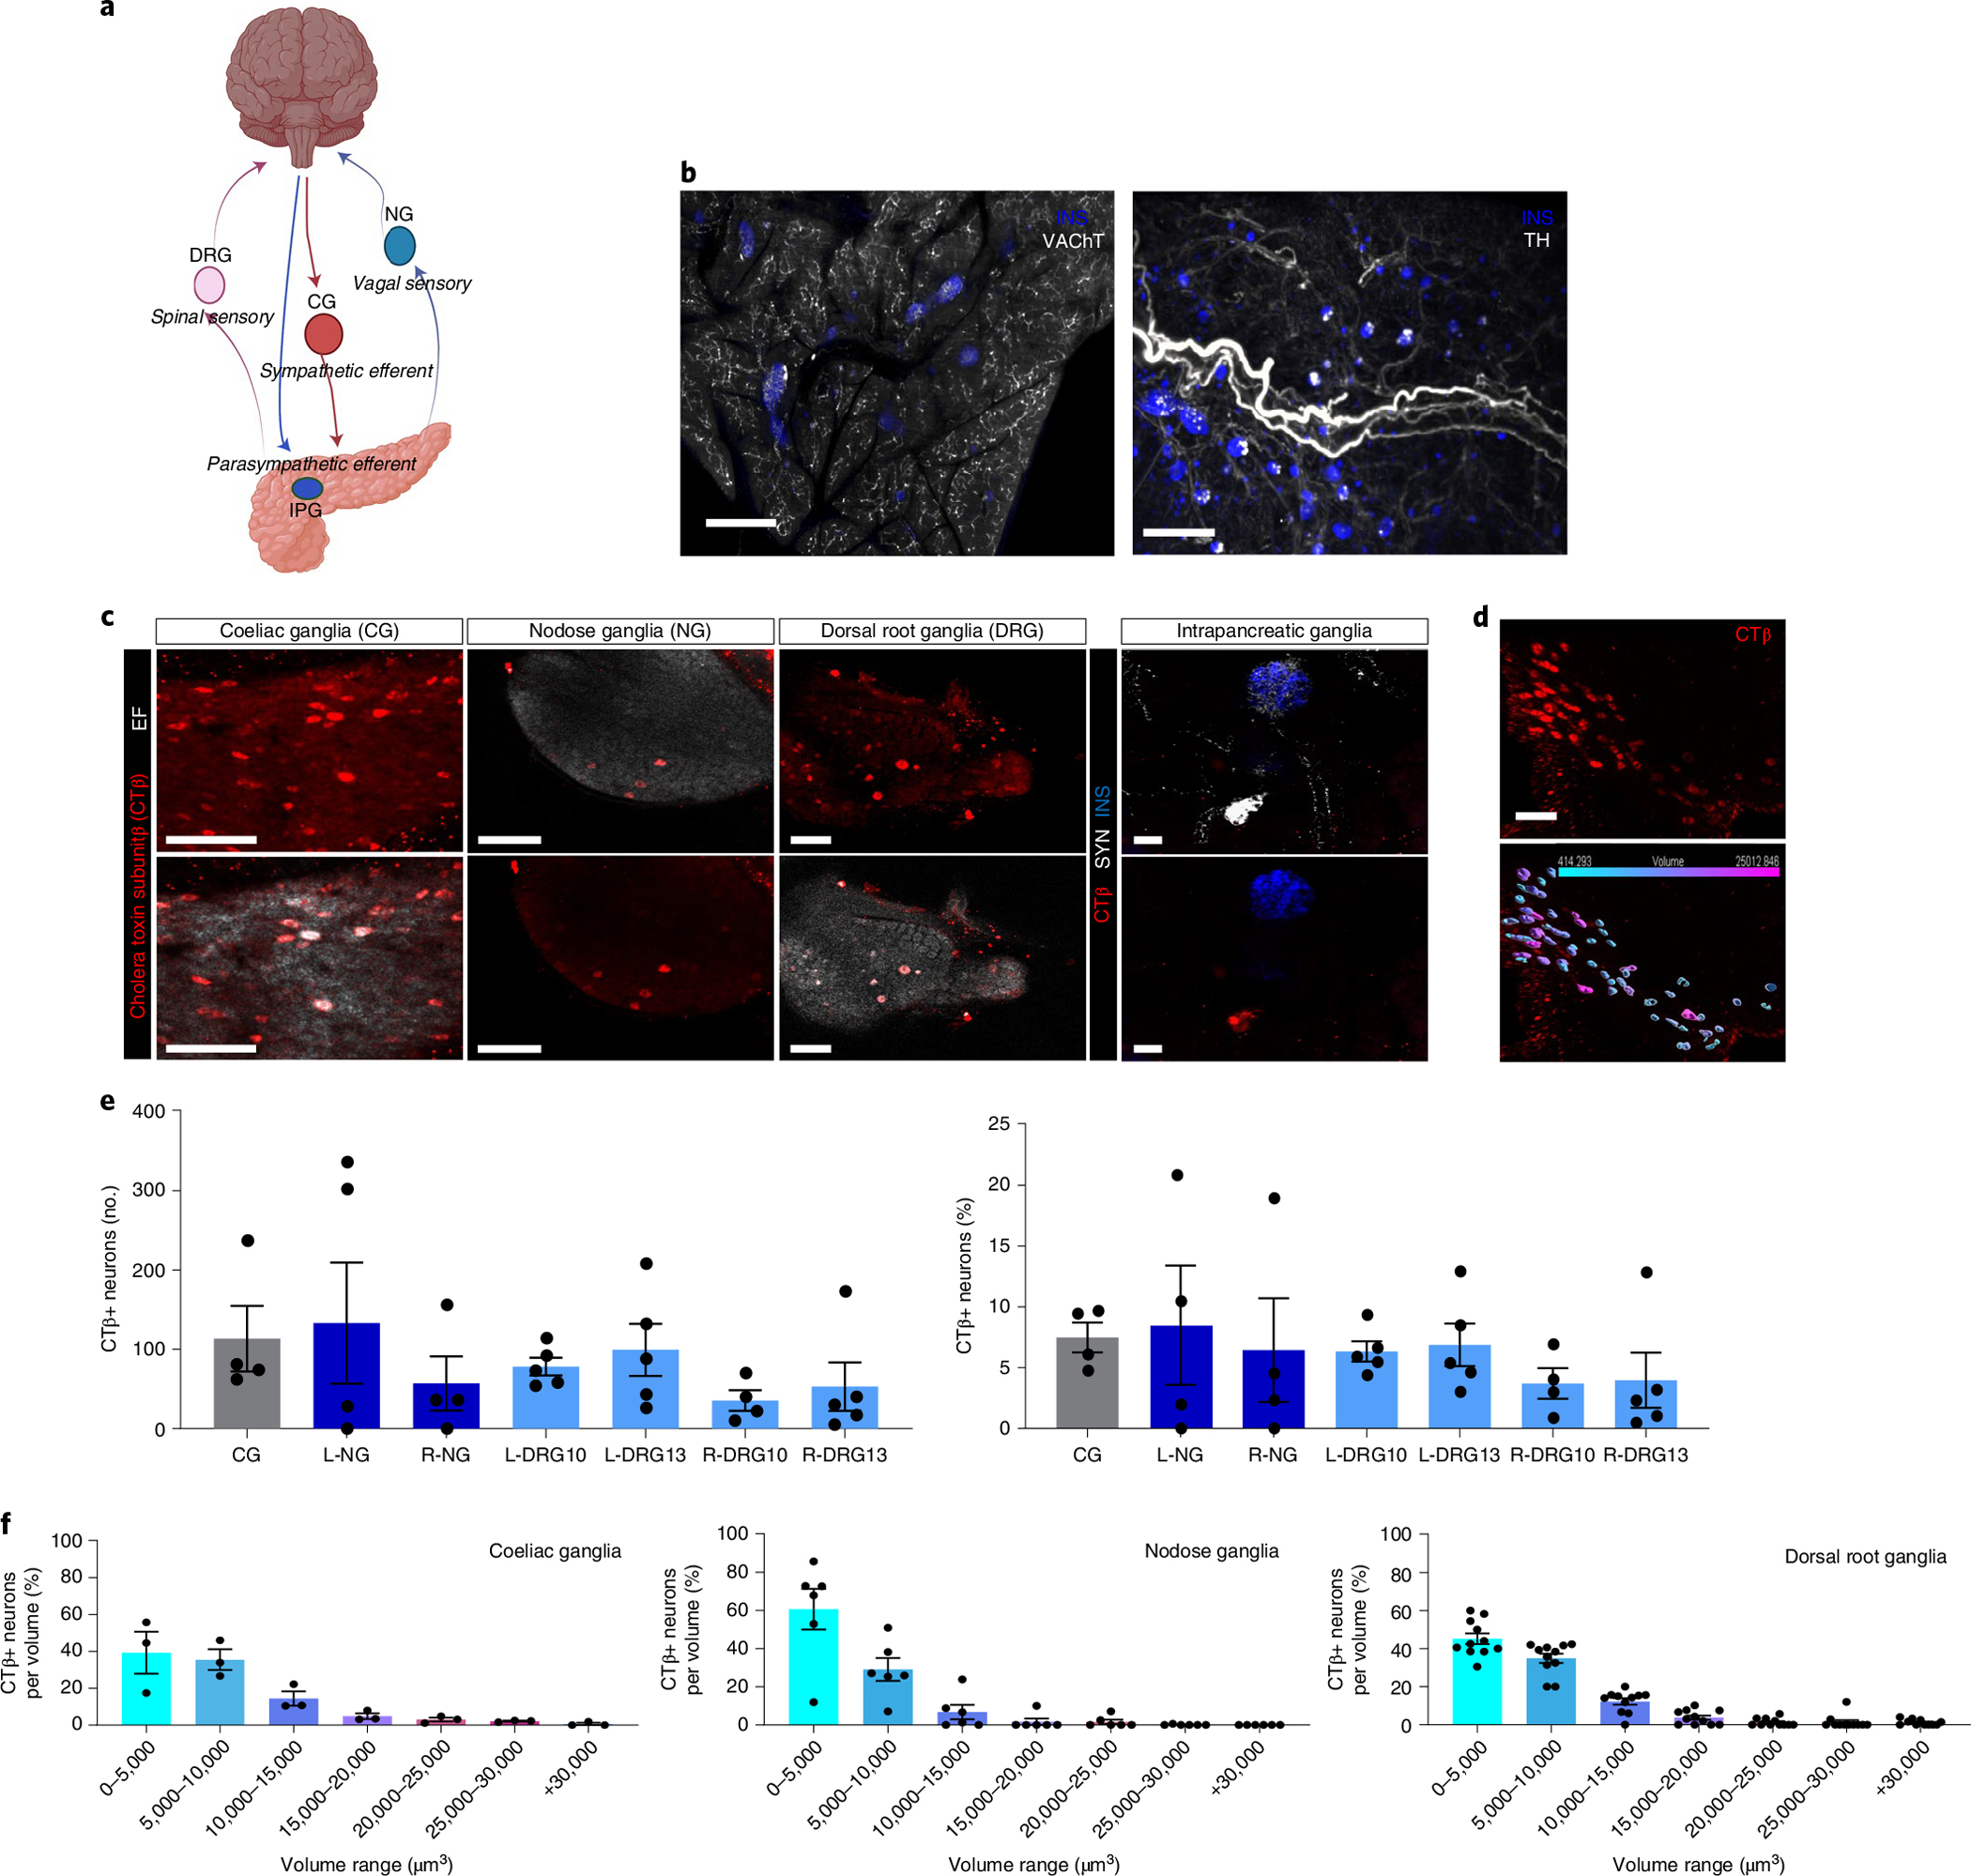
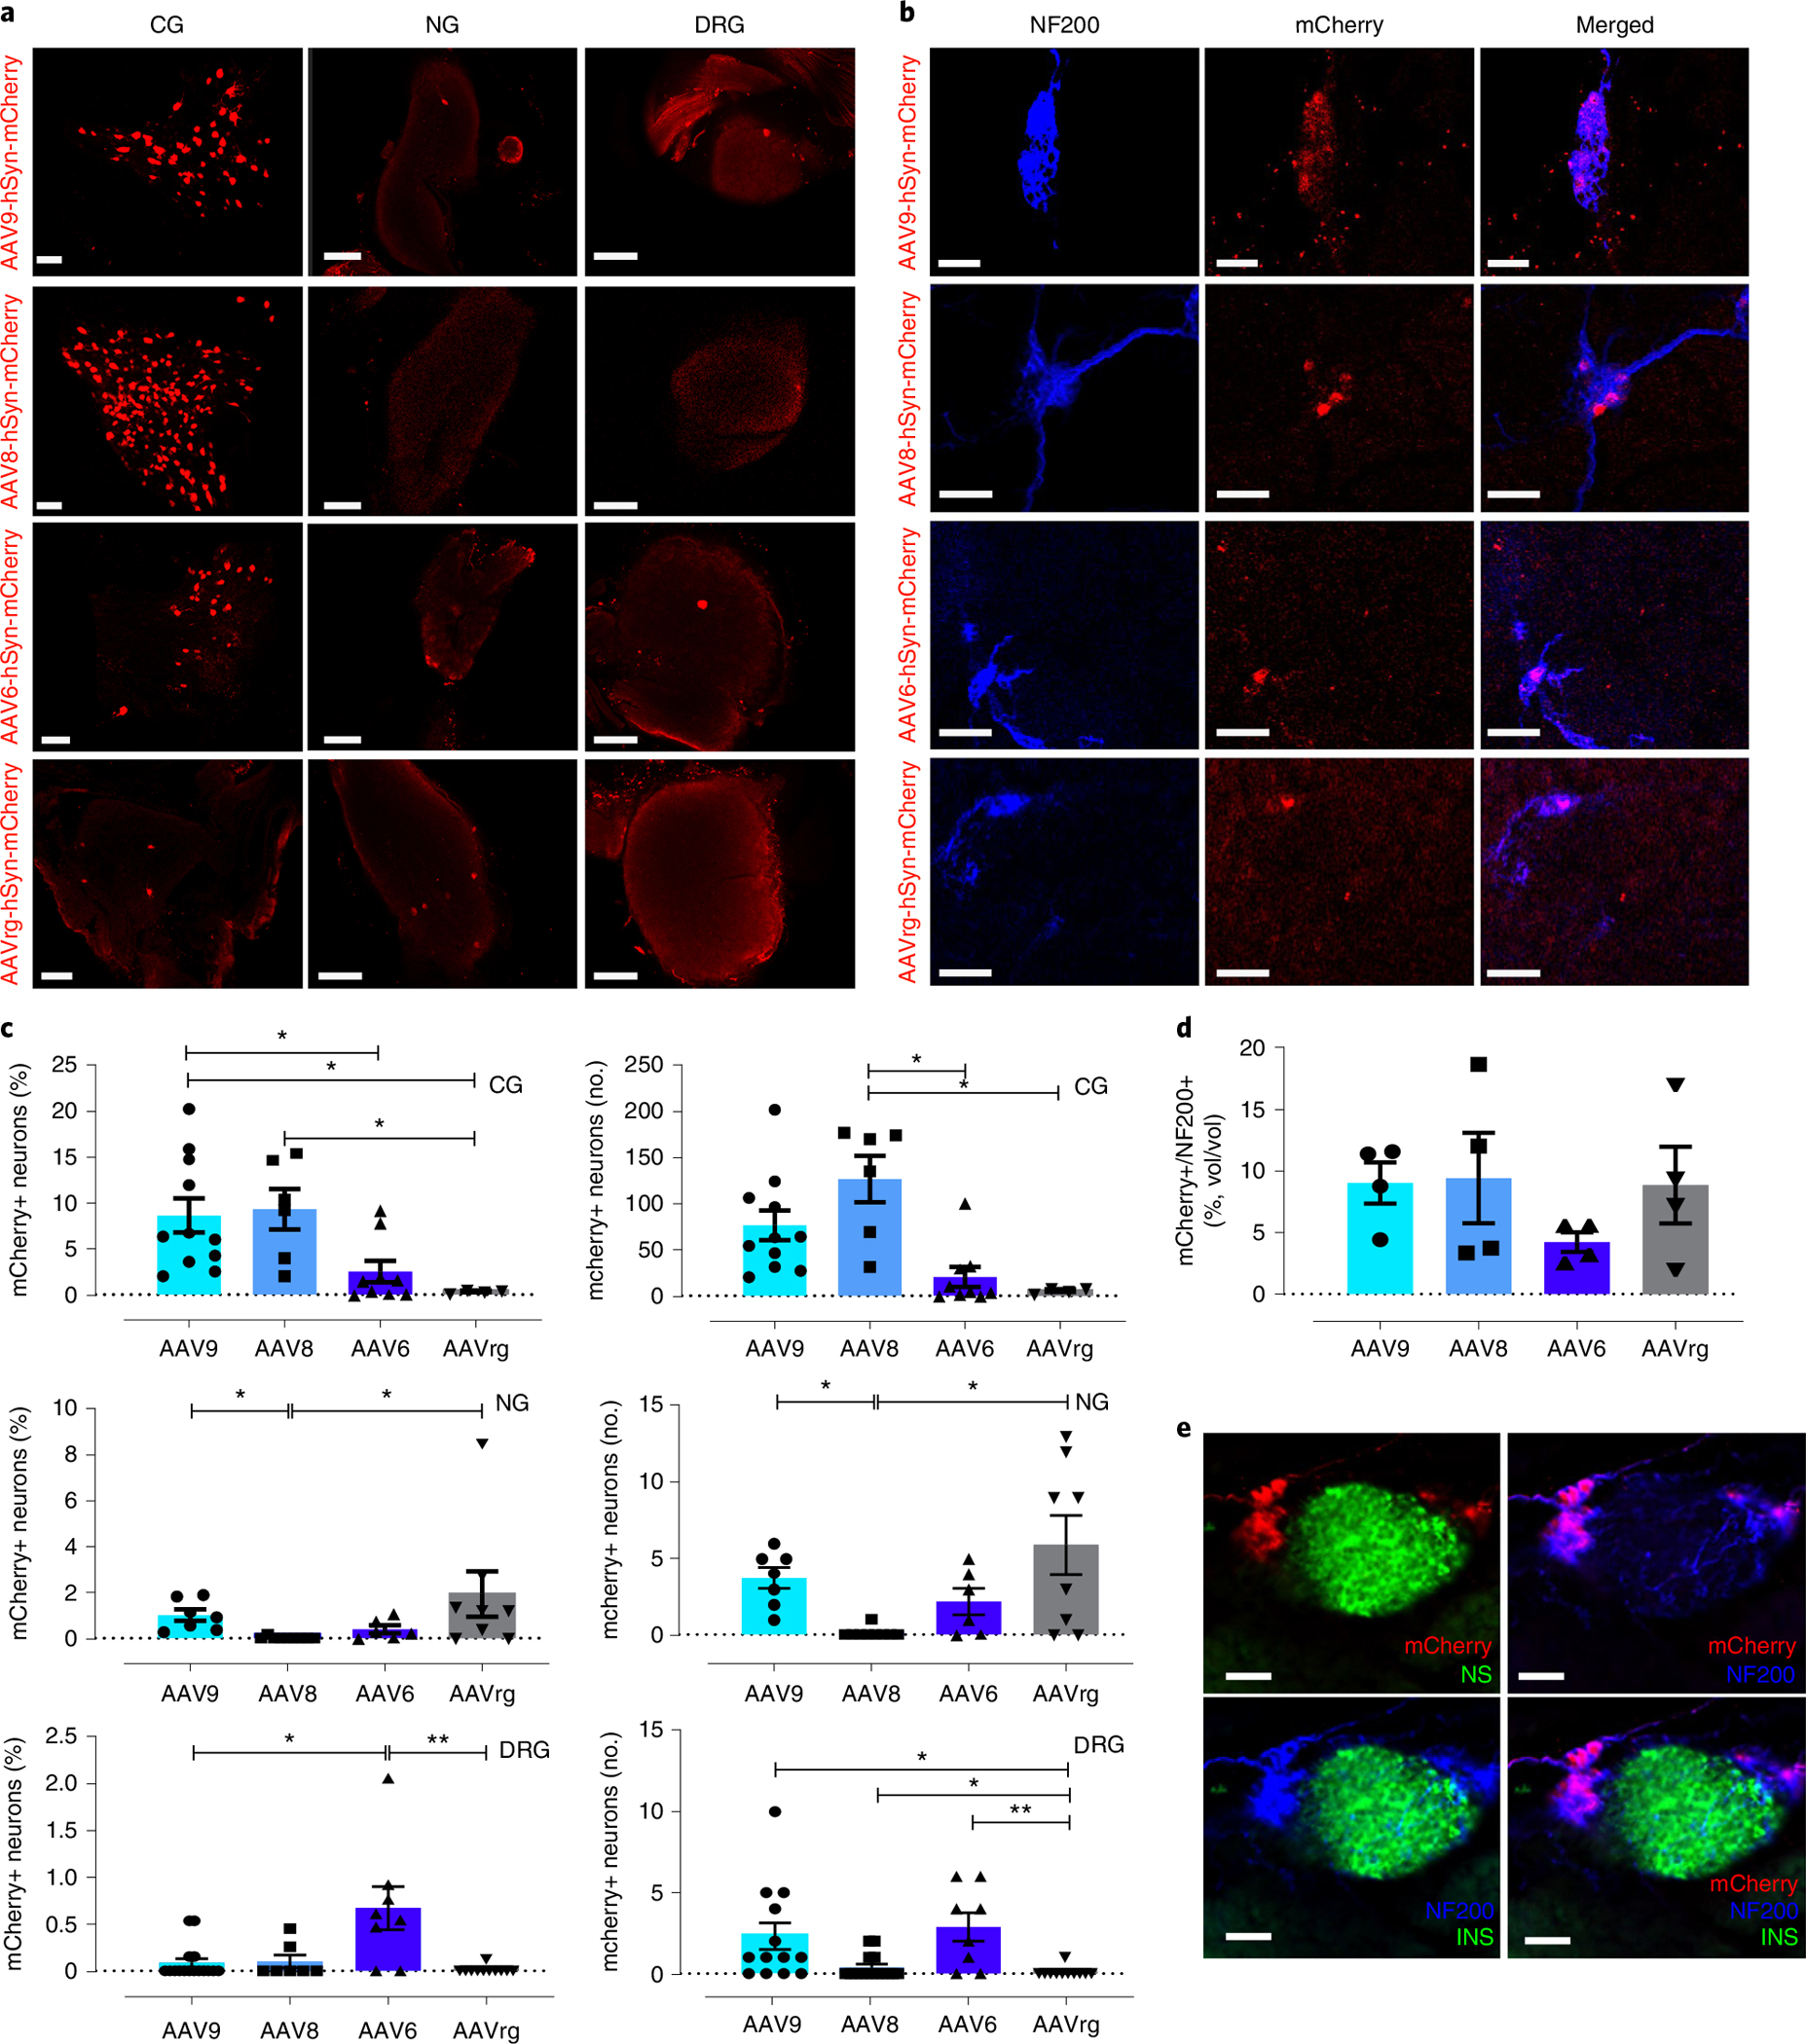
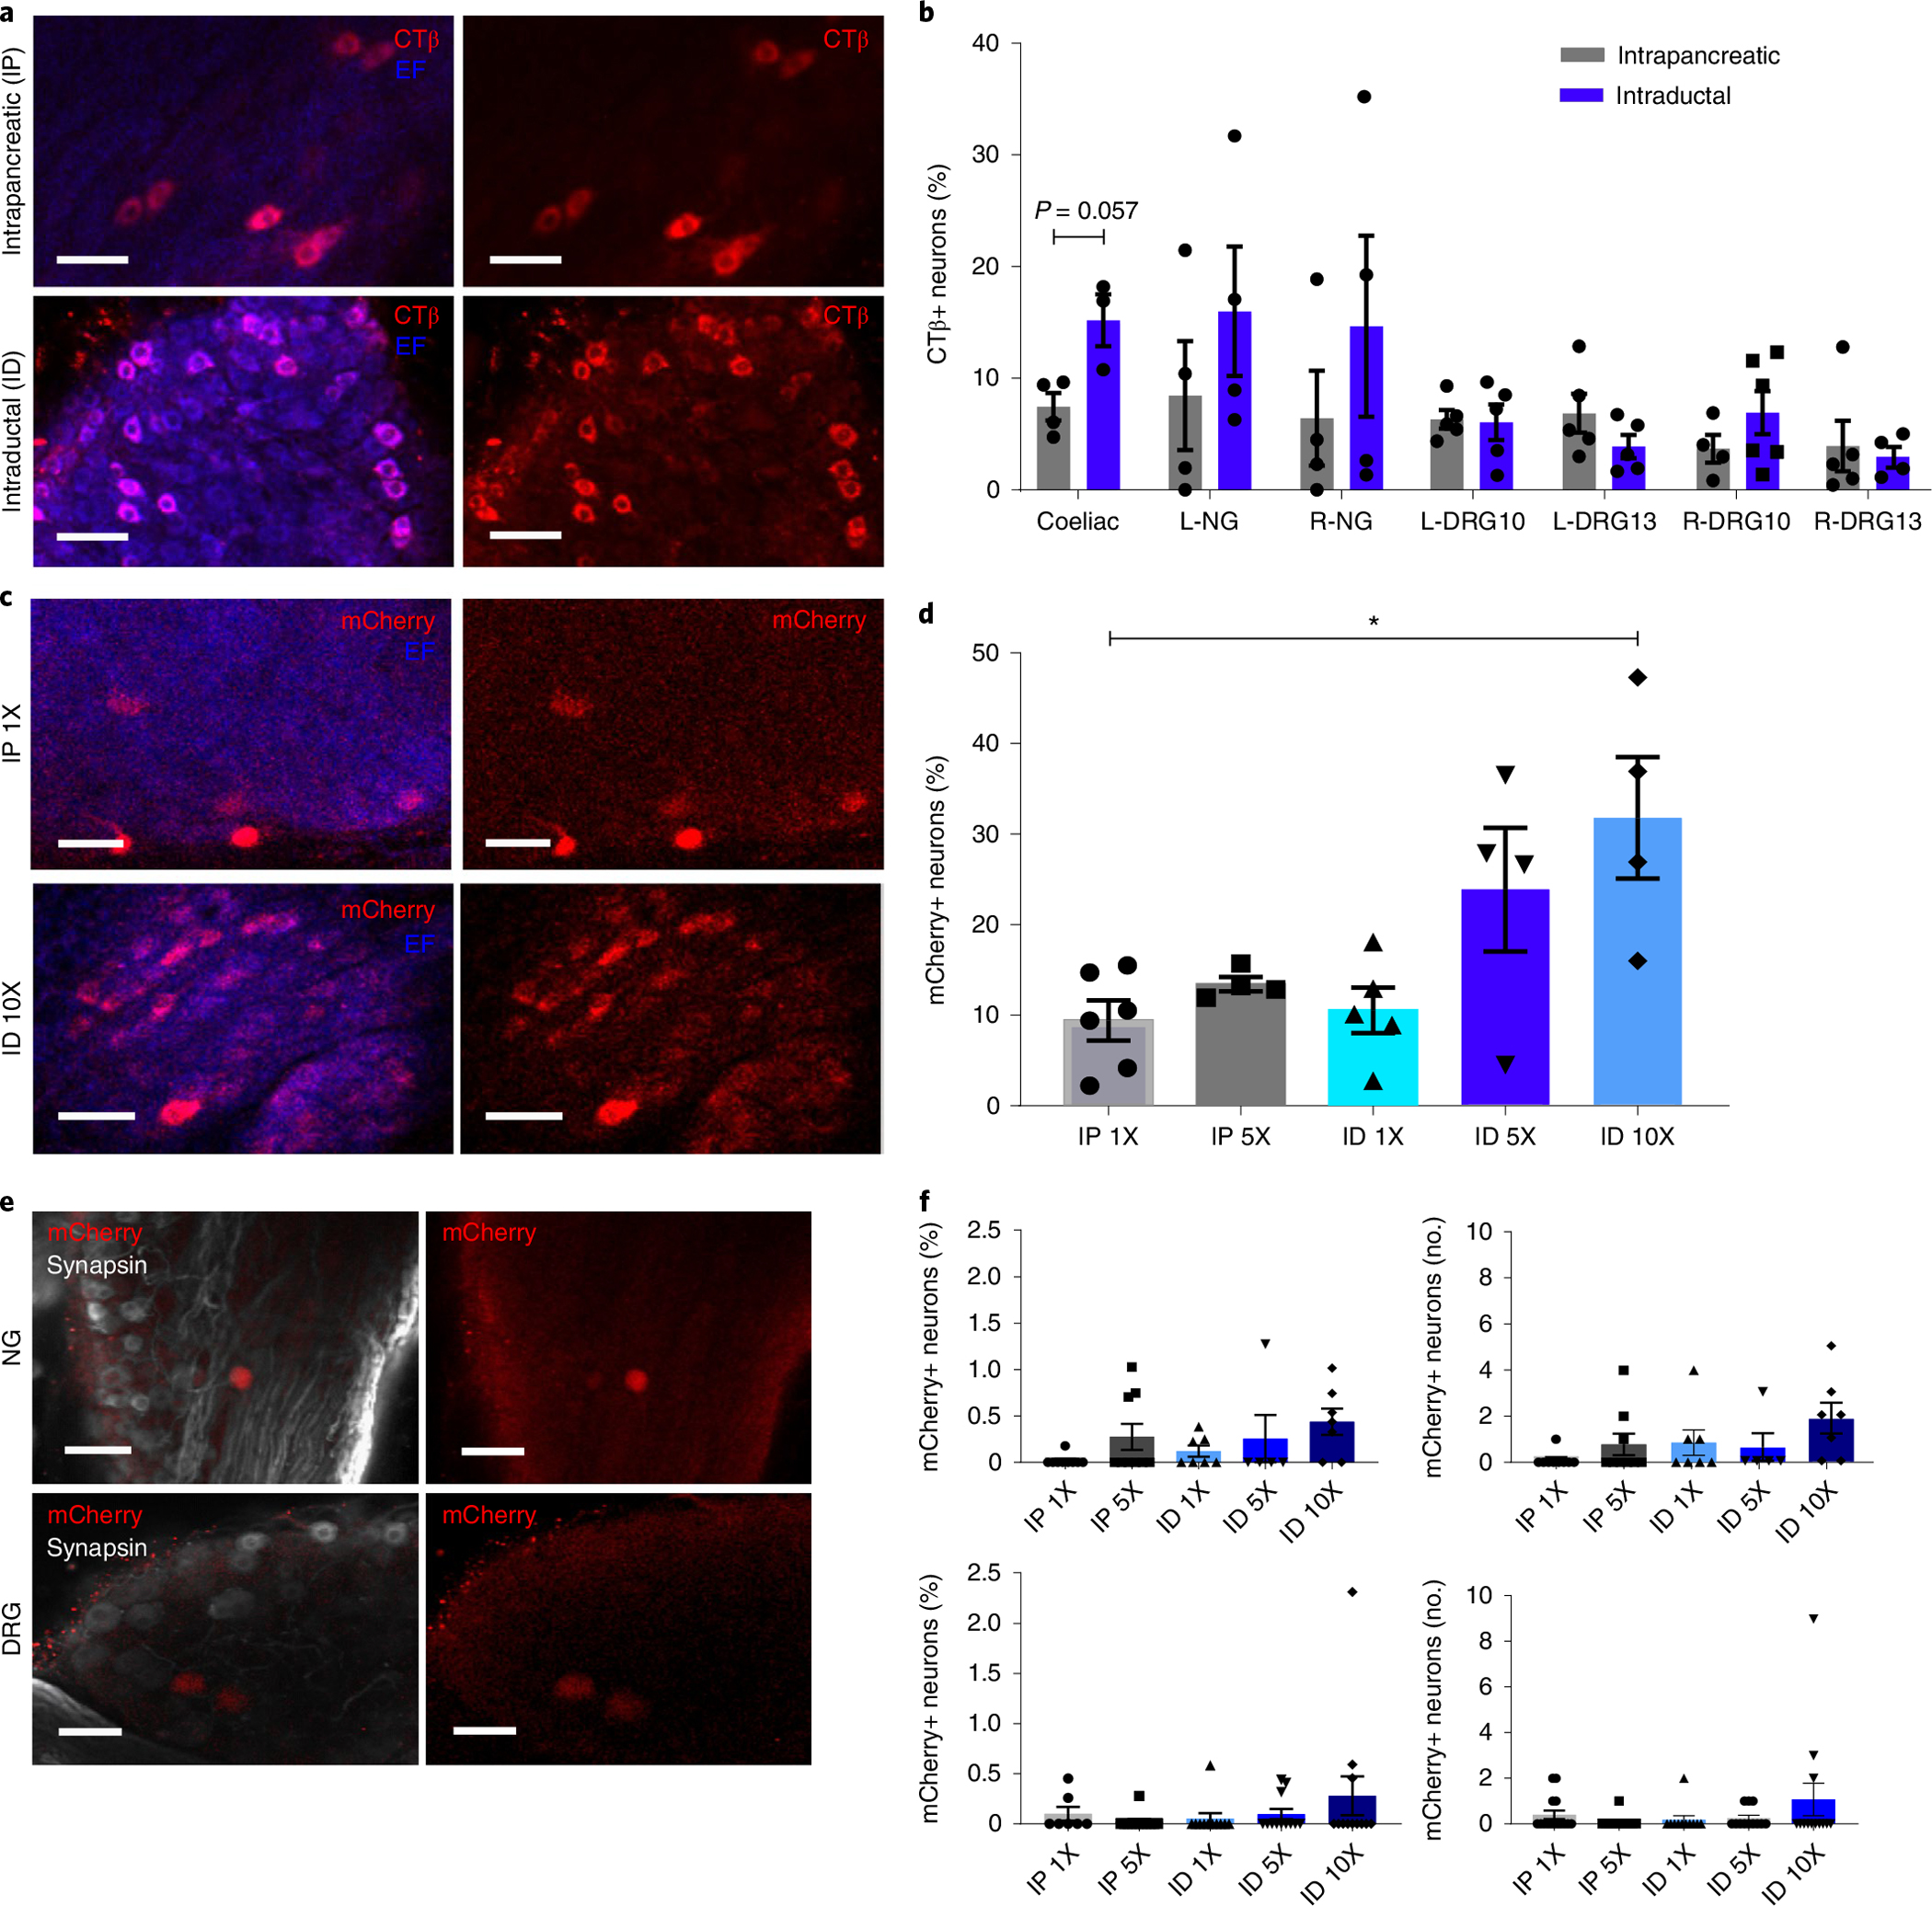
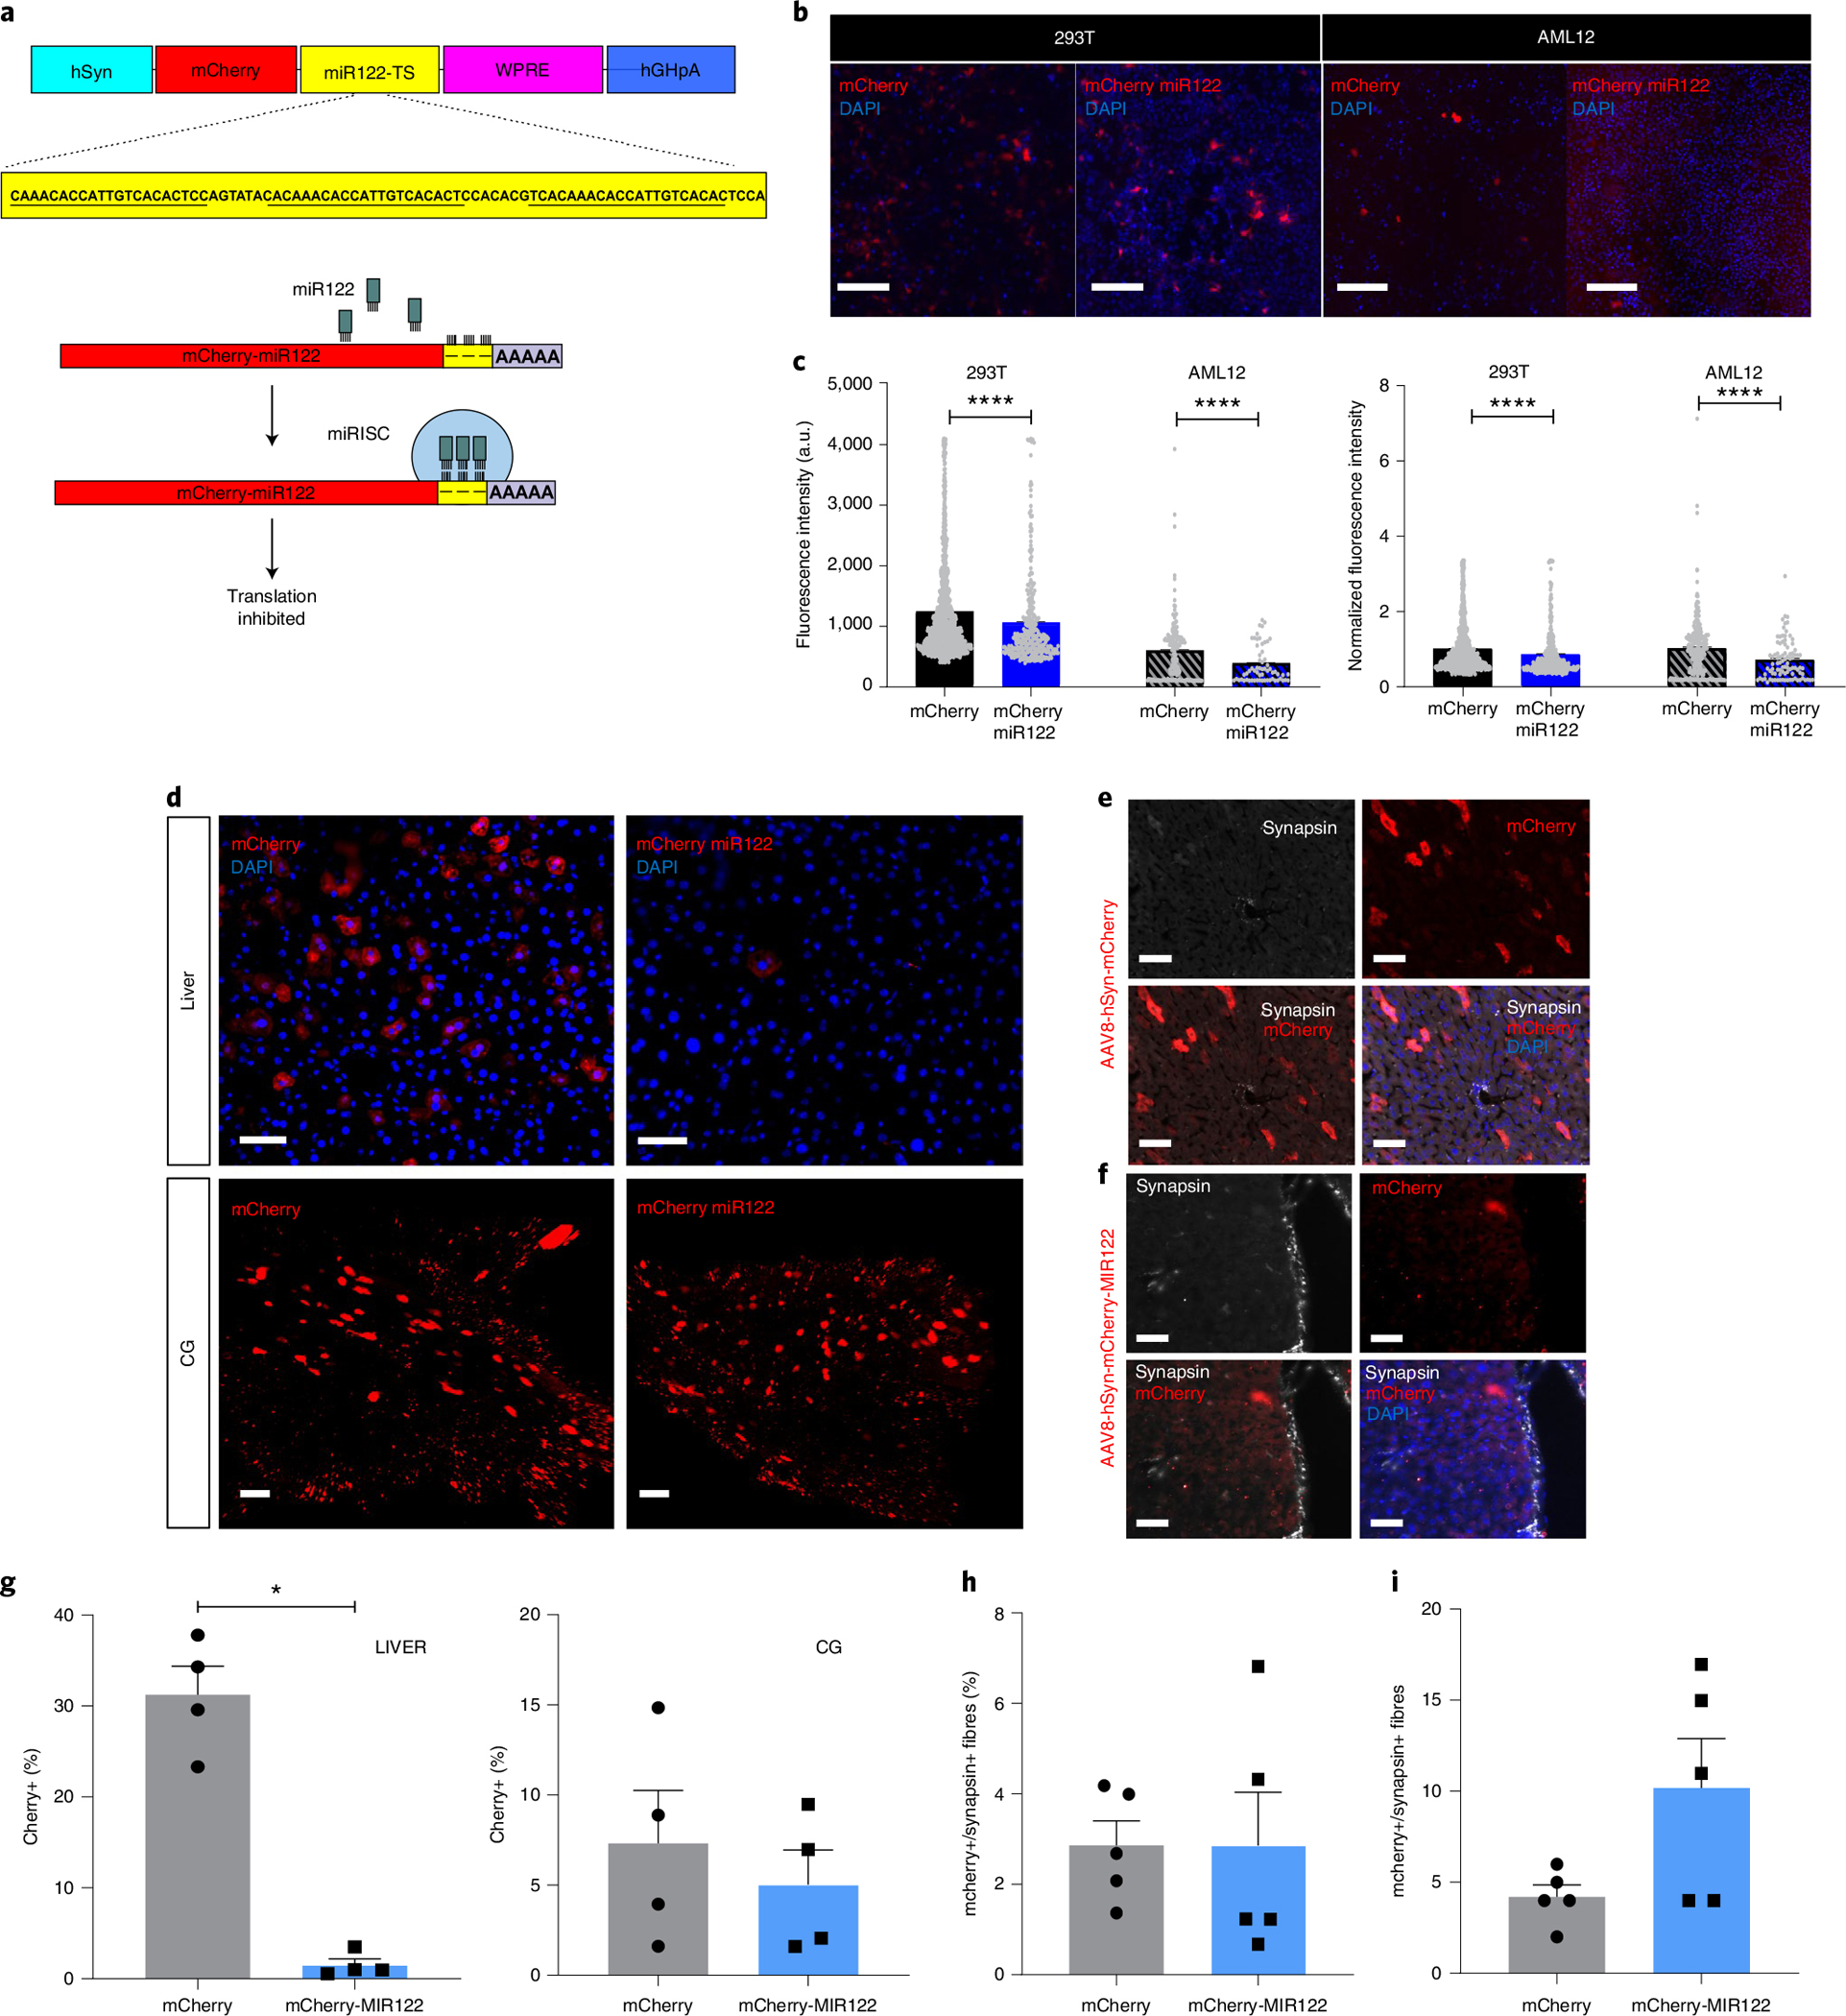
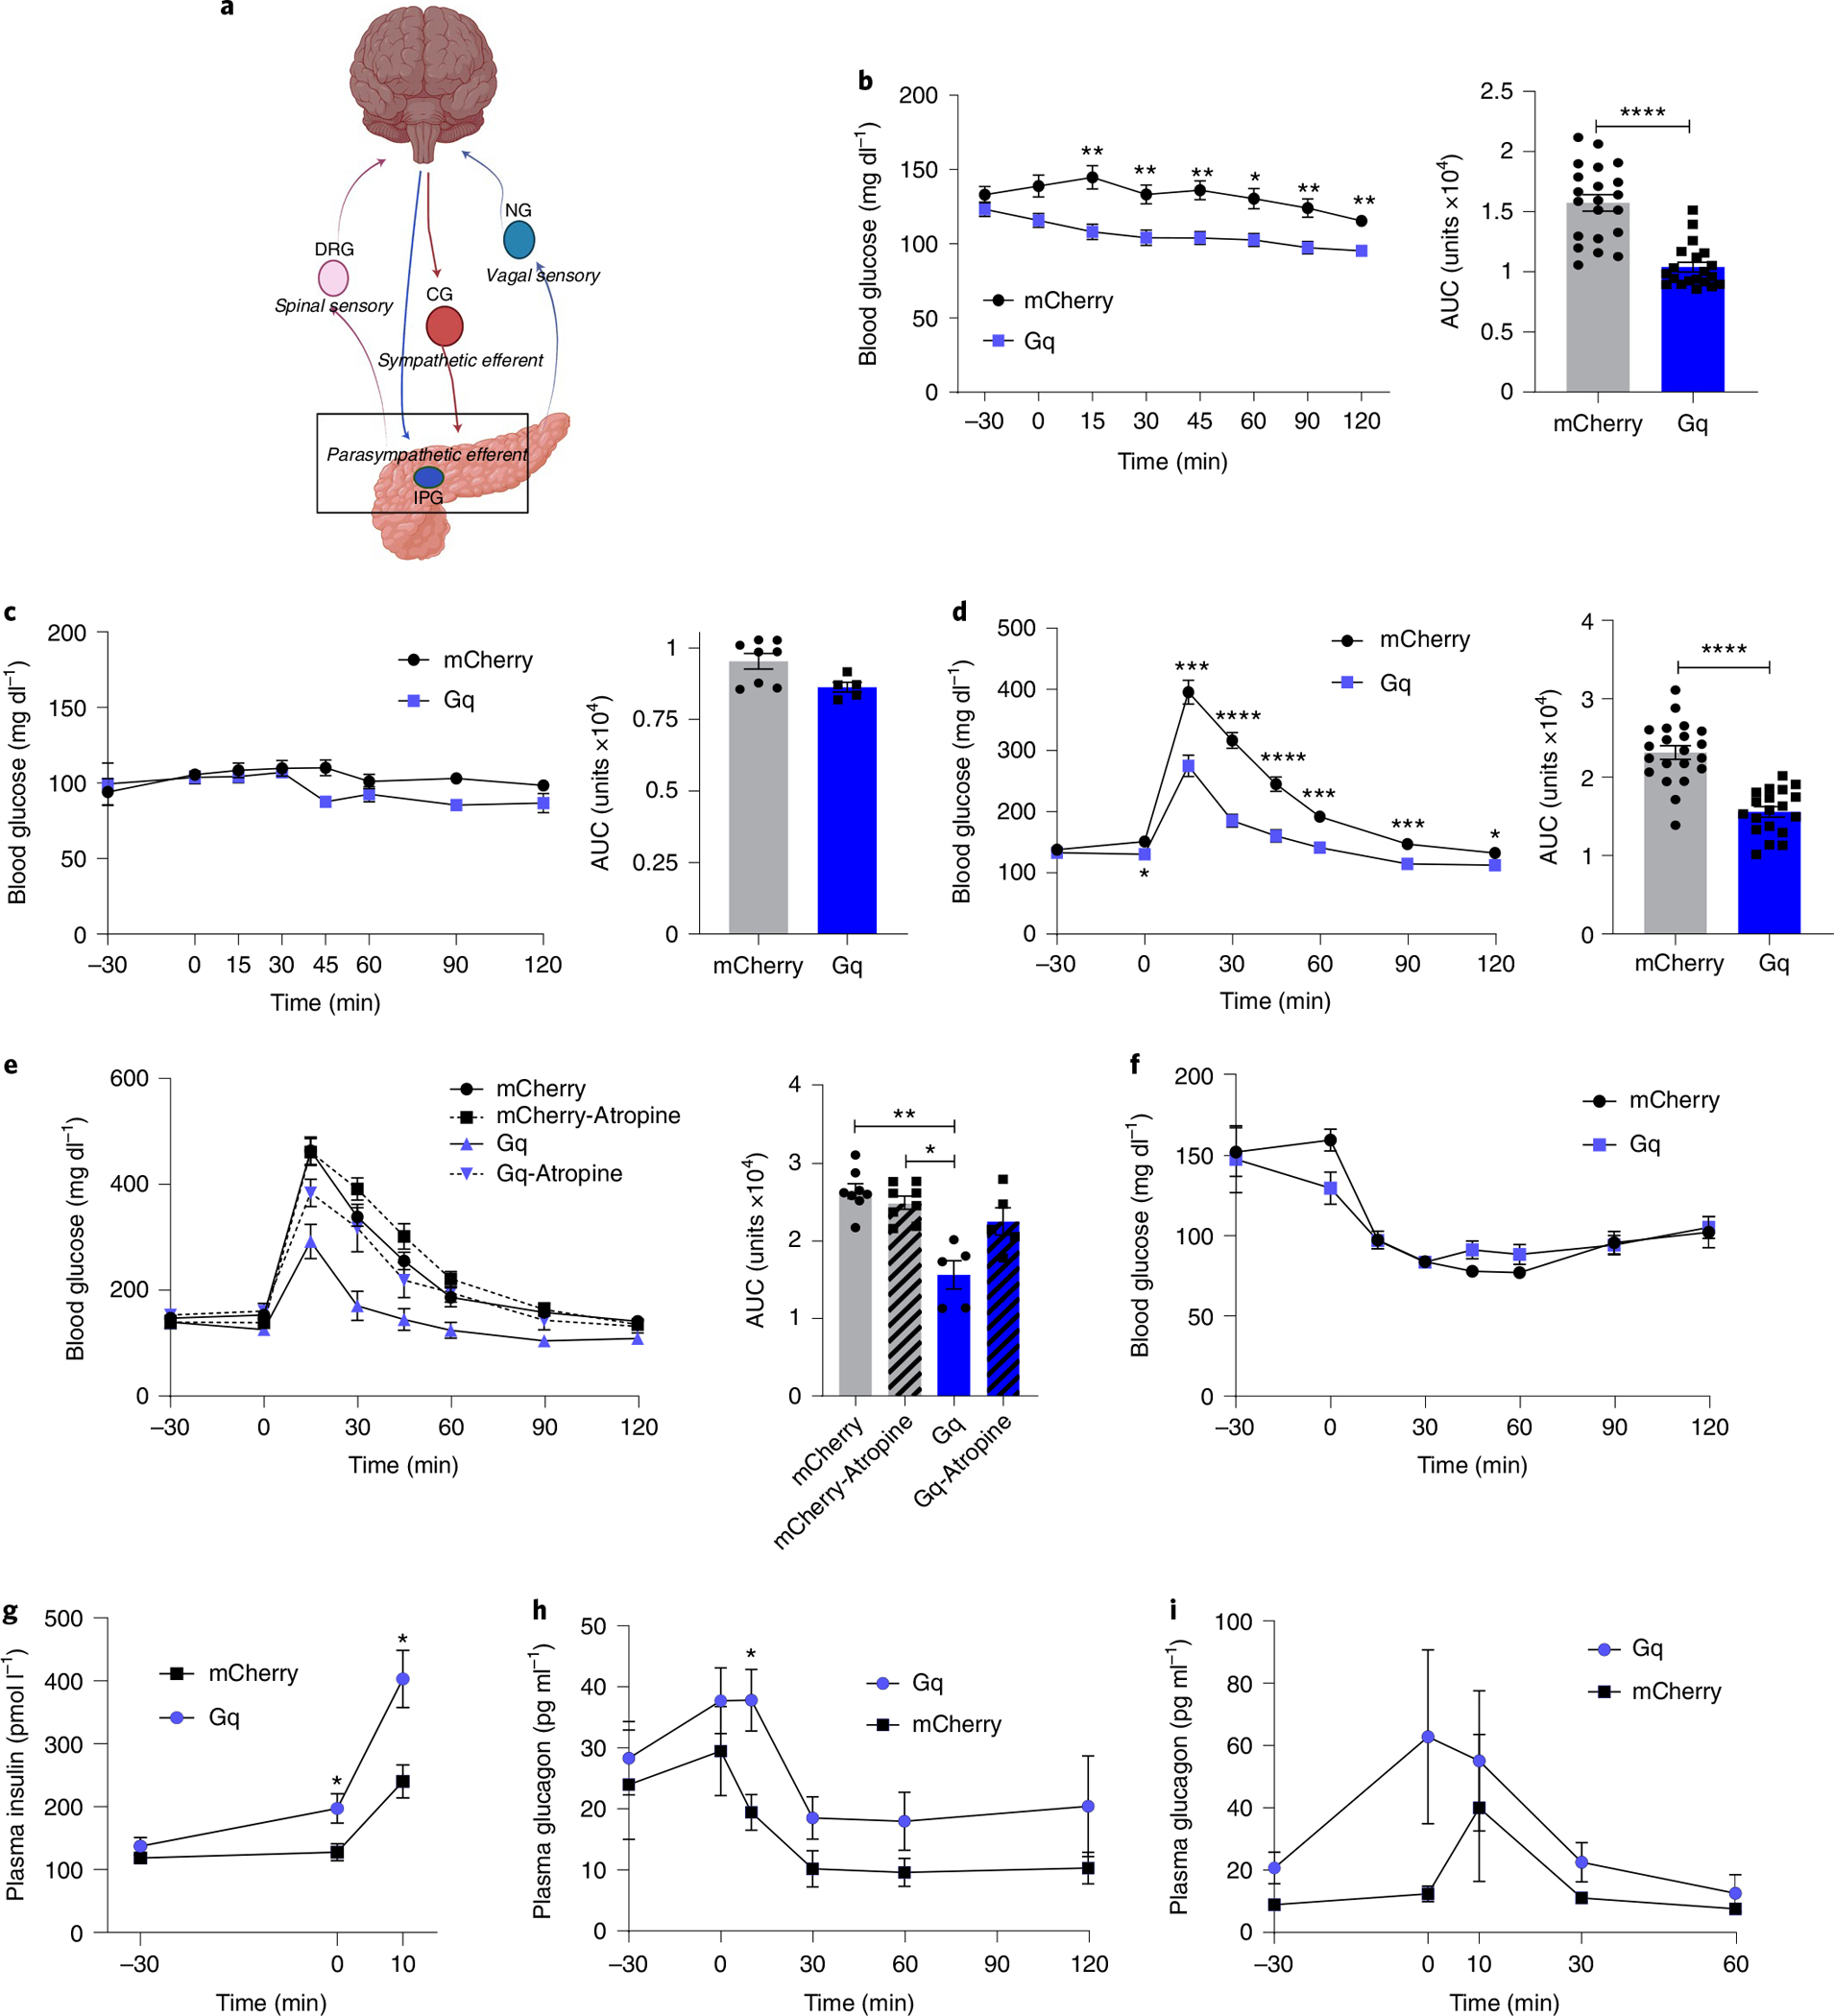
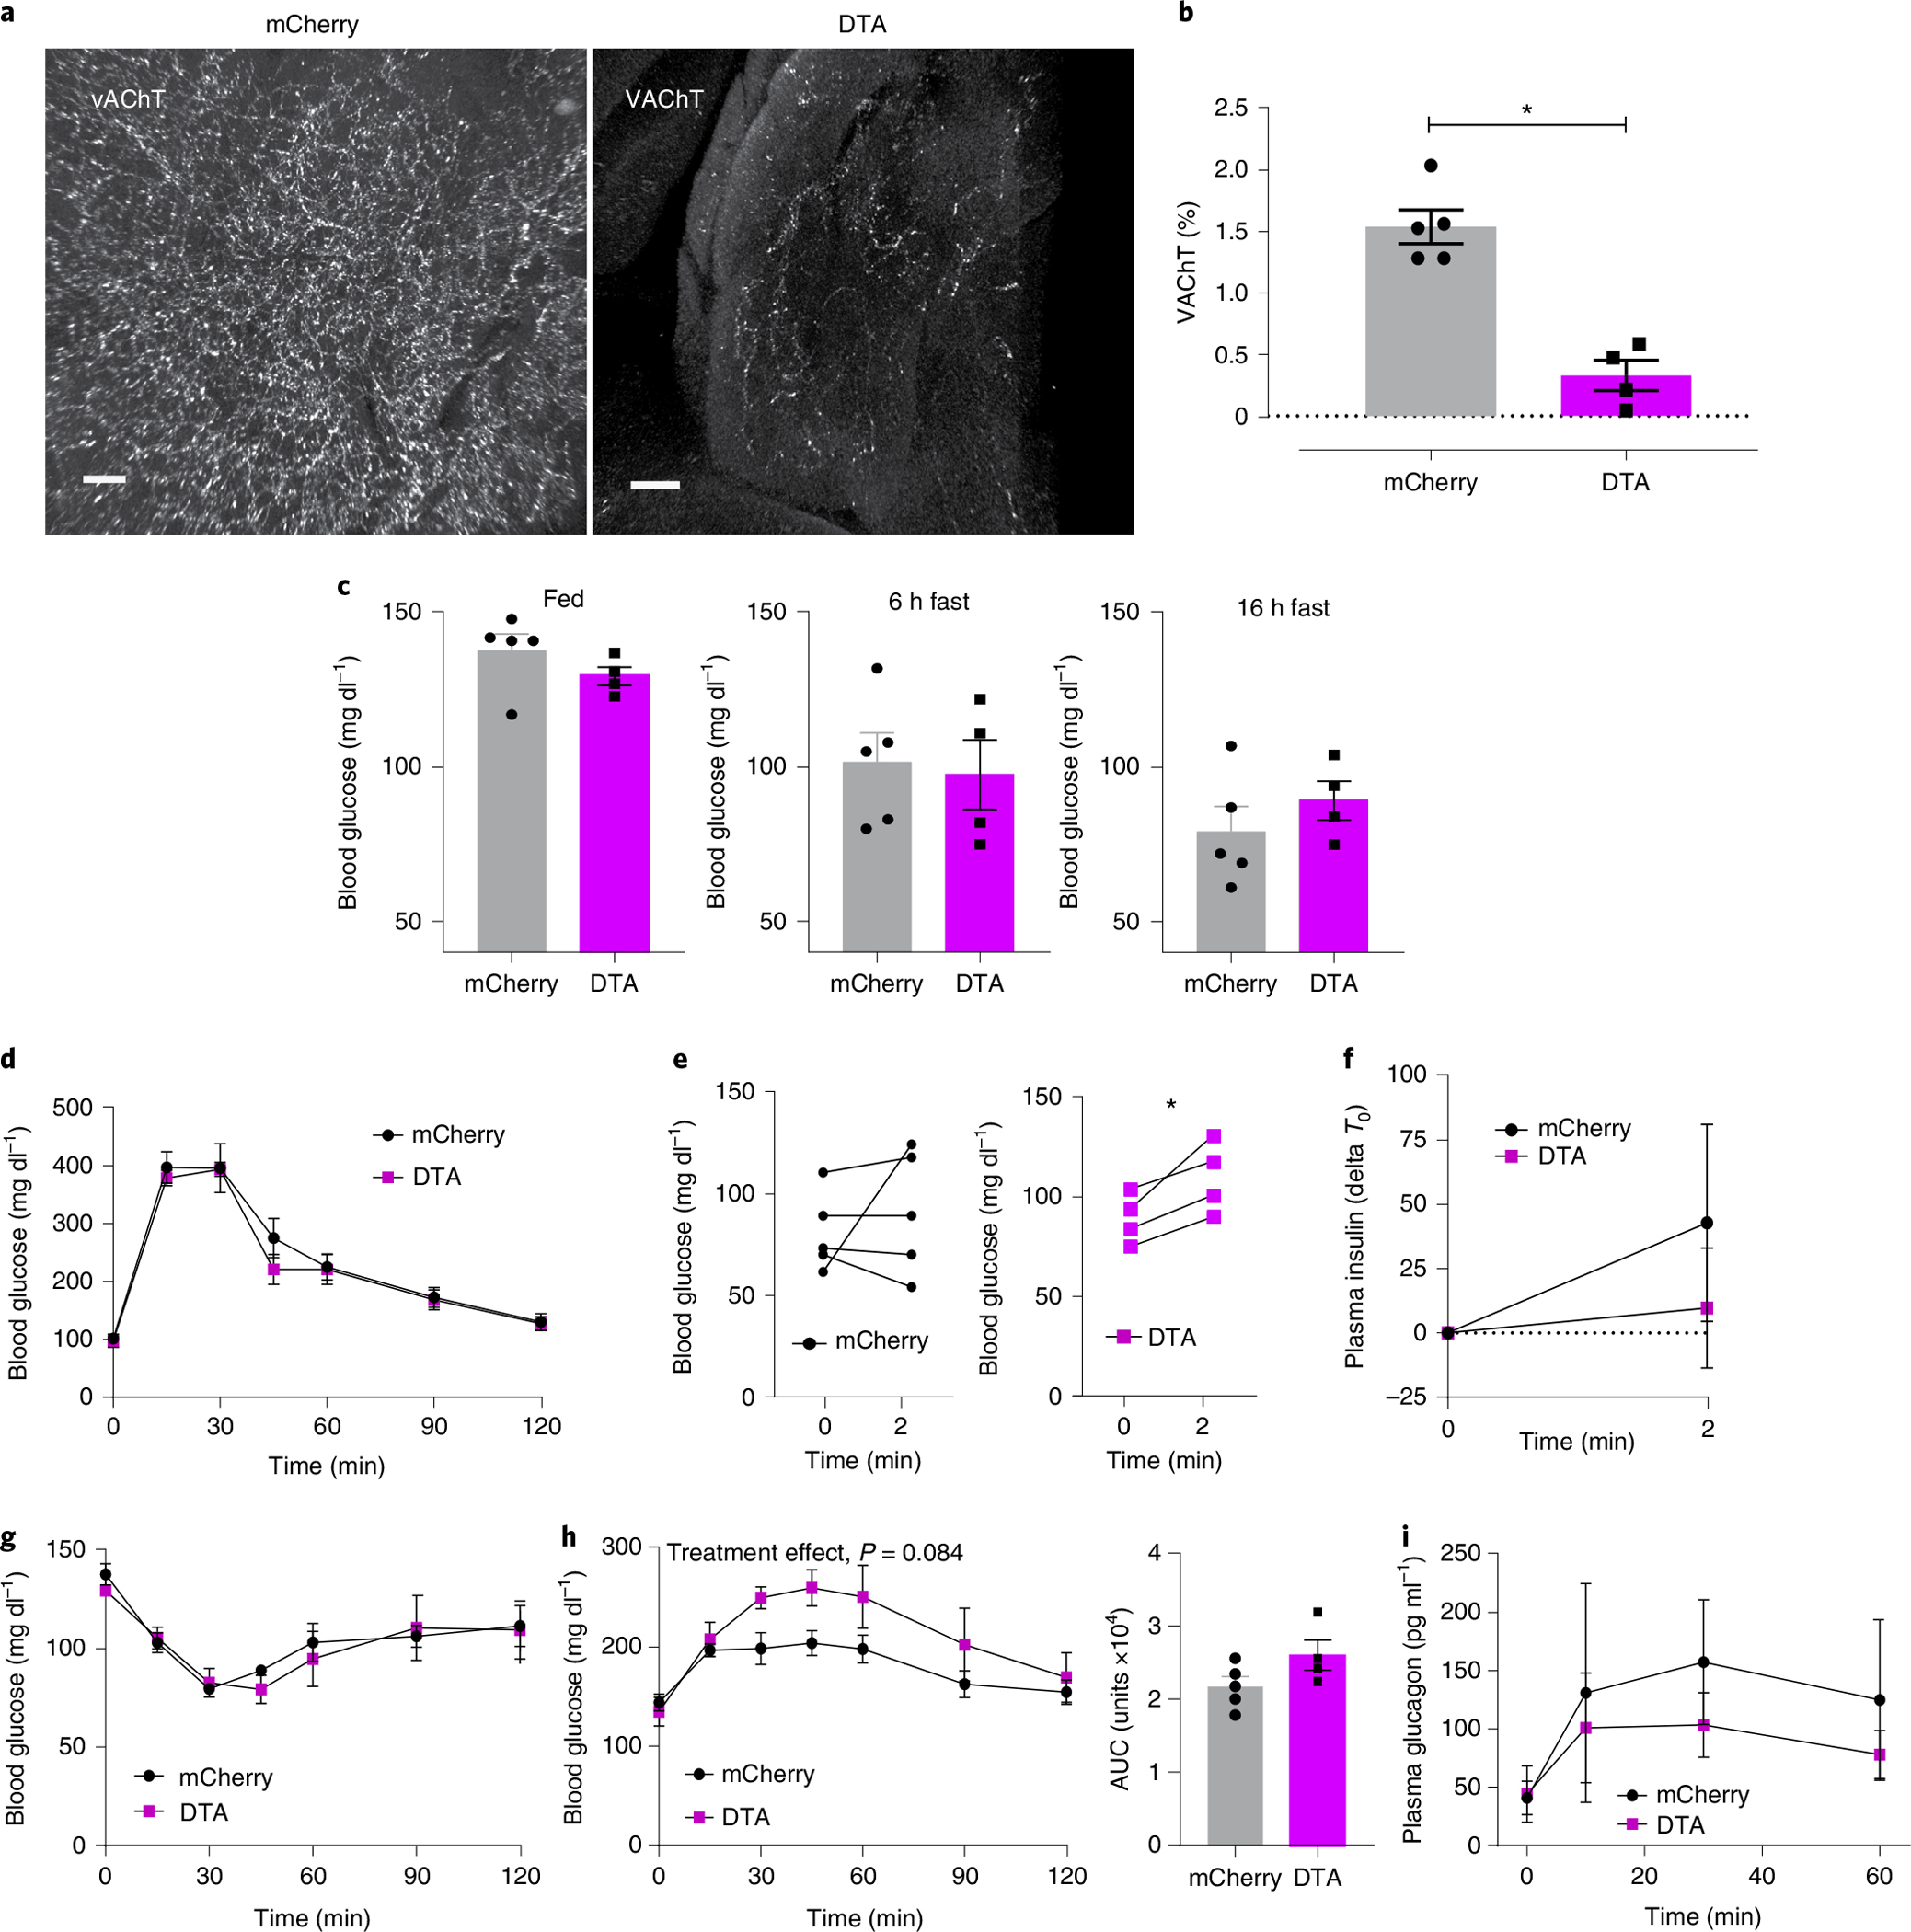
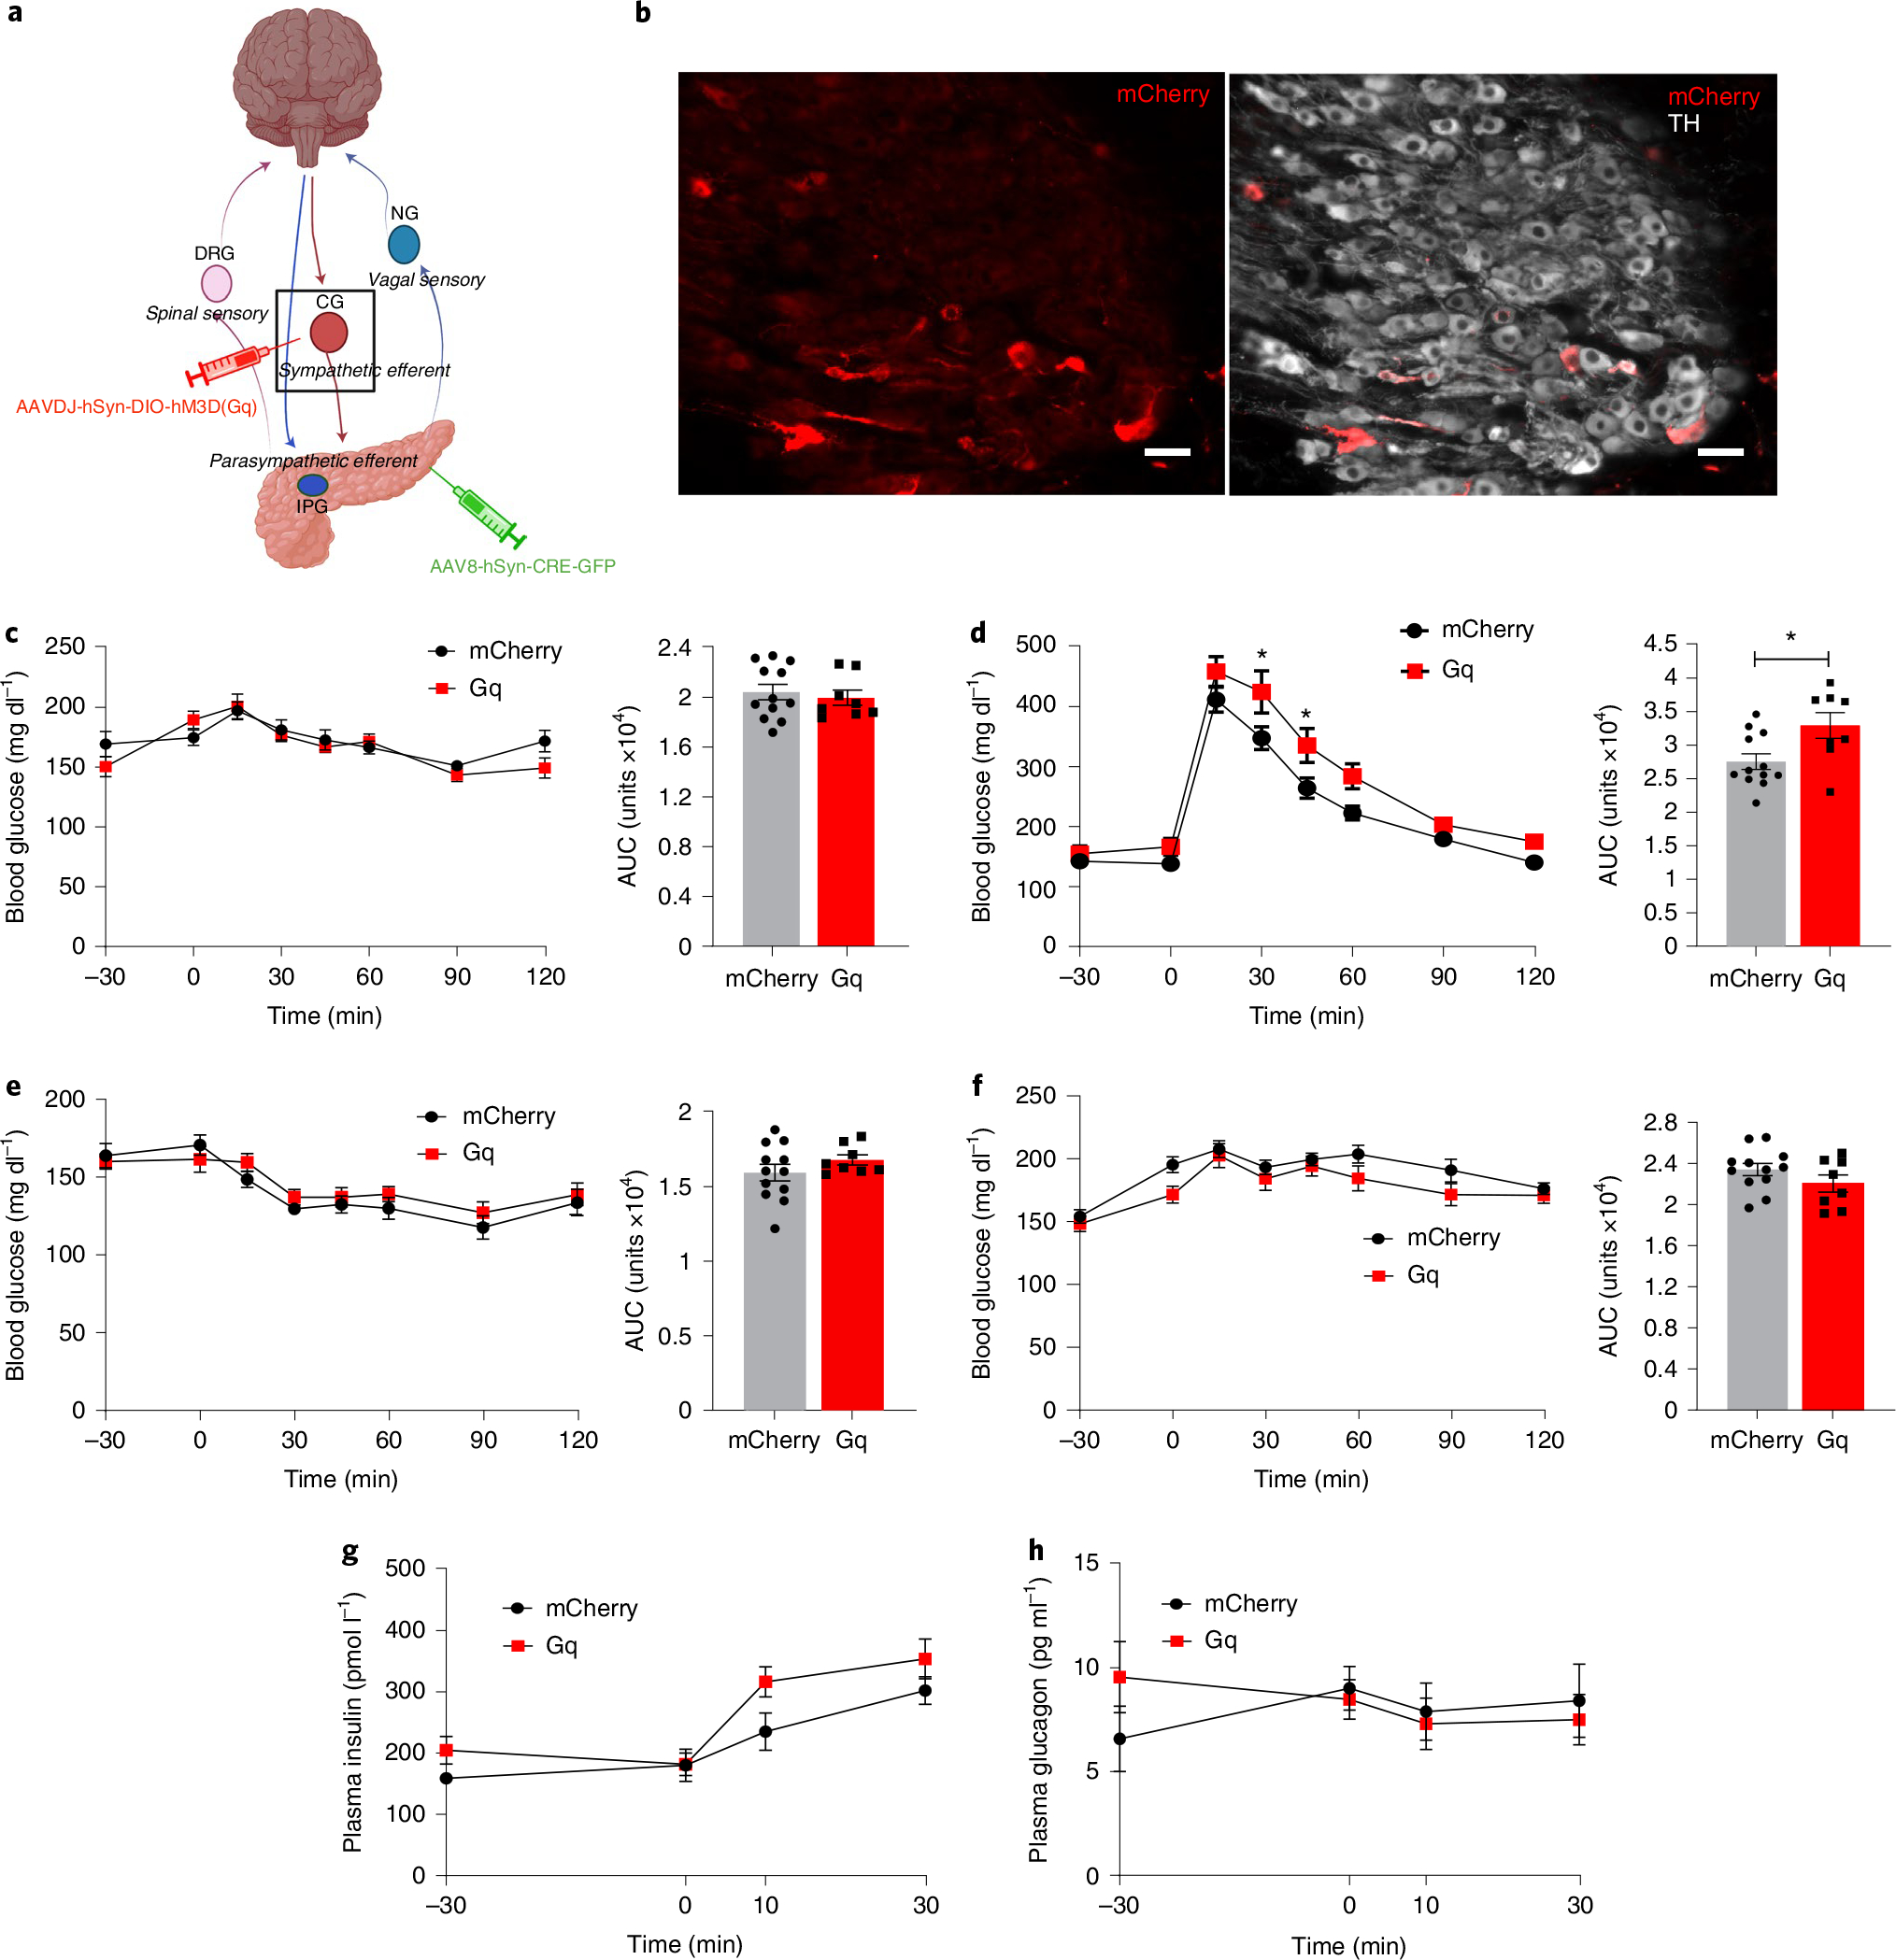
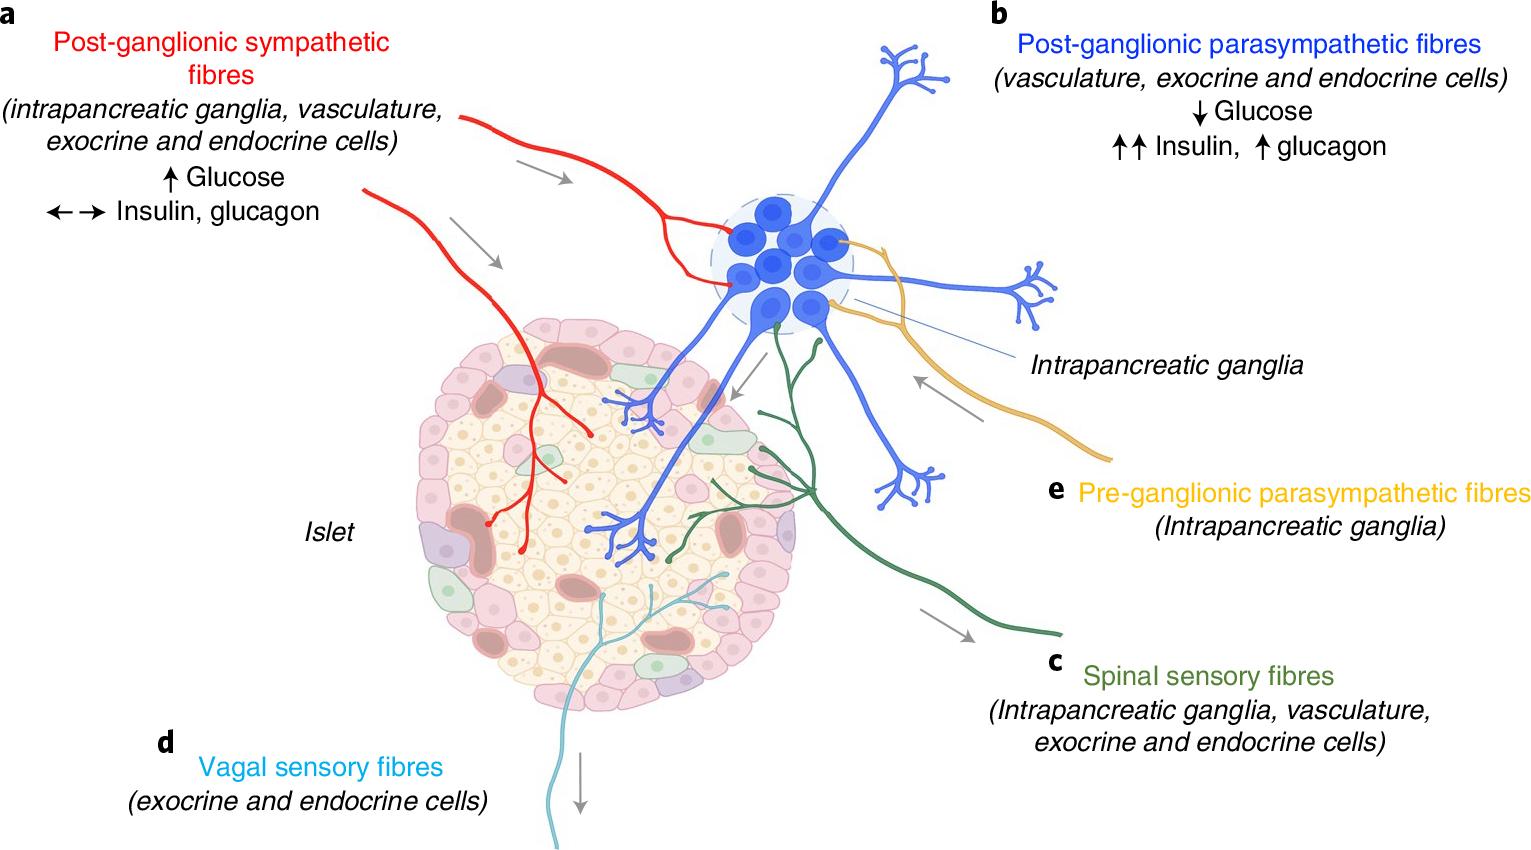
A lack of comprehensive mapping of ganglionic inputs into the pancreas and of technology for the modulation of the activity of specific pancreatic nerves has hindered the study of how they regulate metabolic processes. Here we show that the pancreas-innervating neurons in sympathetic, parasympathetic and sensory ganglia can be mapped in detail by using tissue clearing and retrograde tracing (the tracing of neural connections from the synapse to the cell body), and that genetic payloads can be delivered via intrapancreatic injection to target sites in efferent pancreatic nerves in live mice through optimized adeno-associated viruses and neural-tissue-specific promoters. We also show that, in male mice, the targeted activation of parasympathetic cholinergic intrapancreatic ganglia and neurons doubled plasma-insulin levels and improved glucose tolerance, and that tolerance was impaired by stimulating pancreas-projecting sympathetic neurons. The ability to map the peripheral ganglia innervating the pancreas and to deliver transgenes to specific pancreas-projecting neurons will facilitate the examination of ganglionic inputs and the study of the roles of pancreatic efferent innervation in glucose metabolism.


Conflict of interest statement

Competing interests

S.A.S is a named inventor of the patent ‘Compositions and methods to modulate cell activity’ (US9399063B2). S.A.S. and M.G.K. are co-founders of Redpin Therapeutics, and consult for and have equity in the company. M.G.K. also consults for Meira GTx. All other authors declare no competing interests.

Figures

Extended Data Fig. 1 |
Extended Data Fig. 1 |. Distribution of Ctβ + pancreas-innervating neurons across ganglia.
a) Distribution of CTβ + pancreas-innervating neurons between ganglia (number of CTβ + pancreas-innervating neurons in specified ganglia/total number of CTβ + pancreas-innervating neurons in all ganglia) using intrapancreatic injection (IP, grey bars, upper panel) and comparison with intraductal infusion (ID, blue bars). N = 3 mice/ ganglia. b) Size distribution of CTβ + pancreas-innervating neurons in ganglia. Statistical analyses are described in Supplementary Table 3.
Extended Data Fig. 2 |
Extended Data Fig. 2 |. Off-target expression after intrapancreatic delivery of AAV.
a) Off-target mCherry expression in kidney, muscle and heart, 4 weeks after intrapancreatic AAV8-hSyn-mCherry injection. Scale bars: 50 μm. b) Expression of mCherry 4 weeks after intrapancreatic injection of AAV8-hSyn-mCherry injection (serotypes 6, 8, 9 and rg). c) Images of mCherry and Synapsin in enteric nerves (duodenum). Scale bars: 100 μm. Quantification of viral expression as mCherry+ volume within Synapsin+ volume (bottom panel). n = 4 mice/group. d) Images of mCherry and Synapsin in mesenteric fibers. Scale bars: 50 μm. Quantification of mCherry+ volume within Synapsin+ volume in mesentery (bottom panel). n = 3 mice/group. e) Images of hindbrain stained for mCherry. Scale bars: 100 μm. Right panel: mCherry+ expression as percentage (upper) and total number (lower), n = 5 mice/group. f) Images of mCherry in liver. Scale bars: 50 μm. Right panel: expression of mCherry+ cells as percentage (upper) and total number (lower), n = 5 mice/group. g) Images of mCherry in spleen. Scale bars: 50 μm. Right: expression of mCherry+ cells as percentage (upper) and total number (lower), n = 5 mice/group. h) Quantification of mCherry+ neurons in CG, 4 (N = 6 mice) and 12 (N = 5 mice) weeks after intrapancreatic injection of AAV8-hSyn-mCherry, 1*1011 vg. i) Confocal images (left) and 3D volume segmentation analysis (right) of mCherry + /NF200 + intrapancreatic ganglia after intrapancreatic delivery of AAV8-hsyn-mCherry. N = 88 ganglia from 20 mice in 5 independent studies. Scale bar: 30 μm. Statistical analyses are described in Supplementary Table 3.
Extended Data Fig. 3 |
Extended Data Fig. 3 |. Neuronal specific promoters for gene delivery into pancreatic innervation.
a) Schematic representation of AAV plasmid constructs. b) Immunofluorescence images of HEK293T and Neuro2A cells after transfection with pJeT-mCherry, phSyn-mCherry and pNSE-mCherry. Scale bars: 50 μm. c) Percentage of total cells (left) or percentage of relative to JeT-mcherry expressing mCherry+ cells in HEK293T and N2A after transfection with pJet-mCherry, phSyn-mCherry and pNSE-mCherry. N = 3 independent experiments. d) Fluorescence intensity of mCherry + (left) or relative to JeT-mCherry in HEK293T and N2A after transfection with pJet-mCherry, phSyn-mCherry and pNSE-mCherry. N = 3 independent experiments. e) Quantification of mCherry expression in primary DRG neurons after transfection with phSyn-mCherry and pNSE-mCherry (left panel) and fluorescence/transmitted light images (middle and right panels) showing mCherry (red). Scale bar: 25 μm. N = 3 independent experiments. f) Percentage of CG neurons expressing mCherry+ after intrapancreatic injection of AAV8-hSyn-mCherry and AAV8-NSE-mCherry (left panel) and corresponding images of iDISCO+ cleared CG (middle and right panels). Scale bars: 100 μm. N = 6 samples/group. g) Immunofluorescence image of mCherry expression in liver after intrapancreatic injection of AAV8-NSE-mCherry. Scale bars: 50 μm. Statistical analyses are described in Supplementary Table 3.
Extended Data Fig. 4 |
Extended Data Fig. 4 |. CNo does not affect Gtt in wild-type (Wt) mice and female ChAt-iRES-cre/AAV8-Syn-dio-hM3d(Gq)-mCherry.
a) GTT in WT mice with CNO (ip, 3 mg/kg) or vehicle (10%DMSO). Right: Cumulative blood glucose change (AUC, 0′ to 120′). N = 10. Blood glucose in male ChAT-IRES-cre/AAV8-Syn-DIO-hM3D(Gq)-mCherry (N = 5) and ChAT-IRES-cre/AAV8-hSyn-DIO-mCherry (N = 8). b) After 6 h fasted with CNO treatment (3 mg/kg ip) over 240 mins. Right: cumulative blood glucose change (AUC, 0′ to 240′). c) During GTT after 6 h fast (vehicle at −30min, glucose 2 mg/kg at 0 min). Right: cumulative blood glucose change (AUC, 0′ to 120′). d) During GTT after 6 h fast (CNO at −180min, glucose 2 mg/kg at 0 min). Right: cumulative blood glucose change (AUC, 0′ to 120′). Blood glucose in female CNO-treated ChAT-IRES-cre/AAV8-hSyn-DIO-hM3D(Gq)-mCherry (N = 5) and ChAT-IRES-cre/AAV8-hSyn-DIO-mCherry (n = 7) mice (CNO: 3 mg/kg, intraperitoneal). e) After 6 h fast. Right: cumulative blood glucose change (AUC, 0′ to 120′). f) During ITT (CNO at −30min, Insulin 0.25U/kg i.p. at 0 min). g) During GTT after 6 h fast (CNO at −30min, glucose 2 mg/kg at 0 min). h) During GTT with atropine methyl nitrate (2 mg/kg, i.p.). i) During GTT after 6 h fast (CNO at −180min, glucose 2 mg/kg at 0 min). j) Cumulative blood glucose change (AUC, 0′ to 120′) during GTT. k) Cumulative blood glucose change (AUC, 0′ to 120′) during GTT with atropine. l) Cumulative blood glucose change (AUC, 0′ to 120′) during GTT 180 mins after CNO. m) Plasma insulin during GTT at −30, 0, and 10 mins. n) Plasma glucagon during GTT at −30, 0, 10, 30, 60 and 90 mins. o) Plasma glucagon during ITT at −30, 0, 10, 30, and 60 mins. Statistical analyses are described in Supplementary Table 3.
Fig. 1 |
Fig. 1 |. The pancreas is innervated by neurons in coeliac, nodose, dorsal root and intrapancreatic ganglia.
a, Schematic representation of pancreas innervation. b, Maximum projections of lightsheet microscopy images of mouse pancreatic samples cleared with iDISCO+ and stained for insulin (blue) and vesicular acetylcholine transporter, VAChT (white, left), or tyrosine hydroxylase, TH (white, right). Scale bars, 300 μm. c, Representative confocal images of CTβ+ pancreas-innervating neurons (red, top row) in cleared peripheral ganglia (CG, NG, DRG and IPG) after intrapancreatic injection. Bottom row shows CTβ+ pancreas-innervating neurons (red) and endogenous fluorescence (EF) (white) for CG, NG and DRG. Upper right panel shows synapsin (SYN) marking intrapancreatic ganglia (white) and insulin (blue), bottom right panel shows CTβ+ pancreas-innervating neurons (red) and insulin (blue). Scale bars, 100 μm. d, Representative segmentation of CTβ+ pancreas-innervating neurons in CG showing CTβ+ pancreas-innervating neurons (red, top left side) and 3D volumes colour-coded for size (bottom left side). Two independent studies (3 and 2 ganglia, respectively). Scale bar, 100 μm. e, Quantification of CTβ+ pancreas-innervating neurons as total number per ganglion (left) and percentage of the total neurons per ganglion (number of CTβ+ pancreas-innervating neurons in specified ganglia/total number of neurons in specified ganglia) (right) after intrapancreatic injection of CTβ. Data are shown for left and right DRG at T10 and T13 (L-DRG10, L-DRG13, R-DRG10 and R-DRG13). Biologically independent sample numbers: CG, 4 samples; L-NG, 4 samples; R-NG, 4 samples; L-DRG10, 5 samples; L-DRG13, 5 samples; R-DRG10, 4 samples; and R-DRG13, 5 samples. f, Volume distribution of CTβ+ pancreas-innervating neurons within each ganglion in CG (left), NG (middle) and DRG (right) (N = 3 mice). All data are represented as mean ± SEM. Individual data points represent individual ganglia. Statistical analyses are described in Supplementary Table 2. Figure 1a was created with BioRender.com.
Fig. 2 |
Fig. 2 |. AAV serotypes selectively target pancreatic autonomic efferent and afferent nerves.
a, Confocal images of iDISCO+ cleared CG, NG and DRG demonstrating mCherry+ pancreas-innervating neurons 4 weeks after intrapancreatic injection of AAV-hSyn-mCherry (top to bottom: serotypes 9, 8, 6 and rAAV2-retro (AAVrg)). Scale bars, 100 μm. N = 4 biologically independent samples. b, Confocal images of iDISCO+ cleared pancreas demonstrating mCherry+ neurons within intrapancreatic ganglia stained for NF200, 4 weeks after intrapancreatic injection of AAV-hSyn-mCherry. N = 4 biologically independent samples. Scale bars, 50 μm. c, Quantification of mCherry+ pancreas-innervating neurons in CG (top), NG (middle) and DRG (bottom), 4 weeks after intrapancreatic injection of AAV-hSyn-mCherry (left: percentage of total neurons per ganglion; right: total number per ganglion). d, Quantification of mCherry+ pancreas-innervating neurons in intrapancreatic ganglia, 4 weeks after intrapancreatic injection of AAV-hSyn-mCherry (mCherry volume as percentage of NF200+ volume of the ganglia). All data represented as mean ± SEM. e, Confocal image demonstrating specific neural expression of AAV8-hSyn-mCherry in intrapancreatic ganglia immunolabelled with NF200 with adjacent islet of Langerhans. Top left, mCherry (red) and insulin (green); top right, mCherry (red) and NF200 (blue); bottom left, NF200 (blue) and insulin (green); bottom right, mCherry (red), NF200 (blue) and insulin (green). Scale bars, 50 μm. Biologically independent samples: c, left and right: for CG n = 11 (AAV9), 6 (AAV8), 9 (AAV6), 4 (AAVrg); for NG n = 7 (AAV9), 9 (AAV8), 6 (AAV6), 8 (AAVrg); and for DRG: n = 16 (AAV9), 7 (AAV8), 8 (AAV6), 11 (AAVrg); d, n = 4 animals per group. Statistical analyses are described in Supplementary Table 2.
Fig. 3 |
Fig. 3 |. Optimization of gene delivery.
a, Images of CTβ+ neurons in iDISCO+ cleared CG after CTβ delivery by IP injection (top) or ID infusion (bottom). Scale bars, 50 μm. Left, CTβ+ neurons (red) and endogenous fluorescence (EF, blue); right, CTβ+ neurons (red) alone. b, Quantification of CTβ neurons in peripheral ganglia after IP or ID delivery (percentage of total neurons). c, Images of mCherry+ neurons in iDISCO+ cleared CG after AAV8-hSyn-mCherry delivery (top: IP, dose 1X, 1 × 10¹¹ vg; bottom: ID, dose 10X, 1X 1 × 1012 vg). Scale bars, 50 μm. d, Quantification of mCherry+ pancreas-innervating neurons in CG after AAV8-hSyn-mCherry delivery (IP doses: 1X, 1 × 10¹¹ vg; 5X, 5 × 10¹¹ vg; ID doses: 1X, 1 × 10¹¹ vg; 5X, 5 × 10¹¹ vg; 10X, 1X 1 × 1012 vg) (percentage of total neurons). e, Images of mCherry+ neurons in NG and DRG after AAV8-hSyn-mCherry delivery (ID dose 10X). Scale bars, 100 μm. f, Quantification of mCherry+ neurons in NG (top) and DRG (bottom) after AAV8-hSyn-mCherry delivery (IP doses: 1X, 1 × 10¹¹ vg; 5X, 5 × 10¹¹ vg; ID doses: 1X, 1 × 10¹¹ vg; 5X, 5 × 10¹¹ vg; 10X, 1X 1 × 1012 vg) (left: percentage of total neurons; right: total number per ganglion). All data represented as mean ± SEM. Biologically independent samples: for b, intrapancreatic: N = 4 samples each for CG, L-NG, R-NG, L-DRG13 and R-DRG-10, and 5 samples each for L-DRG10 and R-DRG13. Intraductal: N = 3 samples for CG, 4 samples each for L-NG, R-DRG10 and R-NG, 5 samples each for L-DRG10 and L-DRG13, and 6 samples for R-DRG13. For d: N = 6 samples for IP1X, 4 each for IP5X, ID5X and ID10X, and 5 for ID1X. For f, top: N = 9 samples each for IP1X and IP5X, 7 each for ID1X and ID10X, and 5 for ID5X. Bottom: N = 7 samples for IP1X, 12 each for IP5X and ID10X, and 11 for ID1X. Statistical analyses are described in Supplementary Table 2.
Fig. 4 |
Fig. 4 |. Combined strategy for restricted gene expression in pancreatic innervation.
a, Schematic representation of liver-detargeting construct showing hSyn promoter, mCherry fluorescent protein, miR122 target site (miR122TS) in triplicate, woodchuck hepatitis virus post-transcriptional regulatory element (WPRE) and human growth hormone polyA (hGHpA). b, Representative immunofluorescence images of HEK293T (293T) and AML12 clonal cells after transfection with phSyn-mCherry and phSyn-mCherry-miR122TS (red). DAPI in blue. Scale bars, 200 μm. c, Quantification of absolute (left) and relative (right) fluorescence intensity of mCherry+ cells in transfected 293T and AML12 clonal cells. d, Representative immunofluorescence images of liver sections (top) and maximum projection of confocal images of mCherry+ pancreas-innervating neurons in CG (bottom), 4 weeks after intrapancreatic injection of AAV8-hSyn-mCherry (left) or AAV8-hSyn-mCherry-miR122TS (right). Scale bars, 25 μm for liver sections; 100 μm for CG. e, Representative immunofluorescence images of liver sections 4 weeks after intrapancreatic injection of AAV8-hSyn-mCherry, stained for mCherry (red) and synapsin (white), showing no overlap of mCherry+ off-target expression with synapsin+ fibres. Scale bar, 50 μm. f, Representative immunofluorescence images of liver sections 4 weeks after intrapancreatic injection of AAV8-hSyn-mCherry-miR122TS, stained for mCherry (red) and synapsin (white), showing a decrease in mCherry expression and no overlap mCherry+ off-target expression with synapsin+ fibres. Scale bar, 50 μm. g, Quantification of the percentage of mCherry+ cells in liver sections (left) and CG (right). h, Quantification of % mCherry+ in synapsin+ fibres. i, Raw overlap quantification of mCherry+ and synapsin+ fibres. All data represented as mean ± SEM. Statistical analyses are described in Supplementary Table 2.
Fig. 5 |
Fig. 5 |. Pancreatic parasympathetic activation improves glucose control.
a, Schema of parasympathetic intrapancreatic ganglia. b, Blood glucose in CNO-treated ChAT-IRES-cre/AAV8-hSyn-DIO-hM3D(Gq)-mCherry and ChAT-IRES-cre/AAV8-hSyn-DIO-mCherry mice (3 mg kg−1, intraperitoneal). After 6 h fasting: right, blood glucose; left, AUC (0 min to 120 min); hM3D(Gq)-mCherry: n = 22, mCherry: n = 21. c, After 16 h fasting: right, blood glucose; left, AUC (0 min to 120 min); hM3D(Gq)-mCherry: n = 5, mCherry: n = 8. d, During glucose tolerance testing (GTT) after 6 h fasting (CNO at −30 min, glucose 2 mg kg−1 at 0 min): right, blood glucose; left, AUC (0 min to 120 min); hM3D(Gq)-mCherry: n = 22, mCherry: n = 21. e, During GTT with atropine methyl nitrate (2 mg kg−1, i.p.): right, blood glucose; left, AUC (0 min to 120 min); hM3D(Gq)-mCherry: n = 5, mCherry: n = 8. f, Blood glucose during insulin tolerance testing (ITT) (0.25 U kg−1, i.p.); hM3D(Gq)-mCherry: n = 5, mCherry: n = 8. g, Plasma insulin during GTT at −30, 0 and 10 min; hM3D(Gq)-mCherry: n = 15, mCherry: n = 19. h, Plasma glucagon during GTT at −30, 0, 10, 30, 60 and 90 min; hM3D(Gq)-mCherry: n = 16, mCherry: n = 20. i, Plasma glucagon during ITT at −30, 0, 10, 30 and 60 min; hM3D(Gq)-mCherry: n = 16, mCherry: n = 20. All data represented as mean ± SEM. Statistical analyses are described in Supplementary Table 2. Figure 5a was created with BioRender.com.
Fig. 6 |
Fig. 6 |. Effects of ablation of parasympathetic pancreatic innervation.
a, Representative confocal images of iDISCO+ cleared pancreatic parasympathetic innervation (VAChT (white)) 4 weeks after intraductal delivery of AAV8-EF1a-mCherry-flex-dtA or AAV8-EF1a-DIO-mCherry in ChAT-IRES-CRE mice. Scale bars, 100 μm. b, Quantification of VAChT+ innervation density, as percentage of total pancreas tissue volume, showing a substantial decrease in parasympathetic innervation in ChAT-DTA mice. c, Blood glucose levels of ChAT-DTA and ChAT-mCherry mice in fed (9:00 a.m.), 6 h fasted (3:00 p.m.) and 16 h fasted (9:00 a.m.) states. d, Glucose tolerance test (i.p., 2 mg kg−1) in ChAT-DTA (N = 4) and ChAT-mCherry (N = 5) mice showing no differences in normal glucose tolerance. e, Blood glucose levels are substantially increased within 2 min of oral glucose intake (licking) in ChAT-DTA (N = 4) in comparison with ChAT-mCherry mice (N = 5). f, Plasma insulin levels before and after 2 min of oral glucose intake in ChAT-DTA (N = 4) and ChAT-mCherry mice (N = 5). g, Insulin tolerance test (i.p., 0.25 U kg−1) in ChAT-DTA (N = 4) and ChAT-mCherry (N = 5) mice showing no differences in blood glucose. h, Right: blood glucose levels in response to 2DG (i.p., 200 mg kg−1) in ChAT-DTA (N = 4) and ChAT-mCherry mice (N = 5). Left: cumulative change in blood glucose (AUC, 0 min to 120 min). i, Plasma glucagon levels in response to 2DG in ChAT-DTA (N = 4) and ChAT-mCherry mice (N = 5). All data represented as mean ± SEM. Individual data points represent individual mice. Statistical analyses are described in Supplementary Table 2.
Fig. 7 |
Fig. 7 |. Pancreatic sympathetic activation impairs glucose homoeostasis.
a, Schema of pancreas-projecting sympathetic neurons in CG. b, Images of mCherry expression in sympathetic pancreas-projecting neurons in the CG (TH, white) after intracoeliac injection of AAVdj-hSyn-DIO-hM3D(Gq)-mCherry and intrapancreatic injection of AAV8-hSyn-CRE-eGFP. Scale bar, 50 μm. c, Left: blood glucose in CNO-treated (i.p., 3 mg kg−1) AAVdj-hSyn-DIO-hM3D(Gq)-mCherry/AAV8-hSyn-CRE-eGFP mice (N = 8) compared to CNO-treated AAV8-hSyn-DIO-mCherry/AAV8-hSyn-CRE-eGFP mice (N = 12) after 6 h fasting. Right: cumulative blood glucose change (AUC, 0 min to 120 min). d, Left: blood glucose during GTT in CNO-treated (i.p., 3 mg kg−1 at −30 min) AAVdj-hSyn-DIO-hM3D(Gq)-mCherry/AAV8-hSyn-CRE-eGFP mice (N = 8) compared to CNO-treated AAV8-hSyn-DIO-mCherry/AAV8-hSyn-CRE-eGFP mice (N = 12) after 6 h fasting. Right: cumulative blood glucose change (AUC, 0 min to 120 min). e, Left: blood glucose during insulin tolerance test (i.p., 0.25 U kg−1) in CNO-treated AAVdj-hSyn-DIO-hM3D(Gq)-mCherry/AAV8-hSyn-CRE-Egfp mice (N = 8) compared to CNO-treated AAV8-hSyn-DIO-mCherry/AAV8-hSyn-CRE-eGFP mice (N = 12) without fasting. Right: cumulative blood glucose change (AUC, 0 min to 120 min). f, Left: blood glucose during pyruvate tolerance test (i.p., 1 g kg−1) in CNO-treated AAVdj-hSyn-DIO-hM3D(Gq)-mCherry/AAV8-hSyn-CRE-eGFP mice (N = 8) compared to CNO-treated AAV8-hSyn-DIO-mCherry/AAV8-hSyn-CRE-eGFP mice (N = 12) without fasting. Right: cumulative blood glucose change (AUC, 0 min to 120 min). g, Plasma insulin during GTT at −30, 0, 10 and 30 min (AAVdj-hSyn-DIO-hM3D(Gq)-mCherry/AAV8-hSyn-CRE-eGFP mice (N = 8), AAV8-hSyn-DIO-mCherry/AAV8-hSyn-CRE-Egfp mice (N = 12)). h, Plasma glucagon during GTT at −30, 0, 10 and 30 min (AAVdj-hSyn-DIO-hM3D(Gq)-mCherry/AAV8-hSyn-CRE-eGFP mice (N = 8), AAV8-hSyn-DIO-mCherry/AAV8-hSyn-CRE-Egfp mice (N = 9)). All data represented as mean ± SEM. Individual data points represent individual mice. Statistical analyses are described in Supplementary Table 2. Figure 7a was created with BioRender.com.
Fig. 8 |
Fig. 8 |. Summary of islet innervation.
ad, Islets receive direct innervation from post-ganglionic sympathetic fibres with cell bodies in coeliac ganglia (a), post-ganglionic parasympathetic fibres with cell bodies in the intrinsic intrapancreatic ganglia (b), spinal sensory fibres with cell bodies in dorsal root ganglia (c) and vagal sensory fibres with cell bodies in nodose ganglia (d). e, Pre-ganglionic parasympathetic fibres, sympathetic and spinal sensory fibres also innervate intrapancreatic ganglia. Chemogenetic activation of intrapancreatic ganglia lowered blood glucose, markedly increased insulin and moderately increased glucagon. Chemogenetic activation of pancreas-projecting sympathetic neurons increased blood glucose without substantial effects on insulin or glucagon. Figure was created with BioRender.com.

Similar articles

Cited by

References

    1. Grapin-Botton A Ductal cells of the pancreas. Int. J. Biochem. Cell Biol. 37, 504–510 (2005). - PubMed
    1. Röder PV, Wu B, Liu Y & Han W Pancreatic regulation of glucose homeostasis. Exp. Mol. Med. 48, e219 (2016). - PMC - PubMed
    1. Guenat E et al. Counterregulatory responses to hypoglycemia in patients with glucokinase gene mutations. Diabetes Metab. 26, 377–384 (2000). - PubMed
    1. Thorens B Neural regulation of pancreatic islet cell mass and function. Diabetes Obes. Metab. 16, 87–95 (2014). - PubMed
    1. Yamamoto H, Nagai K & Nakagawa H Bilateral lesions of the SCN abolish lipolytic and hyperphagic responses to 2DG. Physiol. Behav. 32, 1017–1020 (1984). - PubMed

Publication types