. 2022 Aug;7(8):1180-1188.
doi: 10.1038/s41564-022-01163-3. Epub 2022 Jul 14.

Neutralizing antibody activity against 21 SARS-CoV-2 variants in older adults vaccinated with BNT162b2

Affiliations

Neutralizing antibody activity against 21 SARS-CoV-2 variants in older adults vaccinated with BNT162b2

Joseph Newman et al. Nat Microbiol. 2022 Aug.

Abstract

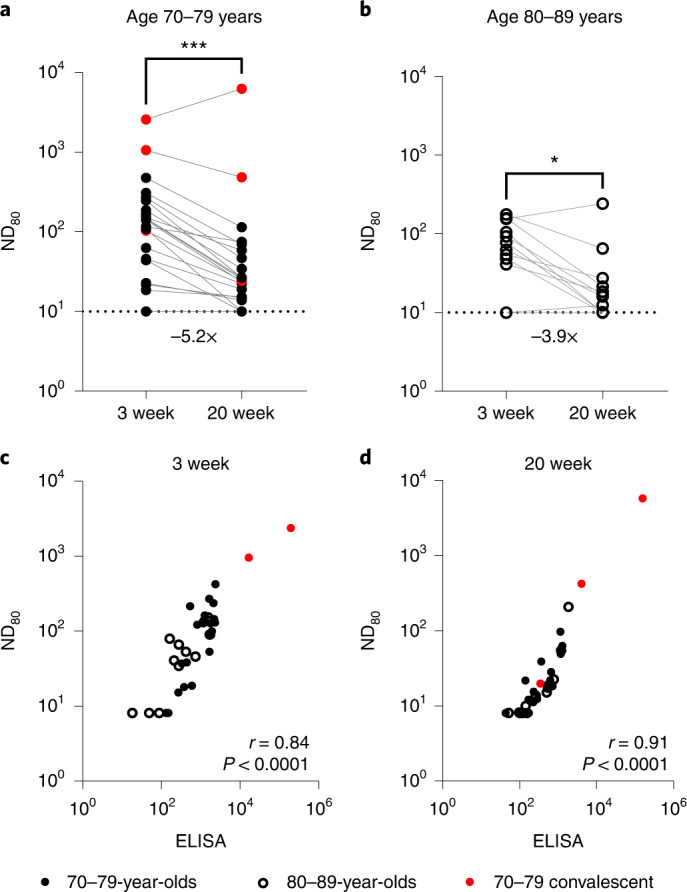
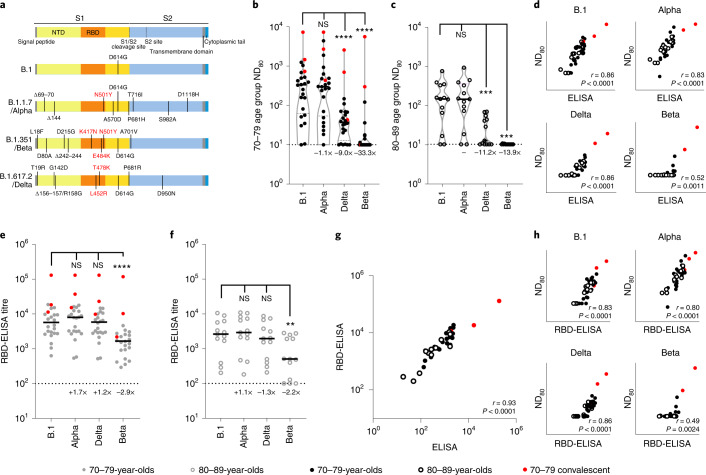
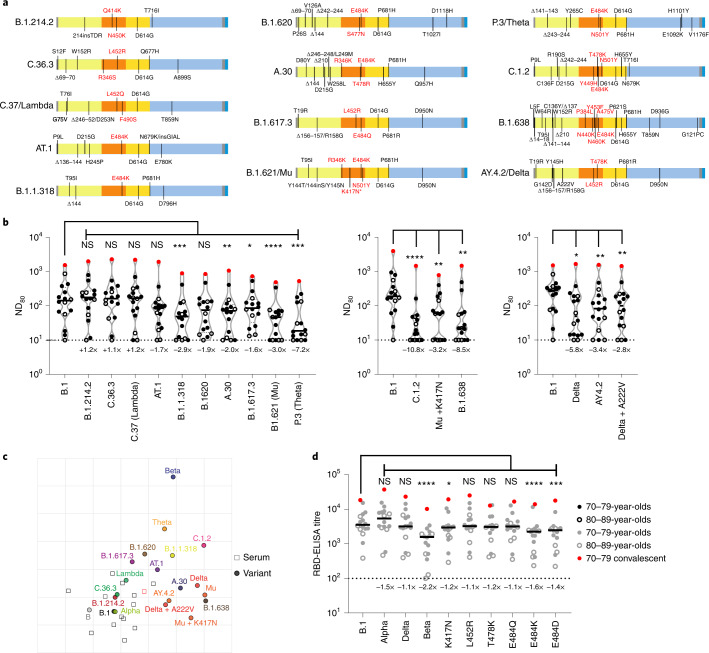
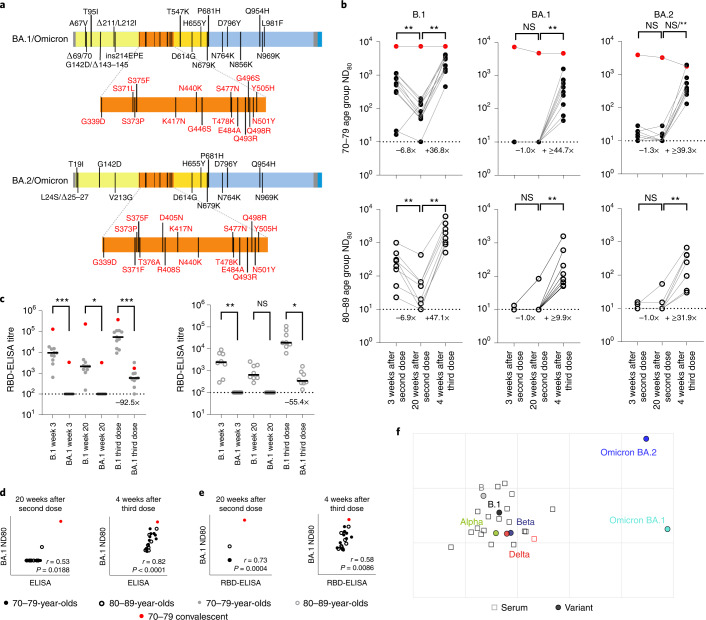
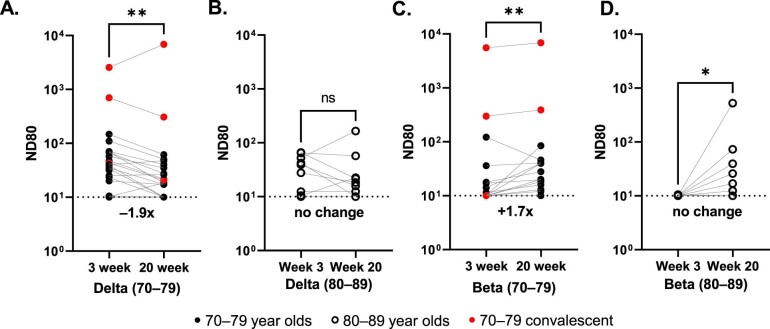
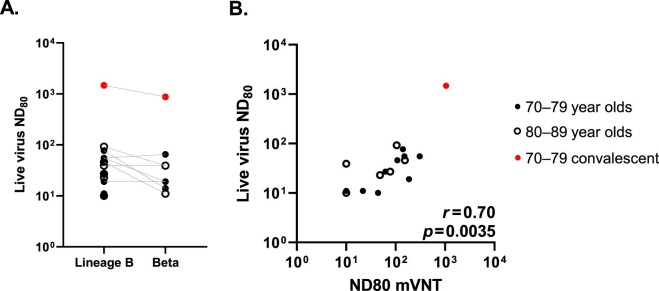
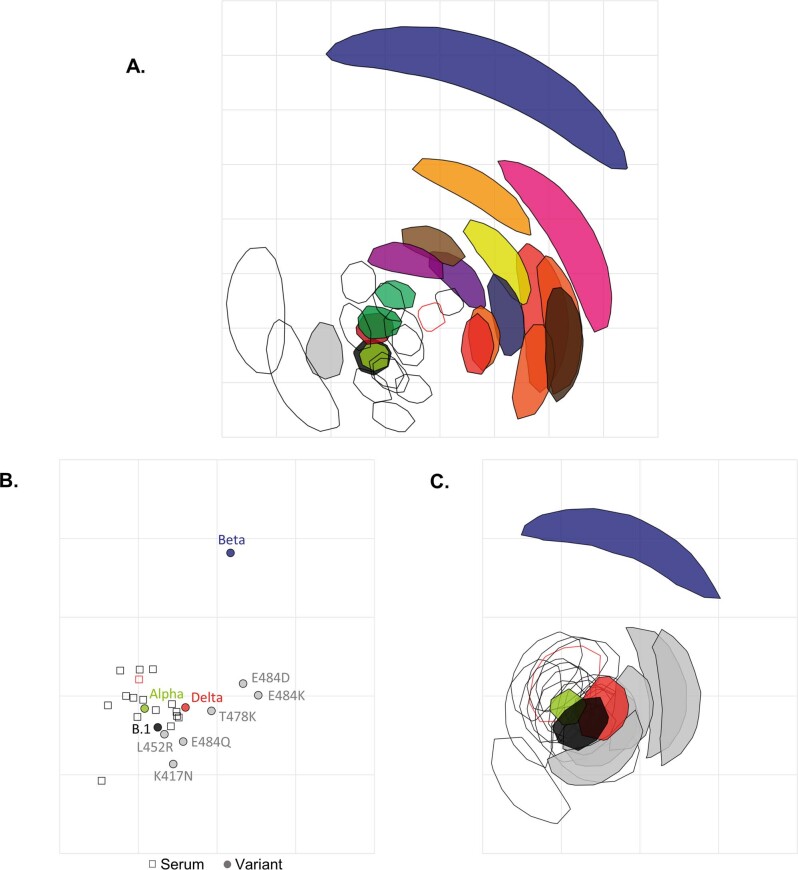
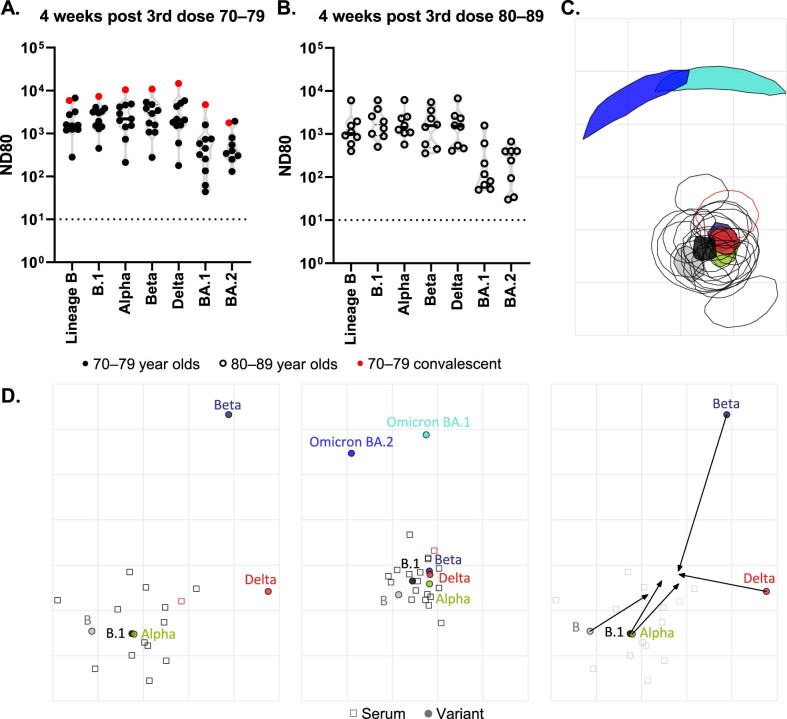
SARS-CoV-2 variants may threaten the effectiveness of vaccines and antivirals to mitigate serious COVID-19 disease. This is of most concern in clinically vulnerable groups such as older adults. We analysed 72 sera samples from 37 individuals, aged 70-89 years, vaccinated with two doses of BNT162b2 (Pfizer-BioNTech) 3 weeks apart, for neutralizing antibody responses to wildtype SARS-CoV-2. Between 3 and 20 weeks after the second vaccine dose, neutralizing antibody titres fell 4.9-fold to a median titre of 21.3 (neutralization dose 80%), with 21.6% of individuals having no detectable neutralizing antibodies at the later time point. Next, we examined neutralization of 21 distinct SARS-CoV-2 variant spike proteins with these sera, and confirmed substantial antigenic escape, especially for the Omicron (B.1.1.529, BA.1/BA.2), Beta (B.1.351), Delta (B.1.617.2), Theta (P.3), C.1.2 and B.1.638 spike variants. By combining pseudotype neutralization with specific receptor-binding domain (RBD) enzyme-linked immunosorbent assays, we showed that changes to position 484 in the spike RBD were mainly responsible for SARS-CoV-2 neutralizing antibody escape. Nineteen sera from the same individuals boosted with a third dose of BNT162b2 contained higher neutralizing antibody titres, providing cross-protection against Omicron BA.1 and BA.2. Despite SARS-CoV-2 immunity waning over time in older adults, booster vaccines can elicit broad neutralizing antibodies against a large number of SARS-CoV-2 variants in this clinically vulnerable cohort.


Conflict of interest statement

The authors declare no competing interests.

Figures

Fig. 1
Fig. 1. Neutralizing antibody responses generated following BNT162b2 vaccination.
a,b, Neutralization titres calculated using pseudotypes bearing the SARS-CoV-2 D614 (lineage B) spike and sera from a cohort of BNT162b2-vaccinated individuals (n = 37 biologically independent samples), recruited as part of the UK CONSENSUS trial, aged 70–79 (n = 24, solid circles) (a) or 80–89 (n = 13, open circles) (b). Symbols in red represent SARS-CoV-2 nucleoprotein-ELISA-positive samples, indicative of previous infection. Serum was collected from the same individuals at 3 (n = 37 total) and 20 weeks (n = 35 total) after the second dose, with a vaccination interval of 3 weeks between the first and second doses. Titres are expressed as serum fold dilution required to achieve 80% virus neutralization, with the titre (ND80) calculated by xy interpolation from the mVNT data series (dilution, x versus luciferase activity, relative light units, y). Statistical comparison of ND80 titres at 3 and 20 weeks was performed using a Wilcoxon two-tailed matched-pairs signed rank test (*P < 0.05; ***P < 0.001). Fold changes in median ND80 between 3 and 20 weeks are indicated. The lower detection limit of the assay is defined as a titre of 10 (dotted line). The upper limit of detection at 3 weeks after the second dose is defined as a titre of 2,560 and at 20 weeks after the second dose as a titre of 7,290. VNTs were repeated to account for low titres and subsequent dilution series were adjusted accordingly (Supplementary Fig. 1). c,d, The correlation between ND80 and S ELISA (S Roche) titres recorded from each volunteer was examined at 3 (n = 37) (c) and 20 (n = 35) (d) weeks after the second dose, with statistical analysis of the matrix performed using a non-parametric Spearman correlation (r).
Fig. 2
Fig. 2. Neutralization of SARS-CoV-2 VOC by sera collected from BNT162b2-vaccinated individuals 3 weeks after the second dose.
a, Schematic illustration of the spike mutation profiles of B.1, Alpha, Delta and Beta. NTD, N-terminal domain; RBD, receptor binding domain. b,c, Neutralization of pseudotypes bearing the SARS-CoV-2 B.1, Alpha, Delta or Beta spike by sera (n = 37 biologically independent samples) were compared in age-stratified cohorts: 70–79 years (n = 24, solid circles) (b) and 80–89 years (n = 13, open circles) (c). Statistical comparison of ND80 titres at 3 and 20 weeks was performed using a Wilcoxon two-tailed matched-pairs signed rank test (***P < 0.001; ****P < 0.0001; NS, not significant). Fold changes in median ND80 compared with B.1 are indicated (lower detection limit = 10 (dotted line), upper detection limit = 2,560 for Delta, 7,290 for B.1, Alpha, Beta). Medians are indicated with a solid line and upper and lower quartiles with dashed lines within the violin plots. df, The correlation between ND80 and S ELISA (S Roche) titres for each volunteer (n = 37) was examined (d), with statistical analysis performed using a non-parametric two-tailed Spearman correlation (r). The same sera (70–79; n = 24, solid circles (e) and 80–89; n = 13, open circles (f)) was analysed with RBD-based ELISA assays, representing B.1, Alpha, Beta and Delta spikes. Horizontal lines represent the median. The equation for determining titre is described in the Methods (RBD-ELISA). Statistical comparison of RBD-ELISA titres was performed using a Friedman test with Dunn’s multiple comparisons of column means (**P < 0.005; ****P < 0.0001). Fold changes in median titre compared with B.1 are indicated. The lower detection limit of the assay is defined as 100 (dotted line). The upper detection limit is defined as 129,600. g,h, The correlation between B.1 RBD-ELISA and S ELISA titres (S Roche) (g) or ND80 titres and the respective RBD-ELISA data for each VOC (h) recorded from each volunteer (n = 37) was then examined, with statistical analysis performed using a non-parametric two-tailed Spearman correlation (r).
Fig. 3
Fig. 3. Neutralization of a broad library of SARS-CoV-2 variants by sera collected from BNT162b2-vaccinated individuals.
a, Schematic illustration of the spike mutation profiles of 13 SARS-CoV-2 variants. The B.1.621/Mu variant has circulated with and without the K417N mutation, indicated by an asterisk. b, Neutralization of pseudotypes bearing these spike proteins were compared using a subsection (n = 16 biologically independent samples) of sera from BNT162b2-vaccinated (3 weeks after the second dose) individuals (70–79, n = 11, solid circles; 80–89, n = 5, open circles). Titration calculations and statistical analyses are as described in Fig. 1 (*P < 0.05; **P < 0.005, ***P < 0.001; ****P < 0.0001; NS, not significant). The separate graphs represent experiments performed on different days. Fold changes in median ND80 compared with B.1 are indicated (lower limit of detection = 10 (dotted line), upper limit of detection = 7,290). c, Two-dimensional antigenic map of variants, based on 3-week post second dose ND80 data. Multidimensional scaling was used to position the sera (open squares, nucleoprotein-based ELISA-positive in red) and variants (solid circles) to best fit target distances derived from the titres. Two sera were not used in mapping because of titres consistently below the lower detection limit. The spacing between grid lines represents 1 AU, equivalent to a twofold dilution in ND80 titres. d, The same sera (70–79, n = 11, solid circles; 80–89, n = 5, open circles) were analysed using RBD-based ELISA assays, representing B.1, Alpha, Beta and Delta spike (data replotted from Fig. 2e,f for comparison) as well as B.1 spikes containing the individual mutations K417N, L452R, T478K, E484Q, E484K and E484D. The equation for determining titre is described in the Methods (RBD-ELISA) and the statistics are as described in Fig. 2 (*P < 0.05; ***P < 0.001; ****P < 0.0001). Fold changes in median titre, compared with B.1 are indicated (lower detection limit = 100 (dotted line), upper detection limit = 129,600). Source data
Fig. 4
Fig. 4. Neutralizing antibody responses to Omicron after a third booster dose of BNT162b2.
a, Schematic illustration of the spike mutation profiles of BA.1 and BA.2 (Omicron). b, Neutralization titres calculated using pseudotypes bearing the SARS-CoV-2 B.1, BA.1 or BA.2 spikes and sera from a cohort of BNT162b2-vaccinated individuals at the indicated time points (n = 19 biologically independent samples; 70–79, n = 11, solid circles; 80–89, n = 8, open circles). Titration calculations and statistical analyses are as described in Fig. 1 (**P < 0.005). Note that the statistical comparison for BA.2 was significant when excluding the individual who tested positive by ELISA for SARS-CoV-2 Nucleoprotein (N) at 4 weeks after the third dose, but non-significant (NS) when included. Fold changes in median ND80 between chronological time points are indicated (lower limit of detection = 10 (dotted line), upper limit of detection = 7,290 at 3 and 20 weeks after the second dose; lower limit of detection = 30 (dotted line), upper limit of detedtion = 21,870 at 4 weeks after the third dose). c, The same sera (70–79, n = 11, solid circles; 80–89, n = 8, open circles) were analysed using RBD-based ELISA assays (B.1 and BA.1). Solid horizontal lines represent the median. The equation for determining titre is described in the Methods (RBD-ELISA) and the statistics are as described in Fig. 2 (*P = 0.05; **P < 0.005; ****P < 0.0001). Fold changes in median titre compared with B.1 are indicated at 4 weeks after the third dose (lower limit of detection = 100 (dotted line), upper limit of detection = 129,600). The correlation between ND80 and S ELISA titres (S Roche) (d) or RBD-ELISA (e) or ND80 titres for B.1 and BA.1 was recorded from each volunteer (n = 19), with statistical analysis performed using a non-parametric Spearman correlation (r). f, Two-dimensional antigenic map (lowest error solution of 1,000 optimizations) of selected variants, based on 4-week post third dose ND80 titres. Multidimensional scaling was used to position the sera (open squares, nucleoprotein-based ELISA-positive in red) and variants (solid circles) to best fit target distances derived from the titres. The spacing between grid lines represents 1 AU, equivalent to a twofold dilution in ND80 titres. Source data
Extended Data Fig. 1
Extended Data Fig. 1. Comparison of neutralising antibody titres against SARS-CoV-2 VOCs at 3- and 20-weeks post 2nd dose of BNT162b2.
Neutralisation of pseudotypes bearing the SARS-CoV-2 Delta or Beta Spike were compared in the two age-stratified cohorts, 70–79 (solid circles) (a,c) and 80–89 (open circles) (b,d). Sera for mVNTs was collected from the same individuals at 3- (n = 37 total biologically independent samples) and 20-weeks (n = 35 total biologically independent samples) post 2nd dose. Symbols in red represents samples taken from individuals who tested positive for SARS-CoV-2 Nucleoprotein by ELISA, indicative of previous infection. Titres are expressed as serum fold-dilution required to achieve 80% virus neutralisation, with the titre (ND80) calculated by xy interpolation from the mVNT data series (dilution, x versus luciferase activity, relative light units, y). The detection limit of the assay is defined as a titre of 10 and is indicated with a dotted line. The upper limit of detection is defined as a titre of 2560 for Delta and 7290 for Beta. Statistical comparison of ND80 titres at 3 and 20 weeks was performed using a Wilcoxon two-tailed matched-pairs signed rank test (*; <0.05; **, <0.01). Fold changes in median ND80 between 3 and 20 weeks are indicated.
Extended Data Fig. 2
Extended Data Fig. 2. Comparison of neutralising antibody titres using pseudotype and live SARS-CoV-2 VOCs.
a, ND80s were calculated using sera from a sub-section (n = 16 biologically independent samples) of the BNT162b2-vaccinated cohort (ages 70–79, solid circles; 80–89, open circles) and live SARS-CoV-2 virus isolates (D614 [Lineage B] or Beta). b, The corresponding ND80s calculated using pseudotypes (Fig. 2) were compared to these live virus ND80s, with statistical analysis of the matrix performed using a nonparametric Spearman correlation (r). The limit of detection is defined as a titre of 10. Symbols in red represents samples taken from individuals who tested positive for SARS-CoV-2 Nucleoprotein by ELISA, indicative of previous infection.
Extended Data Fig. 3
Extended Data Fig. 3. Antigenic cartography for variant Spike RBDs.
a, Two-dimensional antigenic map of variants (the same map as in Fig. 3c), with coordination confidence areas reflecting the uncertainty in positioning of variants and sera. Variants are represented by solid shapes, sera by open shapes (Nucleoprotein-ELISA-positive in red). Each shape encompasses the area on the map that the point could be located at, without increasing the error of the map by more than 1. The spacing between grid lines represents one antigenic unit, equivalent to a two-fold dilution in ND80 titres. b, Two-dimensional antigenic map of variant Spike RBDs, based on the RBD-ELISA titres in Fig. 3d. Multidimensional scaling was used to position the sera and Spike RBDs to best fit target distances derived from the titres. The map is the lowest error solution of 1000 optimisations. Spike RBDs are represented by solid circles (variants coloured as in Fig. 3a, RBDs with individual mutations in grey), sera by open squares (Nucleoprotein-ELISA-positive in red). The spacing between grid lines represents one antigenic unit, equivalent to a two-fold dilution in RBD-ELISA titres. c, The same map as b, with coordination confidence areas reflecting the uncertainty in positioning of Spike RBDs and sera. Each shape encompasses the area on the map that the point could be located at, without increasing the error of the map by more than 1. Source data
Extended Data Fig. 4
Extended Data Fig. 4. Antigenic cartography for 3rd dose samples.
a,b, Neutralisation of pseudotypes bearing the SARS-CoV-2 D614 (Lineage B), B.1 (D614G), Alpha, Beta, Delta or Omicron (BA.1 and BA.2) Spike were compared in the two age-stratified cohorts, 70–79 (solid circles, n = 11 biologically independent samples) (A) and 80–89 (open circles, n = 8 biologically independent samples) (b) from sera collect at 4-weeks post 3rd dose. Symbols in red represents samples taken from individuals who tested positive for SARS-CoV-2 Nucleoprotein by ELISA, indicative of previous infection. Titres are expressed as serum fold-dilution required to achieve 80% virus neutralisation, with the titre (ND80) calculated by xy interpolation from the mVNT data series (dilution, x versus luciferase activity, relative light units, y). The detection limit of the assay is defined as a titre of 30 and is indicated with a dotted line. The upper limit of detection is defined as a titre is 21,870. (c) Two-dimensional antigenic map of selected variants (the same map as in Fig. 4f, turned 270°), with coordination confidence areas reflecting the uncertainty in positioning of variants and sera. Variants are represented by solid shapes, sera by open shapes (Nucleoprotein-ELISA-positive in red). Each shape encompasses the area on the map that the point could be located at, without increasing the error of the map by more than 1. The spacing between grid lines represents one antigenic unit, equivalent to a two-fold dilution in ND80 titres. d, Comparison of maps for post 2nd dose (left-most map, same as Fig. 3c but pruned to show selected variants only) and post 3rd dose (middle map, same as Fig. 4f but turned 270°) ND80 data. Arrows in the right-most map highlight the differences in positions of selected variants between the two maps, as determined by a Procrustes transformation: maps were rotated and translated to minimise the error between them, before overlaying one map onto the other. The spacing between grid lines represents one antigenic unit, equivalent to a two-fold dilution in ND80 titres, in all maps.

Comment in

  • COVID vaccination in older adults.
    Hägg S, Religa D. Hägg S, et al. Nat Microbiol. 2022 Aug;7(8):1106-1107. doi: 10.1038/s41564-022-01166-0. Nat Microbiol. 2022. PMID: 35836001 No abstract available.

Similar articles

Cited by

References

    1. Collier DA, et al. Age-related immune response heterogeneity to SARS-CoV-2 vaccine BNT162b2. Nature. 2021;596:417–422. doi: 10.1038/s41586-021-03739-1. - DOI - PMC - PubMed
    1. Kawasuji H, et al. Age-dependent reduction in neutralization against alpha and beta variants of BNT162b2 SARS-CoV-2 vaccine-induced immunity. Microbiol. Spectr. 2021;9:e0056121. doi: 10.1128/Spectrum.00561-21. - DOI - PMC - PubMed
    1. Peacock TP, et al. SARS-CoV-2 one year on: evidence for ongoing viral adaptation. J. Gen. Virol. 2021;102:001584. doi: 10.1099/jgv.0.001584. - DOI - PMC - PubMed
    1. Konings F, et al. SARS-CoV-2 variants of interest and concern naming scheme conducive for global discourse. Nat. Microbiol. 2021;6:821–823. doi: 10.1038/s41564-021-00932-w. - DOI - PubMed
    1. Davies NG, et al. Estimated transmissibility and impact of SARS-CoV-2 lineage B.1.1.7 in England. Science. 2021;372:eabg3055. doi: 10.1126/science.abg3055. - DOI - PMC - PubMed

Publication types

Supplementary concepts