Review
. 2022 Nov;60(6):837-850.
doi: 10.1111/gwat.13227. Epub 2022 Jul 25.

Documentation and Prediction of Increasing Groundwater Chloride in the Twin Cities, Minnesota

Affiliations
Review

Documentation and Prediction of Increasing Groundwater Chloride in the Twin Cities, Minnesota

John R McDaris et al. Ground Water. 2022 Nov.

Abstract

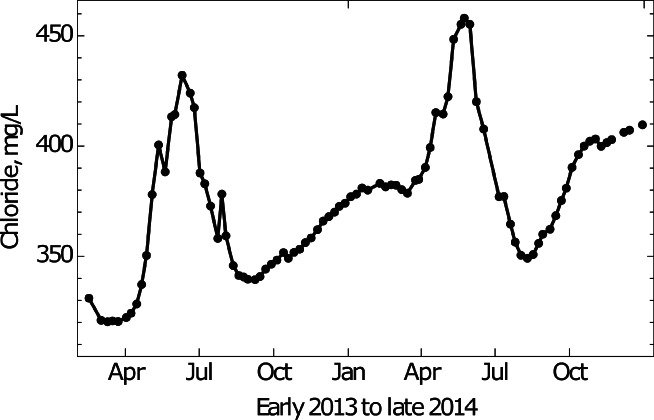
We provide a comprehensive overview of historic chloride concentrations in the groundwater of the Twin Cities metropolitan area (TCMA) in Minnesota, in order to define the extent of chloride contamination, due primarily to the seasonal application of deicing salt to roadways. Data collected from 1278 wells between 1965 and 2020 are representative of the major aquifers underlying the TCMA and establish a regional natural background chloride concentration of less than 10 mg/L. However, 55% of all measurements (1616 of 2943) are above 10 mg/L, with the highest concentrations found within the uppermost Quaternary aquifers. Chloride concentrations in underlying bedrock aquifers are negatively correlated with the thickness and clay composition of overlying materials. Most chloride measurements (92%) remain below chronic exposure limits set by state and federal authorities. Historical trends indicate that, if the current imbalance between chloride inputs and outflows persists, chloride concentrations in TCMA aquifers will surpass regulatory thresholds by midcentury as surface waters and Quaternary aquifer waters migrate into underlying bedrock aquifers. Most wells in this study are monitored annually, making it impossible to detect important sub-annual fluctuations of chloride concentration that can exceed 40%.


Figures

Figure 1
Figure 1
(a) Cross section A–A′ of six bedrock aquifers of the TCMA; (b) map view of the first bedrock under the seven county TCMA and the location of the cross section A–A′ (inset locates the TCMA in the U.S. Midwest). The dashed, green line separates thick, extensive, clay‐rich Des Moines lobe Quaternary sediment to the west, from sandier, generally thinner, and patchier Quaternary sediment to the east. (After Runkel et al. ; green line is after Johnson et al. 2016).
Figure 2
Figure 2
Interpreted potentiometric surface contours for the combined Prairie du Chien and Jordan aquifers in the TCMA. Flow directions indicated by arrows. Aquifers not present in unshaded areas. Based on individual county geologic atlas publications from the MN Geologic Survey and MN Department of Natural Resources (Balaban and McSwiggen ; Balaban ; Balaban and Hobbs ; Swanson and Meyer ; Meyer and Swanson ; Peterson ; Berg 2016).
Figure 3
Figure 3
Chloride concentrations at Coldwater Spring from early 2013 to late 2014. Data from Kasahara .
Figure 4
Figure 4
Geographic locations of all wells in this study. Dark green points represent wells in Quaternary deposits and light green points represent wells in bedrock units. The dashed blue line is the I494–I694 loop indicating the TCMA urban core.
Figure 5
Figure 5
Data distributions in time for the units with more than 100 measurements in the dataset in stratigraphic order. The final panel shows how the sources of the data changed over the study period.
Figure 6
Figure 6
Cumulative frequency distributions for chloride measurements across the 11 aquifer units in the TCMA with more than 30 measurements. Vertical lines indicate the chronic (230 mg/L) and acute (860 mg/L) water quality thresholds. Note the x‐axis is plotted using a log scale.
Figure 7
Figure 7
Differences in chloride data before and after the gap in available data shown as CFD plots for two aquifers. Blue lines show the distribution of data from before 1990, red lines denote data from after 2000, and black lines denote all data. (a) Jordan Sandstone (CJDN). (b) Combined Prairie du Chien‐Jordan aquifer (OPCJ).
Figure 8
Figure 8
Change in chloride concentration with time. (a) Chloride concentration with time in CJDN well #639312. The mean chloride value is indicated at left and the annual rate of chloride change from linear regression is shown by the solid blue line. The median value and the nonparametric Sen's Slope of the data are shown by the dashed lines. (b) Wells with more than eight measurements and a statistically significant rate of chloride increase plotted vs. their mean chloride (log–log scale). The well in (a) is indicated by a small arrow. Larger points show aquifer averages. The gray region is the 95% confidence interval for the power law fit to the data.
Figure 9
Figure 9
Locations of wells projected to exceed Minnesota's chronic water quality threshold. Red, exceedance by 2030; yellow, by 2040; green, by 2050. Shapes indicate aquifer units.
Figure 10
Figure 10
Chloride measurements from QWTA wells as a function of impervious land cover. The lower horizontal line represents Minnesota's chronic environmental quality threshold of 230 mg/L. The upper line represents the acute threshold of 860 mg/L. The large majority (14/19) of measurements exceeding the acute standard (red data points) occur in areas with greater than 50% impervious ground cover.
Figure 11
Figure 11
Locations of the 19 wells yielding the 30 highest chloride measurements.

References

    1. Alexander, E.C. Jr. , and Lively R.S.. 1995. Karst‐aquifers, caves and sinkholes. In Text Supplement to the Geologic Atlas, Fillmore County, Minnesota. Minnesota Geological Survey County Atlas Series C‐8, Part C, ed. Lively R.S., and Balaban N.H., 10–18. St. Paul, MN: Minnesota Geological Survey.
    1. Anderson, J.R. , Runkel A.C., Tipping R.G., Barr K., and Alexander E.C. Jr. 2011. Hydrostratigraphy of a fractured urban aquitard. Geological Society of America Field Guides 24: 457–475.
    1. Balaban, N.H. 1989. C‐04 Geologic Atlas of Hennepin County, Minnesota. Minnesota Geological Survey. Retrieved from the University of Minnesota Digital Conservancy, https://hdl.handle.net/11299/58491.
    1. Balaban, N.H. and Hobbs H.C.. 1990. C‐06 Geologic Atlas of Dakota County, Minnesota. Minnesota Geological Survey. Retrieved from the University of Minnesota Digital Conservancy, https://hdl.handle.net/11299/58494.
    1. Balaban, N.H. and McSwiggen P.L.. 1982. C‐01 Geologic Atlas of Scott County, Minnesota. Minnesota Geological Survey. Retrieved from the University of Minnesota Digital Conservancy, https://hdl.handle.net/11299/58232.

LinkOut - more resources