. 2022 Jul 15;24(1):9.
doi: 10.1186/s12575-022-00172-0.

A comprehensive prognostic and immune analysis of enhancer RNA identifies IGFBP7-AS1 as a novel prognostic biomarker in Uterine Corpus Endometrial Carcinoma

Affiliations

A comprehensive prognostic and immune analysis of enhancer RNA identifies IGFBP7-AS1 as a novel prognostic biomarker in Uterine Corpus Endometrial Carcinoma

Jinhui Liu et al. Biol Proced Online. .

Abstract

Background: Long non-coding RNAs (lncRNA) have been implicated in a hand of studies that supported an involvement and co-operation in Uterine Corpus Endometrial Carcinoma (UCEC). Enhancer RNAs (eRNA), a functional subtype of lncRNA, have a key role throughout the genome to guide protein production, thus potentially associated with diseases.

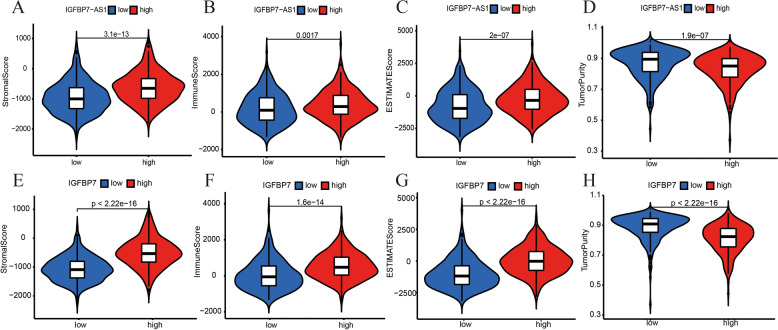
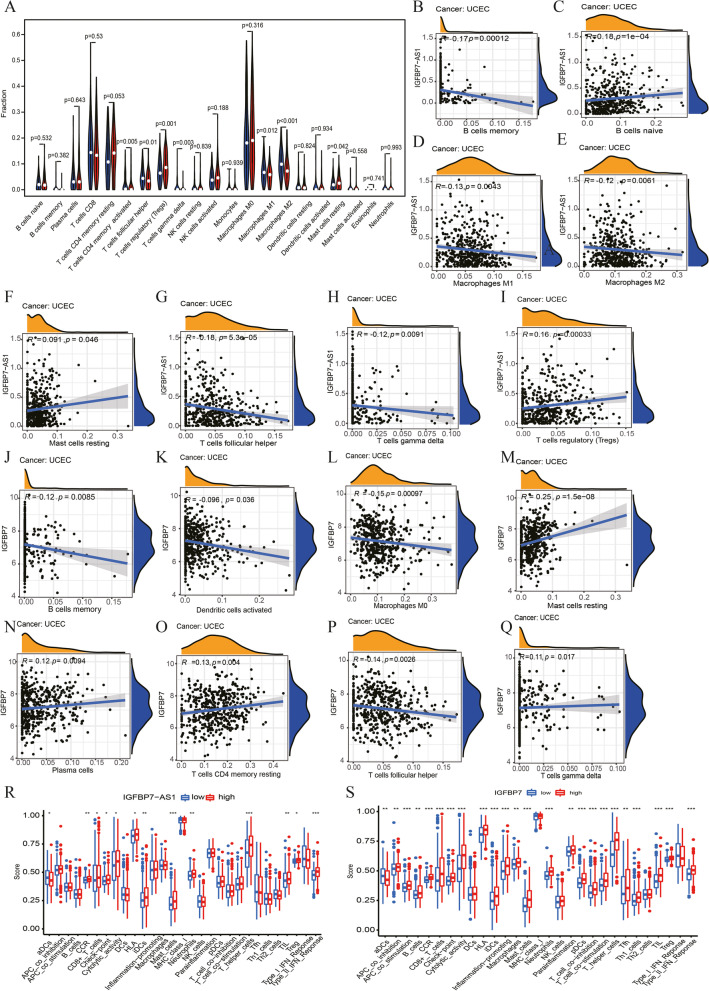
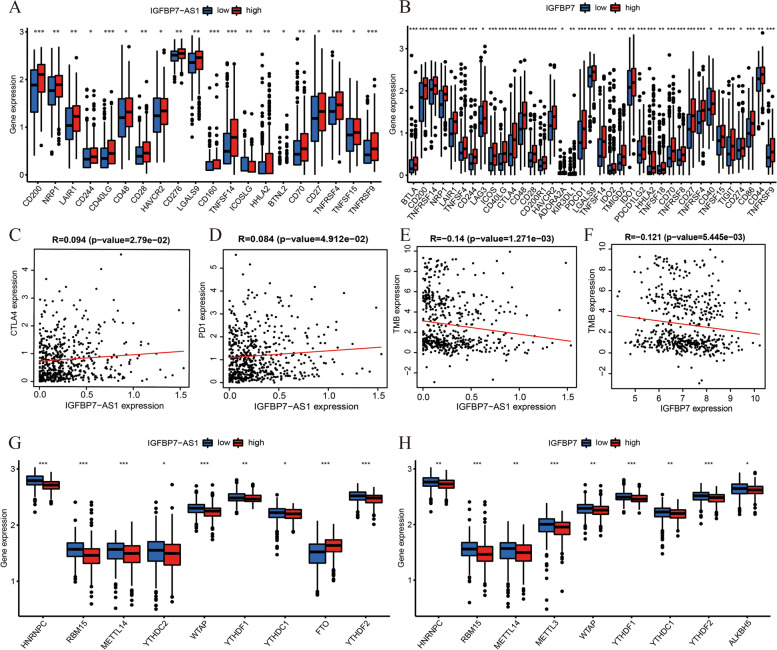
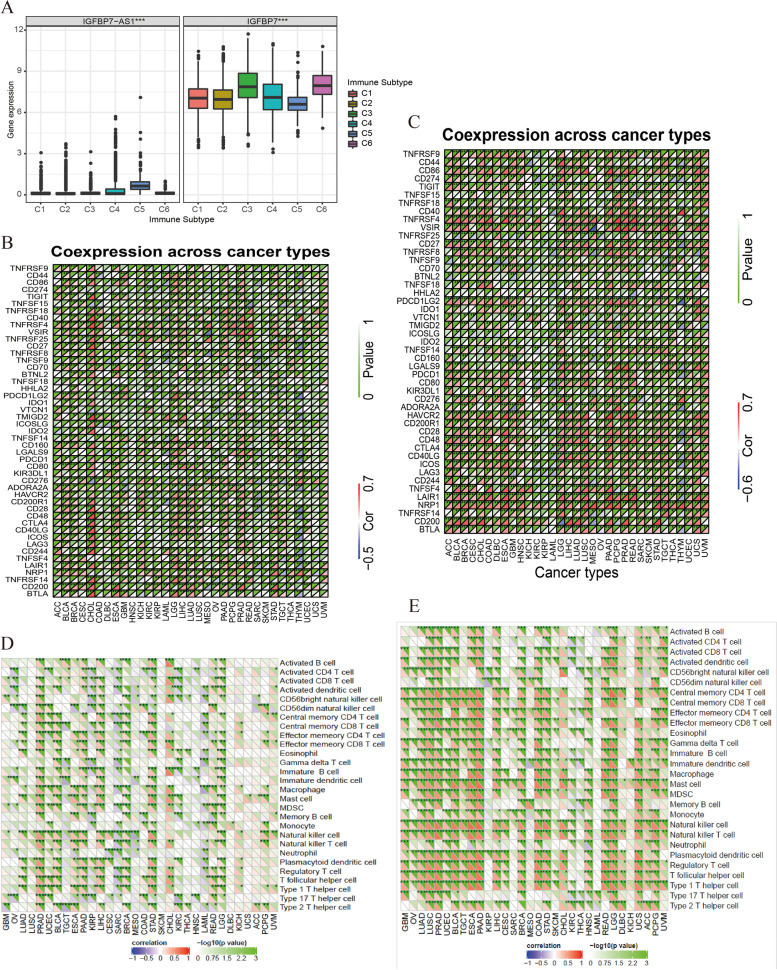
Methods: In this study, we mainly applied the Cancer Genome Atlas (TCGA) dataset to systematically discover crucial eRNAs involving UCEC. For the key eRNAs in UCEC, we employed RT-qPCR to compare eRNA expression levels in tumor tissues and paired normal adjacent tissues from UCEC patients for validation. Furthermore, the relationships between the key eRNAs and immune activities were measured from several aspects, including the analysis for tumor microenvironment, immune infiltration cells, immune check point genes, tumor mutation burden, and microsatellite instability, as well as m6A related genes. Finally, the key eRNAs were verified by a comprehensive pan-cancer analysis.

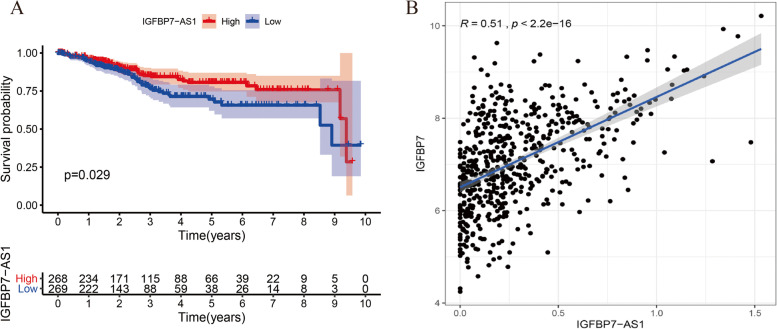
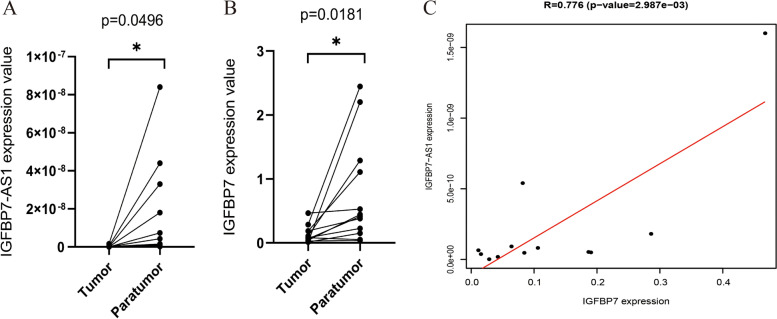
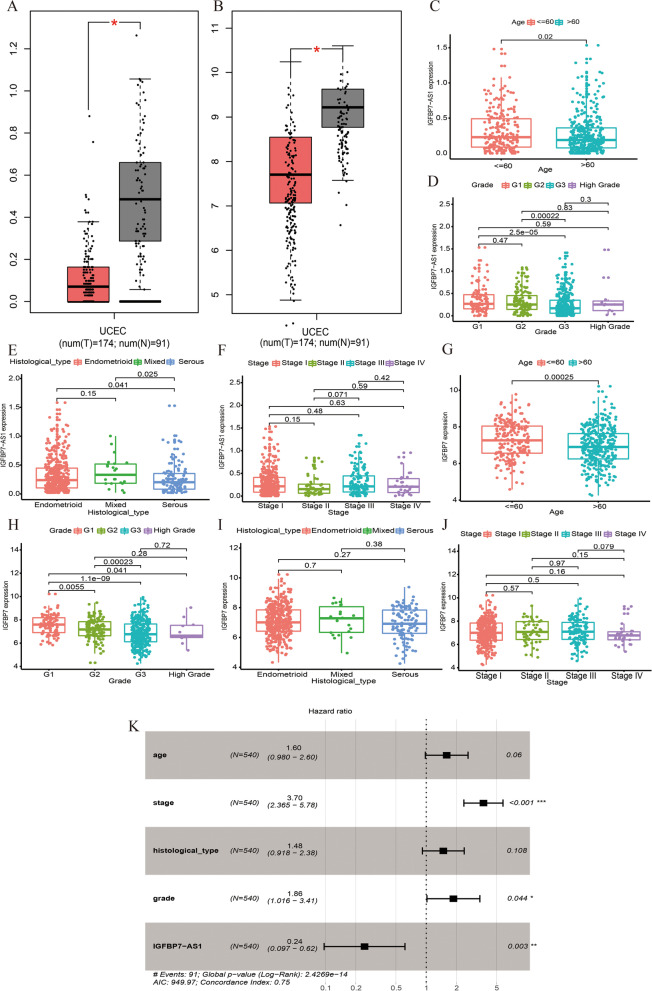
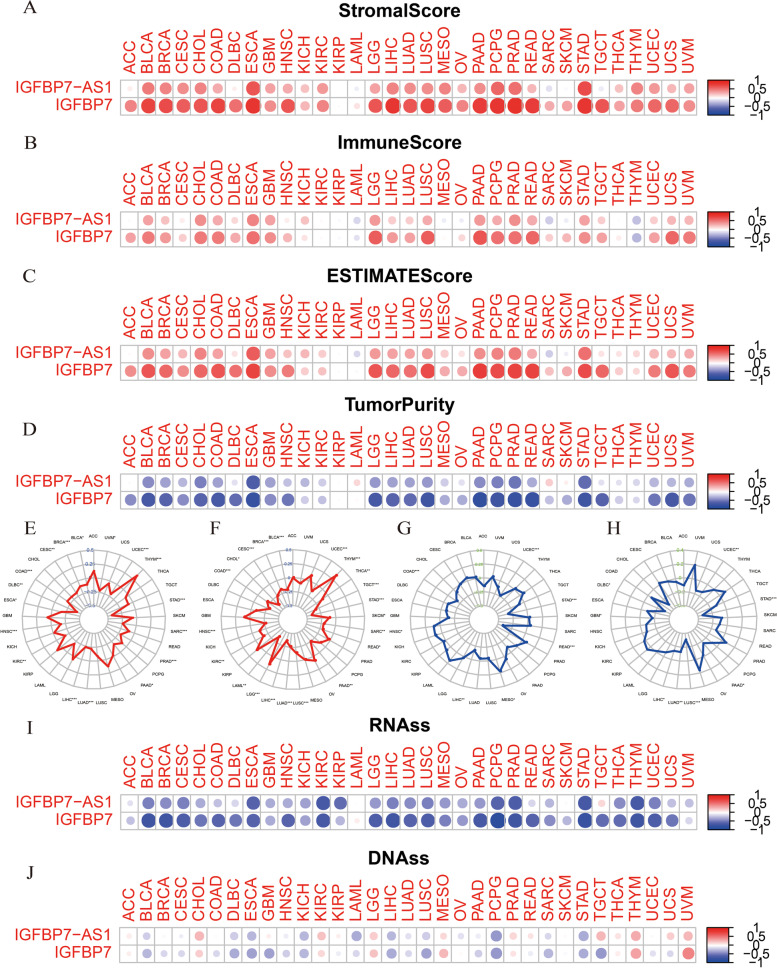
Results: IGFBP7 Antisense RNA 1 (IGFBP7-AS1) was identified as the key eRNA for its expression patterns of low levels in tumor tissues and favorable prognostic value in UCEC correlated with its target gene IGFBP7. In RT-qPCR analysis, IGFBP7-AS1 and IGFBP7 had down-regulated expression in tumor tissues, which was consistent with previous analysis. Moreover, IGFBP7-AS1 was found closely related with immune response in relevant immune analyses. Besides, IGFBP7-AS1 and its target gene IGFBP7 correlated with a multi-omics pan-cancer analysis.

Conclusions: Finally, we suggested that IGFBP7-AS1 played a key role in impacting on clinical outcomes of UCEC patients for its possible influence on immune activity.

Keywords: Enhancer RNA; IGFBP7; IGFBP7-AS1; Tumor immunity; UCEC.


Conflict of interest statement

The authors have no conflict of interest to declare.

Figures

Fig. 1
Fig. 1
Impact of IGFBP7-AS1 and IGFBP7 on Uterine Corpus Endometrial Carcinoma (UCEC) A Kaplan–Meier curve analysis of high-level and low-level IGFBP7-AS1 expression groups B Scatter plot showing the significant correlation between IGFBP7-AS1 and IGFBP7 levels
Fig. 2
Fig. 2
Quantification of IGFBP7-AS1 and IGFBP7 levels by RT-qPCR. A, B Expression levels of IGFBP7-AS1 and IGFBP7 in UCEC samples and paired adjacent samples. C Significant correlation between IGFBP7-AS1 and IGFBP7 levels in tumor samples
Fig. 3
Fig. 3
IGFBP7-AS1 and IGFBP7 expression in UCEC and their correlations with various clinicopathology features and prognosis survival. A IGFBP7-AS1 expression in UCEC tumor and normal tissues (the red for tumor tissues and the black for normal tissues). B IGFBP7 expression in UCEC tumor and normal tissues (the red for tumor tissues and the black for normal tissues). C The expression of IGFBP7-AS1 in different age, D tumor grade, E histological type and F clinical stage. G The expression of IGFBP7 in different age, H tumor grade, I histological type and J clinical stage. K forest plot of Multivariate COX regression analysis about age, stage, histological type, tumor grade and IGFBP7-AS1 expression
Fig. 4
Fig. 4
GO term and KEGG pathway analysis in UCEC. A bubble plot of GO term analysis B of KEGG pathway analysis
Fig. 5
Fig. 5
TME analysis for IGFBP7-AS1 and IGFBP7. A The IGFBP7-AS1 expression differences in Stromal score, B Immune score, C ESTIMATE score and D Tumor purity. E The IGFBP7 expression differences in Stromal score, F Immune score, G ESTIMATE score and H Tumor purity
Fig. 6
Fig. 6
Relationship of IGFBP7-AS1 expression with immune related cells and immune infiltration scores of TILs and immune-related substances. A The boxplots of immune cells proportion in different IGFBP7-AS1 expression groups (the red for high expression group and the blue for low expression group of IGFBP7-AS1). B Scatterplot of IGFBP7-AS1 correlated with B Cells memory, C B cells native, D Macrophages M1, E Macrophages M2, F Mast cells resting, G T cells follicular helper, H T cells gamma delta and I T cells regulatory (Tregs). J Scatterplot of IGFBP7 correlated with memory B cells, K Dendritic cells activated, L Macrophages M0, M Mast cells resting, N Plasma cells, O T cells CD4 memory resting, P T cells follicular helper and Q T cells gamma delta. R The boxplots of immune infiltration cell score in different IGFBP7-AS1 and S IGFBP7 expression groups
Fig. 7
Fig. 7
Correlations of IGFBP7-AS1 and IGFBP7 with immune checkpoint genes, TMB and m6A genes. A The immune checkpoints related genes expression in different IGFBP7-AS1 and B IGFBP7 expression groups. C The scatter plot showing the correlation between IGFBP7-AS1 and CTLA4 levels. D The scatter plot showing the correlation between IGFBP7-AS1 and PD1 levels. E The correlation scatterplot of TMB with IGFBP7-AS1 expression and F IGFBP7 expression. G The m6A genes expression in different IGFBP7-AS1 and H IGFBP7 expression groups
Fig. 8
Fig. 8
Correlations with immune subtypes, immune checkpoints and TILs. A Correlation between gene expression and immune infiltration subtypes in patients of pan-cancer. B, C Heatmaps about the correlation between IGFBP7-AS1 and IGFBP7 expression levels and acknowledged immune checkpoints’ mRNA expression. D, E Heatmaps about the relationship between IGFBP7-AS1 and IGFBP7 expression and immune infiltration cells
Fig. 9
Fig. 9
Correlations of IGFBP7-AS1 and IGFBP7 expression with TME, TMB, MSI and tumor stem cells in multiple cancer. A The relationship between gene expression and stromal score, B immune score, C ESTIMATE score and D tumor purity. E, F Correlation between TMB and IGFBP7-AS1 and IGFBP7 expression. G, H Correlation between MSI and IGFBP7-AS1 and IGFBP7 expression. I The relationship between gene expression and RNAss and (J) DNAss

Similar articles

Cited by

References

    1. Akiel M, Guo C, Li X, Rajasekaran D, Mendoza RG, Robertson CL, Sarkar D. IGFBP7 Deletion Promotes Hepatocellular Carcinoma. Cancer Res. 2017;77(15):4014–4025. doi: 10.1158/0008-5472.CAN-16-2885. - DOI - PMC - PubMed
    1. Aller MA, Arias A, Arias JI, Arias J. Carcinogenesis: the cancer cell-mast cell connection. Inflamm Res. 2019;68(2):103–116. doi: 10.1007/s00011-018-1201-4. - DOI - PubMed
    1. Amankulor NM, Kim Y, Arora S, Kargl J, Szulzewsky F, Hanke M, Holland EC. Mutant IDH1 regulates the tumor-associated immune system in gliomas. Genes Dev. 2017;31(8):774–786. doi: 10.1101/gad.294991.116. - DOI - PMC - PubMed
    1. Barbie DA, Tamayo P, Boehm JS, Kim SY, Moody SE, Dunn IF, Hahn WC. Systematic RNA interference reveals that oncogenic KRAS-driven cancers require TBK1. Nature. 2009;462(7269):108–112. doi: 10.1038/nature08460. - DOI - PMC - PubMed
    1. Ben-Porath I, Thomson MW, Carey VJ, Ge R, Bell GW, Regev A, Weinberg RA. An embryonic stem cell-like gene expression signature in poorly differentiated aggressive human tumors. Nat Genet. 2008;40(5):499–507. doi: 10.1038/ng.127. - DOI - PMC - PubMed