

Comparing human milk macronutrients measured using analyzers based on mid-infrared spectroscopy and ultrasound and the application of machine learning in data fitting
- PMID: 35836199
- PMCID: PMC9284806
- DOI: 10.1186/s12884-022-04891-w
Comparing human milk macronutrients measured using analyzers based on mid-infrared spectroscopy and ultrasound and the application of machine learning in data fitting
Abstract
Objective: Fat, carbohydrates (mainly lactose) and protein in breast milk all provide indispensable benefits for the growth of newborns. The only source of nutrition in early infancy is breast milk, so the energy of breast milk is also crucial to the growth of infants. Some macronutrients composition in human breast milk varies greatly, which could affect its nutritional fulfillment to preterm infant needs. Therefore, rapid analysis of macronutrients (including lactose, fat and protein) and milk energy in breast milk is of clinical importance. This study compared the macronutrients results of a mid-infrared (MIR) analyzer and an ultrasound-based breast milk analyzer and unified the results by machine learning.
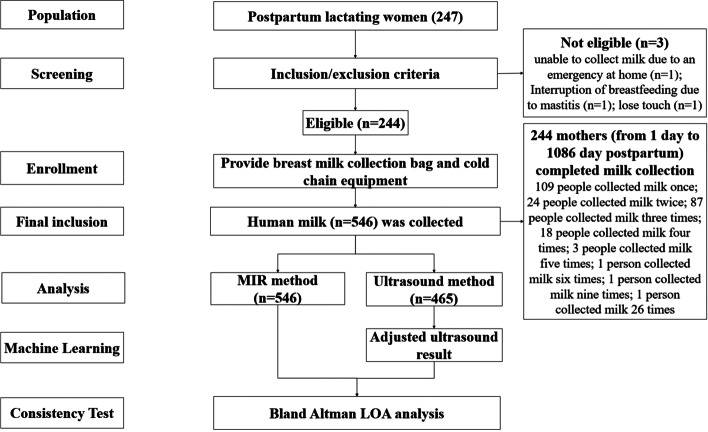
Methods: This cross-sectional study included breastfeeding mothers aged 22-40 enrolled between November 2019 and February 2021. Breast milk samples (n = 546) were collected from 244 mothers (from Day 1 to Day 1086 postpartum). A MIR milk analyzer (BETTERREN Co., HMIR-05, SH, CHINA) and an ultrasonic milk analyzer (Honɡyanɡ Co,. HMA 3000, Hebei, CHINA) were used to determine the human milk macronutrient composition. A total of 465 samples completed the tests in both analyzers. The results of the ultrasonic method were mathematically converted using machine learning, while the Bland-Altman method was used to determine the limits of agreement (LOA) between the adjusted results of the ultrasonic method and MIR results.
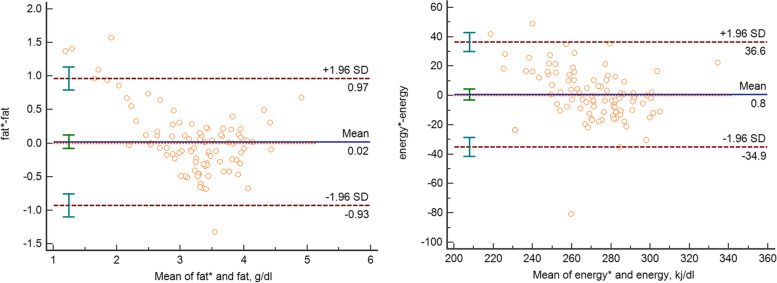
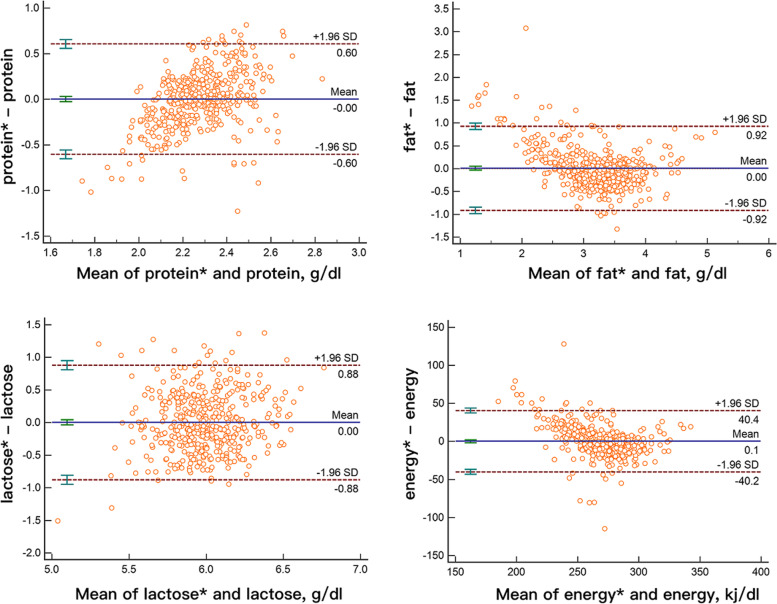
Results: The MIR and ultrasonic milk analyzer results were significantly different. The protein, fat, and energy determined using the MIR method were higher than those determined by the ultrasonic method, while lactose determined by the MIR method were lower (all p < 0.05). The consistency between the measured MIR and the adjusted ultrasound values was evaluated using the Bland-Altman analysis and the scatter diagram was generated to calculate the 95% LOA. After adjustments, 93.96% protein points (436 out of 465), 94.41% fat points (439 out of 465), 95.91% lactose points (446 out of 465) and 94.62% energy points (440 out of 465) were within the LOA range. The 95% LOA of protein, fat, lactose and energy were - 0.6 to 0.6 g/dl, -0.92 to 0.92 g/dl, -0.88 to 0.88 g/dl and - 40.2 to 40.4 kj/dl, respectively and clinically acceptable. The adjusted ultrasonic results were consistent with the MIR results, and LOA results were high (close to 95%).
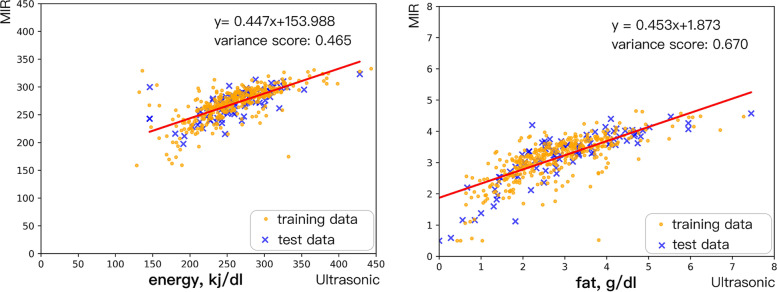
Conclusions: While the results of the breast milk rapid analyzers using the two methods varied significantly, they could still be considered comparable after data adjustments using linear regression algorithm in machine learning. Machine learning methods can play a role in data fitting using different analyzers.
Keywords: Bland–Altman method; Human milk analyzer; Machine learning; Mid-infrared spectroscopy; Ultrasound.
© 2022. The Author(s).
Conflict of interest statement
The authors have no conflicts of interest relevant to this article.
Figures
Similar articles
-
Validation of mid-infrared spectroscopy for macronutrient analysis of human milk.J Perinatol. 2017 Jul;37(7):822-826. doi: 10.1038/jp.2017.52. Epub 2017 Apr 20. J Perinatol. 2017. PMID: 28425978
-
Rapid measurement of macronutrients in breast milk: How reliable are infrared milk analyzers?Clin Nutr. 2015 Jun;34(3):465-76. doi: 10.1016/j.clnu.2014.05.005. Epub 2014 May 17. Clin Nutr. 2015. PMID: 24912866 Free PMC article.
-
Macronutrient analysis of preterm human milk using mid-infrared spectrophotometry.J Perinat Med. 2019 Sep 25;47(7):785-791. doi: 10.1515/jpm-2019-0105. J Perinat Med. 2019. PMID: 31365346
-
Effect of Freezing and Thawing on Human Milk Macronutrients and Energy Composition: A Systematic Review and Meta-Analysis.Breastfeed Med. 2020 Sep;15(9):559-562. doi: 10.1089/bfm.2020.0193. Epub 2020 Jul 17. Breastfeed Med. 2020. PMID: 32700962
-
Human Milk Macronutrients and Child Growth and Body Composition in the First Two Years: A Systematic Review.Adv Nutr. 2024 Jan;15(1):100149. doi: 10.1016/j.advnut.2023.100149. Epub 2023 Nov 18. Adv Nutr. 2024. PMID: 37981047 Free PMC article.
Cited by
-
Sleep duration of lactating mothers and its relationship with feeding pattern, milk macronutrients and related serum factors: A combined longitudinal cohort and cross-sectional study.Front Nutr. 2022 Aug 30;9:973291. doi: 10.3389/fnut.2022.973291. eCollection 2022. Front Nutr. 2022. PMID: 36110402 Free PMC article.
-
Comparative analysis of different methods for protein quantification in donated human milk.Front Pediatr. 2024 Oct 1;12:1436885. doi: 10.3389/fped.2024.1436885. eCollection 2024. Front Pediatr. 2024. PMID: 39411279 Free PMC article.
-
Challenges and Opportunities in Quantifying Bioactive Compounds in Human Breastmilk.Biomolecules. 2025 Feb 24;15(3):325. doi: 10.3390/biom15030325. Biomolecules. 2025. PMID: 40149861 Free PMC article. Review.
-
Artificial intelligence applied to the study of human milk and breastfeeding: a scoping review.Int Breastfeed J. 2024 Dec 6;19(1):79. doi: 10.1186/s13006-024-00686-1. Int Breastfeed J. 2024. PMID: 39639329 Free PMC article.
References
-
- Brown JVE, Embleton ND, Harding JE, McGuire W. Multi‐nutrient fortification of human milk for preterm infants. Cochrane Database Syst Rev. 2016;(5). Art. No.: CD000343. 10.1002/14651858.CD000343.pub3. Accessed 11 July 2022. - PubMed
MeSH terms
Substances
Grants and funding
LinkOut - more resources
Full Text Sources
