. 2022 Jul 15;10(1):107.
doi: 10.1186/s40168-022-01299-8.

Chicken jejunal microbiota improves growth performance by mitigating intestinal inflammation

Affiliations

Chicken jejunal microbiota improves growth performance by mitigating intestinal inflammation

Xiaolong Zhang et al. Microbiome. .

Erratum in

Abstract

Background: Intestinal inflammation is prevalent in chicken, which results in decreased growth performance and considerable economic losses. Accumulated findings established the close relationship between gut microbiota and chicken growth performance. However, whether gut microbiota impacts chicken growth performance by lessening intestinal inflammation remains elusive.

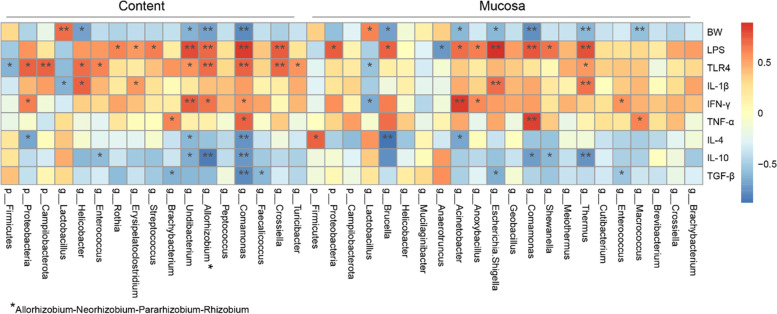
Results: Seven-weeks-old male and female chickens with the highest or lowest body weights were significantly different in breast and leg muscle indices and average cross-sectional area of muscle cells. 16S rRNA gene sequencing indicated Gram-positive bacteria, such as Lactobacilli, were the predominant species in high body weight chickens. Conversely, Gram-negative bacteria, such as Comamonas, Acinetobacter, Brucella, Escherichia-Shigella, Thermus, Undibacterium, and Allorhizobium-Neorhizobium-Pararhizobium-Rhizobium were significantly abundant in low body weight chickens. Serum lipopolysaccharide (LPS) level was significantly higher in low body weight chickens (101.58 ± 5.78 ng/mL) compared with high body weight chickens (85.12 ± 4.79 ng/mL). The expression of TLR4, NF-κB, MyD88, and related inflammatory cytokines in the jejunum was significantly upregulated in low body weight chickens, which led to the damage of gut barrier integrity. Furthermore, transferring fecal microbiota from adult chickens with high body weight into 1-day-old chicks reshaped the jejunal microbiota, mitigated inflammatory response, and improved chicken growth performance.

Conclusions: Our findings suggested that jejunal microbiota could affect chicken growth performance by mitigating intestinal inflammation. Video Abstract.

Keywords: Chicken; Fecal microbiota transplantation; Growth performance; Intestinal inflammation; Jejunal microbiota.


Conflict of interest statement

The authors declare that they have no competing interests.

Figures

Fig. 1
Fig. 1
Differential growth performance of high and low body weight chickens. A Body weight of high and low groups. B Breast and leg muscle weight. C Breast and leg muscle indices. D, E H & E staining of paraffin sections of breast muscles and leg muscles and the comparison of single cell’s cross-sectional area. Scale bars = 50 μm. Data are shown as mean ± SEM. *P < 0.05, **P < 0.01, and ****P < 0.0001. H, high body weight group; L, low body weight group
Fig. 2
Fig. 2
Comparison of microbial α diversity and β diversity in jejunum between high and low body weight chickens. A Pan curve indicates the relation between total number of operational taxonomic unit (OTUs) and the number of samples. B Microbial community diversity (measured by Shannon index). C Microbial community abundance (measured by Chao index). D, E Principal component analysis (PCA) plots of Bray–Curtis dissimilarities between the content/mucosa microbiota of high and low body weight groups. HC, the content of high body weight group; LC, the content of low body weight group; HM, mucosa of high body weight group; LM, mucosa of low body weight group
Fig. 3
Fig. 3
Differences in abundance and microbial composition. A, B Microbial community composition of jejunum content/mucosa at the phylum level. C, D Microbial community composition of jejunum content/mucosa at the genus level. E, F Differentially abundant taxa of content/mucosa microbiota between high and low body weight chickens. LDA score ≥ 2. HC, the content of high body weight group; LC, the content of low body weight group; HM, mucosa of high body weight group; LM, mucosa of low body weight group
Fig. 4
Fig. 4
LPS-mediated activation of an inflammatory pathway. A Comparison of serum LPS concentrations between high and low body weight chickens. B The relative mRNA expression of TLR4, MyD88, and NF-κB in the inflammatory pathway. C The protein distribution and expression level of TLR4 in the jejunum (IHC). Data are shown as mean ± SEM. *P < 0.05 and **P < 0.01. IOD, integrated optical density; Scale bars = 100 μm
Fig. 5
Fig. 5
Differential pro-/anti-inflammatory profile. A The relative mRNA expression of pro-inflammatory cytokines in the jejunum. B The relative mRNA expression of anti-inflammatory cytokines in the jejunum. C The protein distribution and expression levels of IL-1β in the jejunum (IHC). Scale bars = 50 μm. D Comparison of toluidine blue-stained mast cells in the jejunum. Scale bars = 20μm. Data are shown as mean ± SEM. *P < 0.05, **P < 0.01. IOD, integrated optical density; H, high body weight group; L, low body weight group; MC, mast cell; HPF, high power field
Fig. 6
Fig. 6
Effect of inflammation and apoptosis on the structure and function of jejunum. A H & E staining of the jejunum. Scale bars = 200 μm. B Comparison of PAS-stained goblet cells (GC) in the jejunum. Scale bars = 50 μm. C The relative mRNA expression of mucin 2 (MUC2) in the jejunum. D The relative mRNA expression of tight junction proteins in the jejunum. E The relative mRNA expression of apoptosis-related genes. Data are shown as mean ± SEM. *P < 0.05. H, high body weight group; L, low body weight group
Fig. 7
Fig. 7
Heatmap of Spearman’s correlations between jejunal microbiota abundance and phenotype/inflammatory factors. The colors range from blue (negative correlation) to red (positive correlation). *P < 0.05 and **P < 0.01
Fig. 8
Fig. 8
Effect of fecal microbiota transplantation (FMT) on chicken growth and development. A FMT promoted the weight gain of chickens. B Breast muscle and leg muscle weight on the 30th and 60th day. C Breast muscle and leg muscle indices on the 30th and 60th day. D Comparison of the jejunum length on the 30th and 60th day. E The difference of jejunum epithelial morphology of FMT and control group chickens on the 30th day. Scale bars = 500 μm. F The difference in jejunum villus height between FMT and control group chickens on the 30th day. G The difference of jejunum epithelial morphology of FMT and control group chickens on the 60th day. Scale bars = 500 μm. H The difference in jejunum villus height between FMT and control group chickens on the 60th day. Data are shown as mean ± SEM. *P < 0.05 and **P < 0.01. FMT, fecal microbiota transplantation group; Con, control group
Fig. 9
Fig. 9
Effect of fecal microbiota transplantation (FMT) on jejunum microbiota. A, B Principal component analysis (PCA) plots of Bray–Curtis dissimilarities between the content/mucosa microbiota of the FMT and control groups. C, D Microbial community composition of jejunum content/mucosa at the phylum level. E, F Differentially abundant taxa of content/mucosa microbiota between FMT and control groups. LDA score ≥ 2. FMTC, the content of the fecal microbiota transplantation group; ConC, the content of the control group; FMTM, mucosa of the fecal microbiota transplantation group; ConM, mucosa of the control group
Fig. 10
Fig. 10
Effect of fecal microbiota transplantation (FMT) on inflammatory pathways. A Serum LPS concentration in the FMT and control groups. B The relative mRNA expression of TLR4 MyD88 and NF-κB in the jejunum. C The relative mRNA expression of pro-inflammatory cytokines in the jejunum. D The relative mRNA expression of anti-inflammatory cytokines in the jejunum. Data are shown as mean ± SEM. *P < 0.05, **P < 0.01, and ***P < 0.001

References

    1. Nii T, Bungo T, Isobe N, Yoshimura Y. Intestinal inflammation induced by dextran sodium sulphate causes liver inflammation and lipid metabolism disfunction in laying hens. Poult Sci. 2020;99(3):1663–1677. doi: 10.1016/j.psj.2019.11.028. - DOI - PMC - PubMed
    1. Okumura R, Takeda K. Maintenance of intestinal homeostasis by mucosal barriers. Inflamm Regen. 2018;38:5. doi: 10.1186/s41232-018-0063-z. - DOI - PMC - PubMed
    1. Cisek AA, Binek M. Chicken intestinal microbiota function with a special emphasis on the role of probiotic bacteria. Pol J Vet Sci. 2014;17(2):385–394. doi: 10.2478/pjvs-2014-0057. - DOI - PubMed
    1. Gazoni FL, Adorno FC, Matte F, Alves AJ, Campagnoni IDP, Urbano T, et al. Correlation between intestinal health and coccidiosis prevalence in broilers in Brazilian agroindustries. Parasitol Int. 2020;76:102027. doi: 10.1016/j.parint.2019.102027. - DOI - PubMed
    1. Fasina YO, Newman MM, Stough JM, Liles MR. Effect of Clostridium perfringens infection and antibiotic administration on microbiota in the small intestine of broiler chickens. Poult Sci. 2016;95(2):247–260. doi: 10.3382/ps/pev329. - DOI - PubMed

Publication types

Substances

LinkOut - more resources