

Temporal trends of medical cost and cost-effectiveness in sepsis patients: a Japanese nationwide medical claims database
- PMID: 35836301
- PMCID: PMC9281011
- DOI: 10.1186/s40560-022-00624-5
Temporal trends of medical cost and cost-effectiveness in sepsis patients: a Japanese nationwide medical claims database
Abstract
Background: Sepsis is the leading cause of death worldwide. Although the mortality of sepsis patients has been decreasing over the past decade, the trend of medical costs and cost-effectiveness for sepsis treatment remains insufficiently determined.
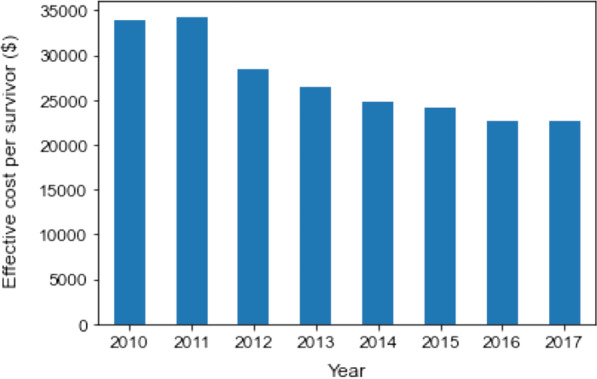
Methods: We conducted a retrospective study using the nationwide medical claims database of sepsis patients in Japan between 2010 and 2017. After selecting sepsis patients with a combined diagnosis of presumed serious infection and organ failure, patients over the age of 20 were included in this study. We investigated the annual trend of medical costs during the study period. The primary outcome was the annual trend of the effective cost per survivor, calculated from the gross medical cost and number of survivors per year. Subsequently, we performed subgroup and multiple regression analyses to evaluate the association between the annual trend and medical costs.
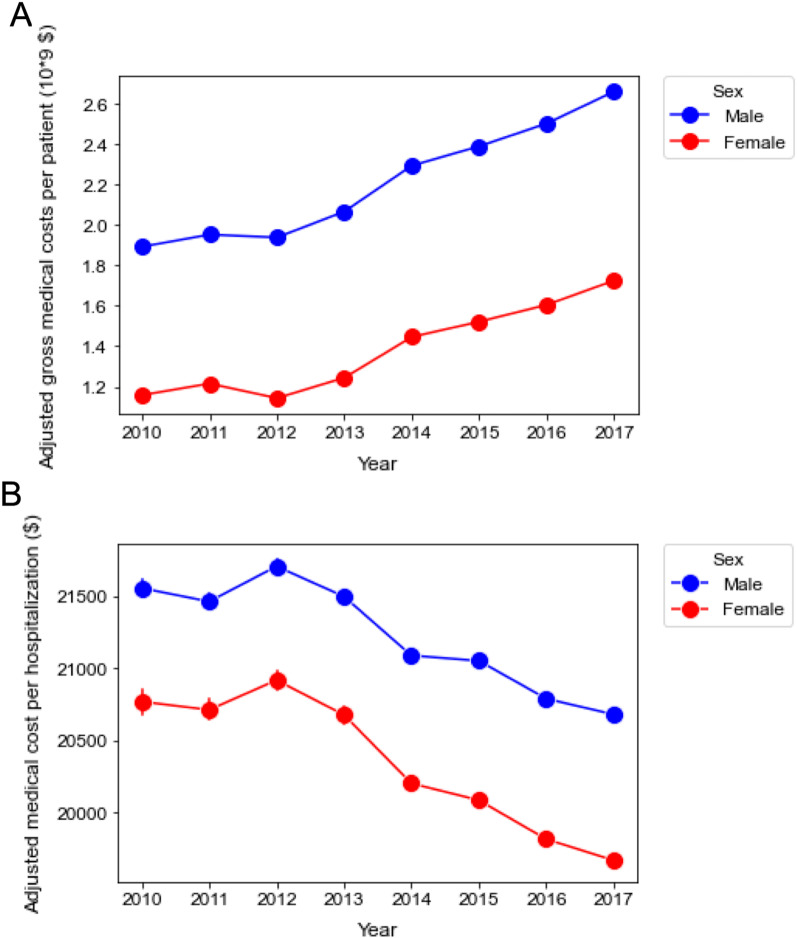
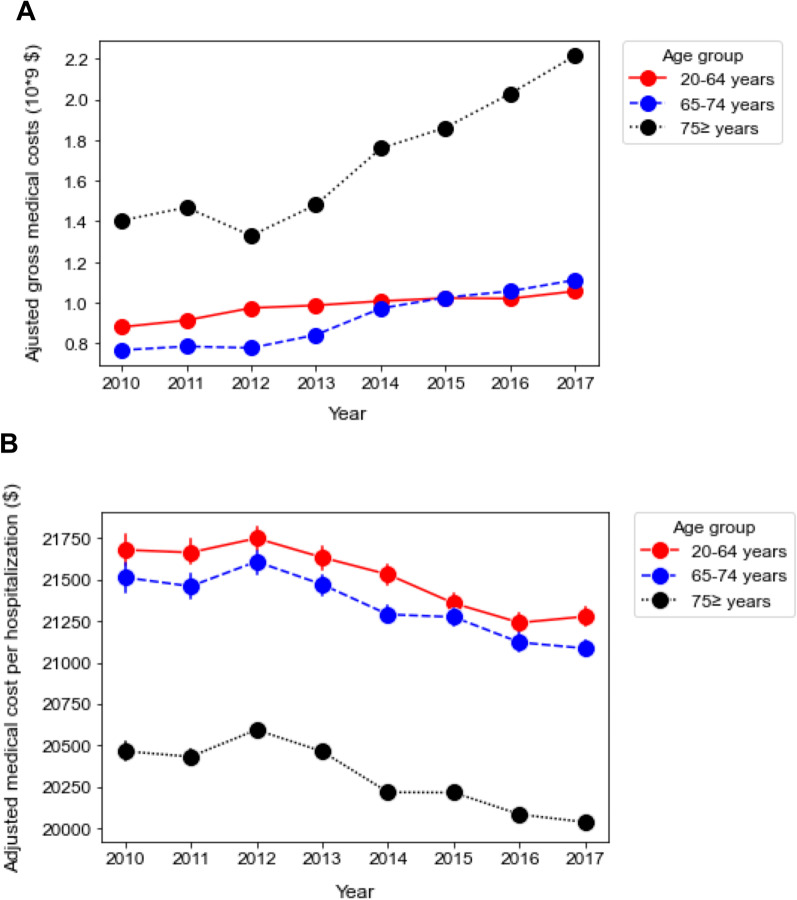
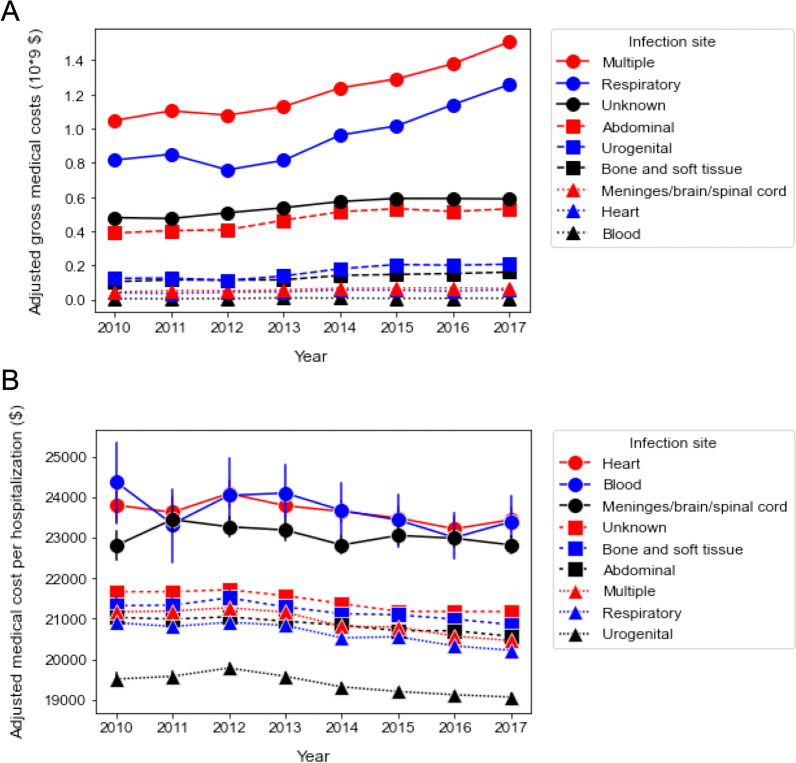
Results: Among 50,490,128 adult patients with claims, a total of 1,276,678 patients with sepsis were selected from the database. Yearly gross medical costs to treat sepsis gradually increased over the decade from $3.04 billion in 2010 to $4.38 billion in 2017, whereas the total medical cost per hospitalization declined (rate = - $1075/year, p < 0.0001). While the survival rate of sepsis patients improved during the study period, the effective cost per survivor significantly decreased (rate = - $1806/year [95% CI - $2432 to - $1179], p = 0.001). In the subgroup analysis, the trend of decreasing medical cost per hospitalization remained consistent among the subpopulation of age, sex, and site of infection. After adjusting for age, sex (male), number of chronic diseases, site of infection, intensive care unit (ICU) admission, surgery, and length of hospital stay, the admission year was significantly associated with reduced medical costs.
Conclusions: We demonstrated an improvement in annual cost-effectiveness in patients with sepsis between 2010 and 2017. The annual trend of reduced costs was consistent after adjustment with the confounders altering hospital expenses.
Keywords: Cost-effectiveness; Critical care; Diagnosis procedure combination; Medical cost; Sepsis.
© 2022. The Author(s).
Conflict of interest statement
The authors have no conflicts of interest to declare.
Figures
Similar articles
-
Association of Intensive Care Unit Case Volume With Mortality and Cost in Sepsis Based on a Japanese Nationwide Medical Claims Database Study.Cureus. 2024 Jul 29;16(7):e65697. doi: 10.7759/cureus.65697. eCollection 2024 Jul. Cureus. 2024. PMID: 39211697 Free PMC article.
-
Mortality analysis among sepsis patients in and out of intensive care units using the Japanese nationwide medical claims database: a study by the Japan Sepsis Alliance study group.J Intensive Care. 2023 Jan 7;11(1):2. doi: 10.1186/s40560-023-00650-x. J Intensive Care. 2023. PMID: 36611188 Free PMC article.
-
Trends in the incidence and outcome of sepsis using data from a Japanese nationwide medical claims database-the Japan Sepsis Alliance (JaSA) study group.Crit Care. 2021 Sep 16;25(1):338. doi: 10.1186/s13054-021-03762-8. Crit Care. 2021. PMID: 34530884 Free PMC article.
-
Epidemiology of sepsis in a Japanese administrative database.Acute Med Surg. 2023 Oct 12;10(1):e890. doi: 10.1002/ams2.890. eCollection 2023 Jan-Dec. Acute Med Surg. 2023. PMID: 37841963 Free PMC article. Review.
-
[Cost-effectiveness analysis of schizophrenic patient care settings: impact of an atypical antipsychotic under long-acting injection formulation].Encephale. 2005 Mar-Apr;31(2):235-46. doi: 10.1016/s0013-7006(05)82390-5. Encephale. 2005. PMID: 15959450 Review. French.
Cited by
-
Care pathways of sepsis survivors: sequelae, mortality and use of healthcare services in France, 2015-2018.Crit Care. 2023 Nov 10;27(1):438. doi: 10.1186/s13054-023-04726-w. Crit Care. 2023. PMID: 37950254 Free PMC article.
-
Association between hospital spending and in-hospital mortality of patients with sepsis based on a Japanese nationwide medical claims database study.Heliyon. 2023 Dec 10;10(1):e23480. doi: 10.1016/j.heliyon.2023.e23480. eCollection 2024 Jan 15. Heliyon. 2023. PMID: 38170111 Free PMC article.
-
Multidrug-Resistant Sepsis: A Critical Healthcare Challenge.Antibiotics (Basel). 2024 Jan 4;13(1):46. doi: 10.3390/antibiotics13010046. Antibiotics (Basel). 2024. PMID: 38247605 Free PMC article. Review.
-
Association of Intensive Care Unit Case Volume With Mortality and Cost in Sepsis Based on a Japanese Nationwide Medical Claims Database Study.Cureus. 2024 Jul 29;16(7):e65697. doi: 10.7759/cureus.65697. eCollection 2024 Jul. Cureus. 2024. PMID: 39211697 Free PMC article.
-
Inflammaging in Multidrug-Resistant Sepsis of Geriatric ICU Patients and Healthcare Challenges.Geriatrics (Basel). 2024 Apr 3;9(2):45. doi: 10.3390/geriatrics9020045. Geriatrics (Basel). 2024. PMID: 38667512 Free PMC article. Review.
References
-
- Fleischmann C, Scherag A, Adhikari NK, Hartog CS, Tsaganos T, Schlattmann P, et al. Assessment of global incidence and mortality of hospital-treated sepsis. Current estimates and limitations. Am J Respir Crit Care Med. 2016;193:259–272. - PubMed
LinkOut - more resources
Full Text Sources
Miscellaneous
