. 2022 Jul 15:28:e936760.
doi: 10.12659/MSM.936760.

Bcl-2 19-kDa Interacting Protein 3 (BNIP3)-Mediated Mitophagy Attenuates Intermittent Hypoxia-Induced Human Renal Tubular Epithelial Cell Injury

Affiliations

Bcl-2 19-kDa Interacting Protein 3 (BNIP3)-Mediated Mitophagy Attenuates Intermittent Hypoxia-Induced Human Renal Tubular Epithelial Cell Injury

Xiao-Bin Zhang et al. Med Sci Monit. .

Retraction in

Abstract

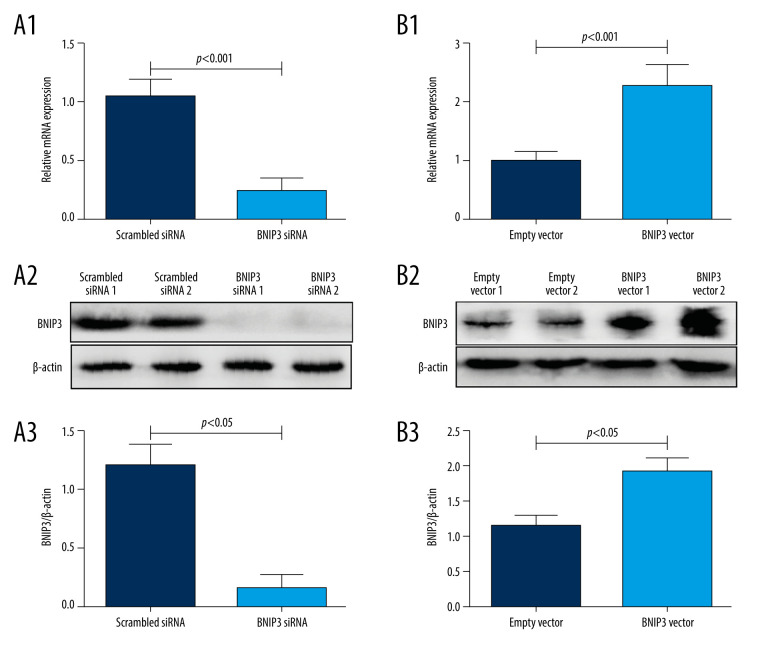
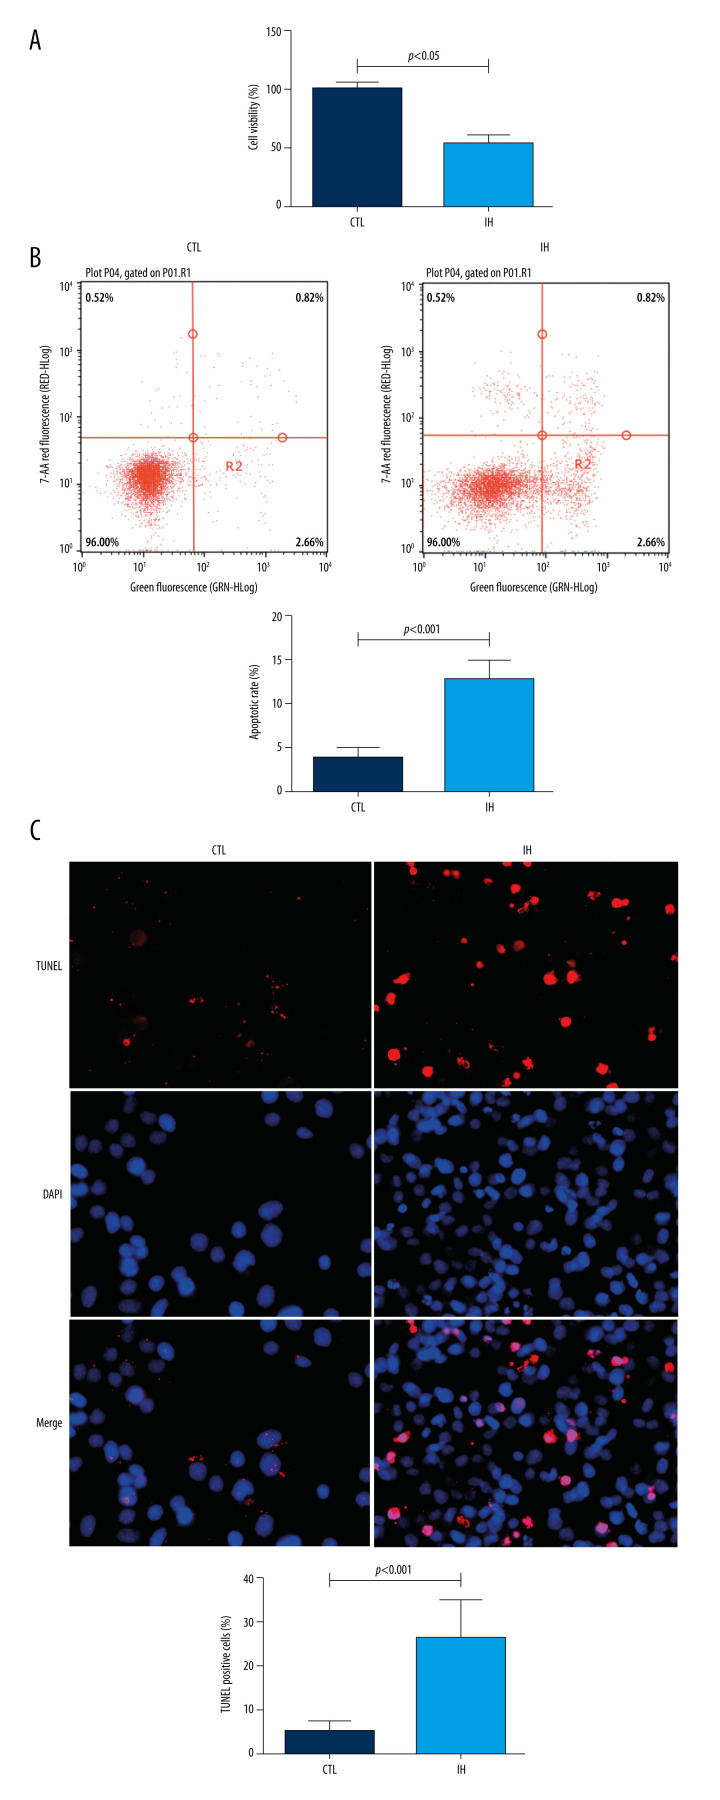
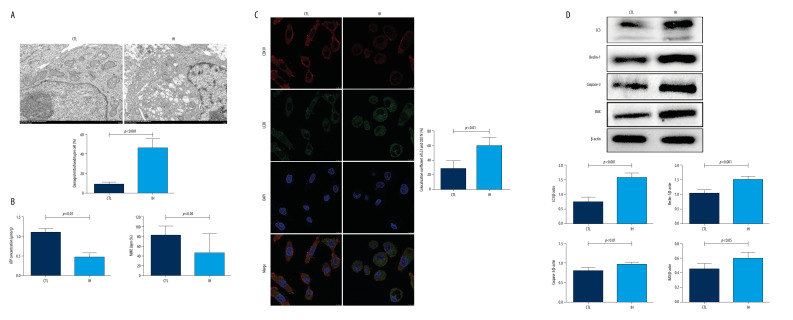
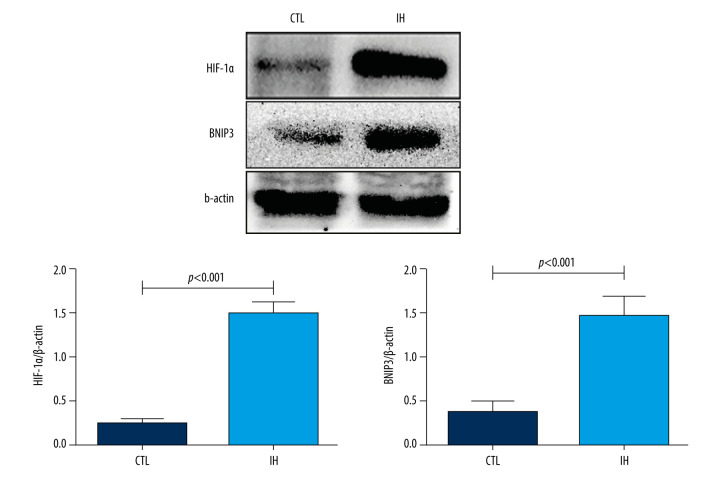
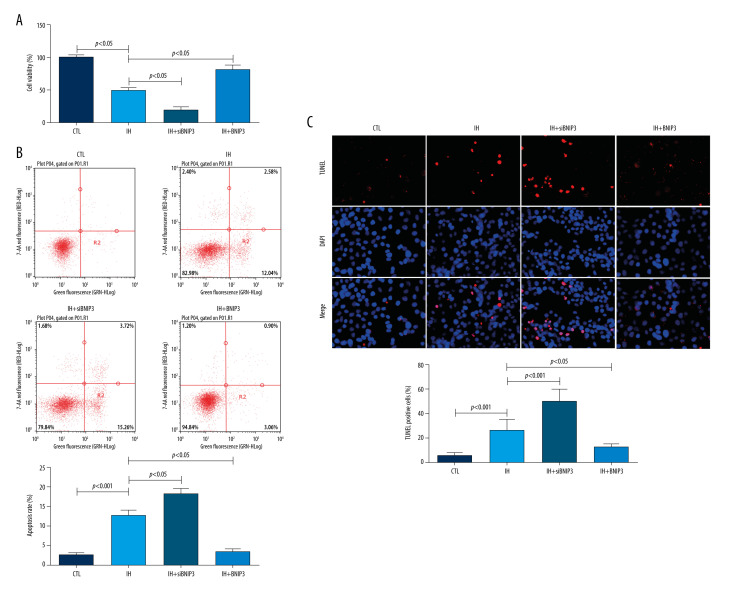
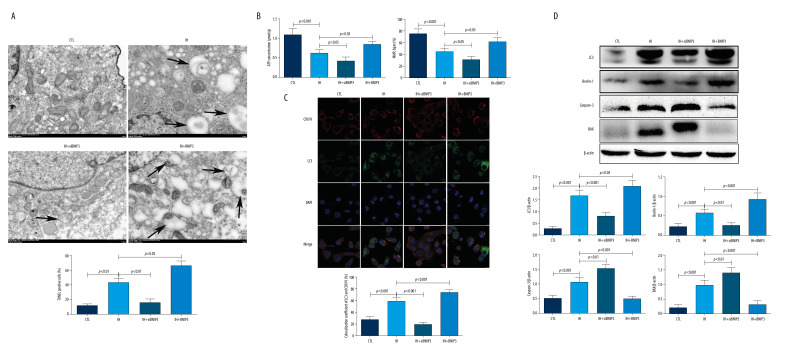
BACKGROUND As a novel pathophysiological characteristic of obstructive sleep apnea, intermittent hypoxia (IH) contributes to human renal tubular epithelial cells impairment. The underlying pathological mechanisms remain unrevealed. The present study aimed to evaluate the influence of Bcl-2 19-kDa interacting protein 3 (BNIP3)-mediated mitophagy on IH-induced renal tubular epithelial cell impairment. MATERIAL AND METHODS Human kidney proximal tubular (HK-2) cells were exposed to IH condition. IH cycles were as follows: 21% oxygen for 25 min, 21% descended to 1% for 35 min, 1% oxygen sustaining for 35 min, and 1% ascended to 21% for 25 min. The IH exposure lasted 24 h with 12 cycles of hypoxia and re-oxygenation. Both the siBNIP3 and BNIP3 vector were transfected to cells. Cell viability and apoptosis, mitochondrial morphology and function, and mitophagy were detected by cell counting kit-8, flow cytometry and TUNEL staining, transmission electron microscopy, western blotting, and immunofluorescence, respectively. RESULTS In the IH-induced HK-2 cells, inhibition of BNIP3 further aggravated mitochondrial structure damage, and decreased mitophagy level, leading to increased cell apoptosis and decreased cell viability. While overexpression of BNIP3 enhanced mitophagy, which protected mitochondrial structure, it can decrease cell death in HK-2 cells exposed to IH. CONCLUSIONS The present study showed that BNIP3-mediated mitophagy plays a protective role against IH-induced renal tubular epithelial cell impairment.


Conflict of interest statement

Conflict of interest: None declared

Figures

Figure 1
Figure 1. Successful transfection proof of BNIP3 siRNA and vector
RT-PCR verified BNIP3 mRNA expression level after transfection with BNIP3 siRNA and vector (A1–A3). Western blotting confirmed the corresponding change in BNIP3 protein level (B1–B3). The figure was created using Image J software version 1.51 (Image J software, National Institutes of Health, Bethesda, MD, USA) and GraphPad Prism version 5.0 (GraphPad Software, Inc., LaJolla, CA, USA).
Figure 2
Figure 2. Effect of IH on cell viability and apoptosis in HK-2 cells
Cell viability was detected with the CCK-8 kit (A). Cell apoptosis was determined by flow cytometry (B) and TUNEL staining (C). All detection was performed after 24 h. The figure was created using confocal laser scanning microscopy version E-C1 (Nikon, Tokyo, Japan) and GraphPad Prism version 5.0 (GraphPad Software, Inc., LaJolla, CA, USA).
Figure 3
Figure 3. Effect of IH on mitochondrial morphology and function in HK-2 cells
(A) Transmission electron microscopy (TEM) demonstrated the morphological changes of mitochondria. Black arrows indicate typical mitophagy visualized as a mitochondria-containing autophagosome. (B) ATP levels were evaluated by an ATP assay kit. Mitochondrial membrane potential (MMP) was determined with JC-1 fluorescence dye. (C) Mitophagy was detected using LC3 green and COX IV red staining and is displayed in the merged image as yellow fluorescence dots; the colocalization coefficient of LC3 and COX IV (%) are presented. (D) Western blotting analysis of LC3, Beclin-1, Caspase-3, and Bax. Densitometry was performed for quantification and the ratio of all the proteins to β-actin was expressed as a fold of control. The figure was created using a Hitachi electron microscope version H7700 (Hitachi, Tokyo, Japan), Confocal laser scanning microscopy version E-C1 (Nikon, Tokyo, Japan), Image J software version 1.51 (Image J software, National Institutes of Health, Bethesda, MD, USA), and GraphPad Prism version 5.0 (GraphPad Software, Inc., LaJolla, CA, USA).
Figure 4
Figure 4. Expression of HIF-1α and BNIP3 between CTL and IH groups in HK-2 cells
The expression of HIF-1α and BNIP3 was determined with western blotting and the ratio of HIF-1α and BNIP3 to β-actin was expressed as a fold of control. The figure was created using Image J software version 1.51 (Image J software, National Institutes of Health, Bethesda, MD, USA) and GraphPad Prism version 5.0 (GraphPad Software, Inc., LaJolla, CA, USA).
Figure 5
Figure 5. Effect of BNIP3 on cell viability and apoptosis in IH-induced HK-2 cells
After being transfected with siBNIP3 and BNIP3 vector, HK-2 cells were exposed to IH for 24 h. Cell morphology was assessed by microscopy and cell viability was quantitatively determined with CCK-8 (A). Flow cytometry (B) and TUNEL staining (C) were conducted to detect cell apoptosis. The figure was created using a Hitachi electron microscope version H7700 (Hitachi, Tokyo, Japan) and Confocal laser scanning microscopy version E-C1 (Nikon, Tokyo, Japan), and GraphPad Prism version 5.0 (GraphPad Software, Inc., LaJolla, CA, USA).
Figure 6
Figure 6. Effect of BNIP3 on mitochondrial morphology and function in IH-induced HK-2 cells
(A) Transmission electron microscope (TEM) demonstrated the morphological changes of mitochondria between groups. Black arrows indicate typical mitophagy visualized as a mitochondria-containing autophagosome. (B) ATP levels was evaluated by an ATP assay kit. Mitochondrial membrane potential (MMP) was determined with JC-1 fluorescence dye. (C) Representative images under the confocal microscope. HK-2 cells were treated with LC3 green and COX IV red to label autophagosomes and mitochondria. A confocal microscope was used to analyze the distribution of different fluorescence. Colocalization of LC3 and COX IV was defined as overlapped green and red peaks. (D) Western blotting was used to detect the expression of LC3, Beclin-1, Caspase-3, and Bax. β-actin was used as the internal control. The figure was created using a Hitachi electron microscope version H7700 (Hitachi, Tokyo, Japan), Confocal laser scanning microscopy version E-C1 (Nikon, Tokyo, Japan), Image J software version 1.51 (Image J software, National Institutes of Health, Bethesda, MD, USA), and GraphPad Prism version 5.0 (GraphPad Software, Inc., LaJolla, CA, USA).

Similar articles

Cited by

References

    1. Hansrivijit P, Puthenpura MM, Ghahramani N, et al. Bidirectional association between chronic kidney disease and sleep apnea: A systematic review and meta-analysis. Int Urol Nephrol. 2021;53:1209–22. - PubMed
    1. Wang Y, Meagher RB, Ambati S, et al. Patients with obstructive sleep apnea have altered levels of four cytokines associated with cardiovascular and kidney disease, but near normal levels with airways therapy. Nat Sci Sleep. 2021;13:457–66. - PMC - PubMed
    1. Lin CH, Perger E, Lyons OD. Obstructive sleep apnea and chronic kidney disease. Curr Opin Pulm Med. 2018;24:549–54. - PubMed
    1. Zhang X-B, Lin Q-C, Deng C-S, et al. Elevated serum cystatin C in severe OSA younger men without complications. Sleep Breath. 2012;17:235–41. - PubMed
    1. Zhang X-B, Jiang X-T, Lin Q-C, et al. Effect of continuous positive airway pressure on serum cystatin C among obstructive sleep apnea syndrome patients. Int Urol Nephrol. 2014;46:1997–2002. - PubMed

Publication types