

Relationships Between Arterial Pressure-Volume Index and Cardiovascular Disease Biomarkers in Patients With Hypertension
- PMID: 35836723
- PMCID: PMC9275434
- DOI: 10.14740/jocmr4732
Relationships Between Arterial Pressure-Volume Index and Cardiovascular Disease Biomarkers in Patients With Hypertension
Abstract
Background: The arterial pressure-volume index (API), which is obtained by conventional blood pressure measurement, is a new marker for arterial stiffness. The aim of this study was to clarify the relationships between the API and various clinical parameters, including cardiovascular disease (CVD) biomarkers, in patients with hypertension for the prevention of CVD.
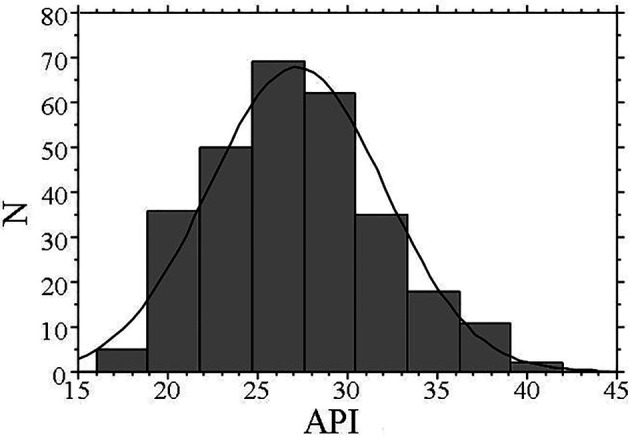
Methods: This cross-sectional study enrolled 288 patients with hypertension receiving pharmacological treatment, without a history of CVD (males/females: 115/173; age: 63 ± 11 years (mean ± standard deviation)). The API was automatically calculated using a commercial device.
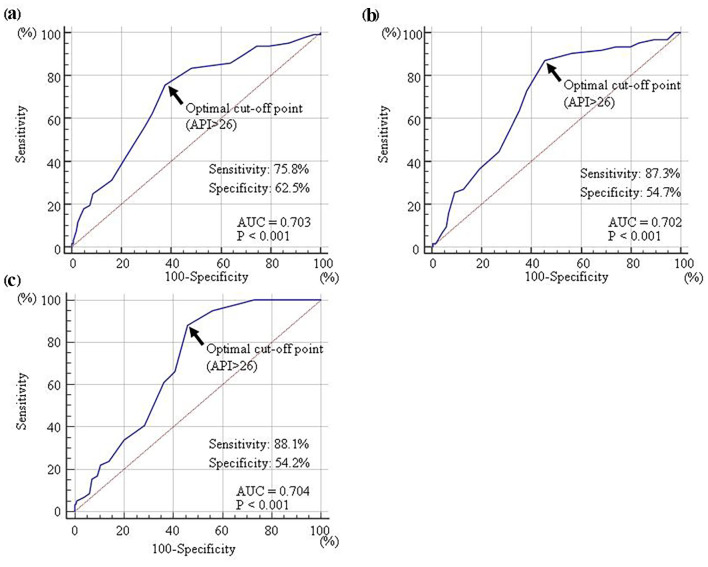
Results: The API was significantly correlated with important CVD biomarkers, such as the concentration of urinary albumin (r = 0.42, P < 0.001), high-sensitivity troponin T (r = 0.39, P < 0.001), and skin autofluorescence (marker of advanced glycation end products in tissues) (r = 0.41, P < 0.001). Multiple regression analyses demonstrated that when the API was used as a subordinate factor, these biomarkers were independent variables. According to the receiver operating characteristic curve analysis, an API of > 26 is the optimal cut-off point for determining albuminuria as ≥ 30 mg/g Cr, high high-sensitivity cardiac troponin T concentration as ≥ 0.014 ng/mL, or high skin autofluorescence as ≥ 3.0 arbitrary unit (area under the curve = 0.703, 0.702, and 0.704; and P < 0.001, respectively).
Conclusion: This investigation demonstrates that API had an independent relationship with relevant CVD biomarkers, such as urinary albumin, high-sensitivity troponin T, and skin autofluorescence. Additionally, the outcomes of receiver operating characteristic curve analysis are presented as values that an API > 26 defines for these biomarkers linked with the formation of CVD.
Keywords: Arterial pressure-volume index; Arterial stiffness; Biomarker; High-sensitivity cardiac troponin T; Hypertension; Skin autofluorescence; Urinary albumin.
Copyright 2022, Hitsumoto.
Conflict of interest statement
None to declare.
Figures
Similar articles
-
Relationships between the arterial velocity pulse index as a novel marker of atherosclerosis and biomarkers of cardiac or renal condition in patients with type 2 diabetes mellitus.Diabetol Int. 2017 Jul 12;9(1):48-55. doi: 10.1007/s13340-017-0329-8. eCollection 2018 Feb. Diabetol Int. 2017. PMID: 30603349 Free PMC article.
-
Relationships Between Skin Autofluorescence and Cardio-Ankle Vascular Index in Japanese Male Patients With Metabolic Syndrome.Cardiol Res. 2019 Jun;10(3):172-180. doi: 10.14740/cr878. Epub 2019 Jun 7. Cardiol Res. 2019. PMID: 31236180 Free PMC article.
-
Skin autofluorescence, arterial stiffness and Framingham risk score as predictors of clinical outcome in chronic kidney disease patients: a cohort study.Nephrol Dial Transplant. 2019 Mar 1;34(3):442-448. doi: 10.1093/ndt/gfx371. Nephrol Dial Transplant. 2019. PMID: 29378035
-
Relationships Between the Cardio-Ankle Vascular Index and Pulsatility Index of the Common Carotid Artery in Patients With Cardiovascular Risk Factors.J Clin Med Res. 2019 Aug;11(8):593-599. doi: 10.14740/jocmr3914. Epub 2019 Jul 27. J Clin Med Res. 2019. PMID: 31413771 Free PMC article.
-
Clinical Significance of Cardio-Ankle Vascular Index as a Cardiovascular Risk Factor in Elderly Patients With Type 2 Diabetes Mellitus.J Clin Med Res. 2018 Apr;10(4):330-336. doi: 10.14740/jocmr3364w. Epub 2018 Feb 18. J Clin Med Res. 2018. PMID: 29511422 Free PMC article.
Cited by
-
Usefulness of Serum Testosterone Concentration and Skin Autofluorescence as Coronary Risk Markers in Male Patients With Type 2 Diabetes Mellitus.Cardiol Res. 2024 Aug;15(4):253-261. doi: 10.14740/cr1686. Epub 2024 Jul 30. Cardiol Res. 2024. PMID: 39205964 Free PMC article.
References
-
- Everett BM, Zeller T, Glynn RJ, Ridker PM, Blankenberg S. High-sensitivity cardiac troponin I and B-type natriuretic Peptide as predictors of vascular events in primary prevention: impact of statin therapy. Circulation. 2015;131(21):1851–1860. doi: 10.1161/CIRCULATIONAHA.114.014522. - DOI - PMC - PubMed
-
- Pontremoli R, Leoncini G, Viazzi F, Ratto E, Vaccaro V, Falqui V, Parodi A. et al. Evaluation of subclinical organ damage for risk assessment and treatment in the hypertensive patient: role of microalbuminuria. J Am Soc Nephrol. 2006;17(4 Suppl 2):S112–114. doi: 10.1681/ASN.2005121327. - DOI - PubMed
LinkOut - more resources
Full Text Sources