. 2022 Jun 28:16:912654.
doi: 10.3389/fninf.2022.912654. eCollection 2022.

Modeling the Sequential Pattern Variability of the Electromotor Command System of Pulse Electric Fish

Affiliations

Modeling the Sequential Pattern Variability of the Electromotor Command System of Pulse Electric Fish

Angel Lareo et al. Front Neuroinform. .

Abstract

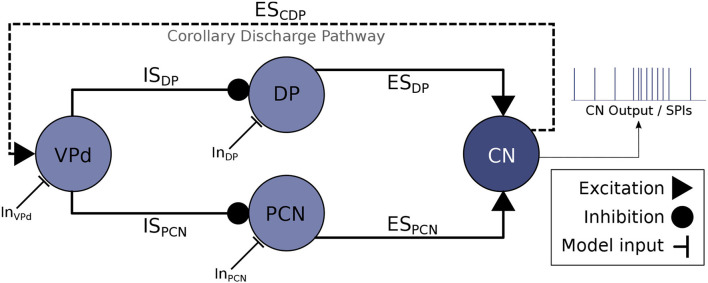
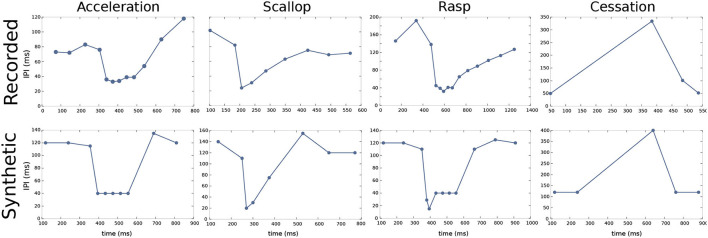
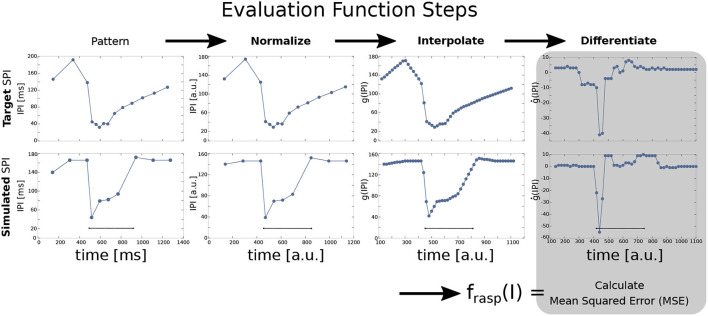
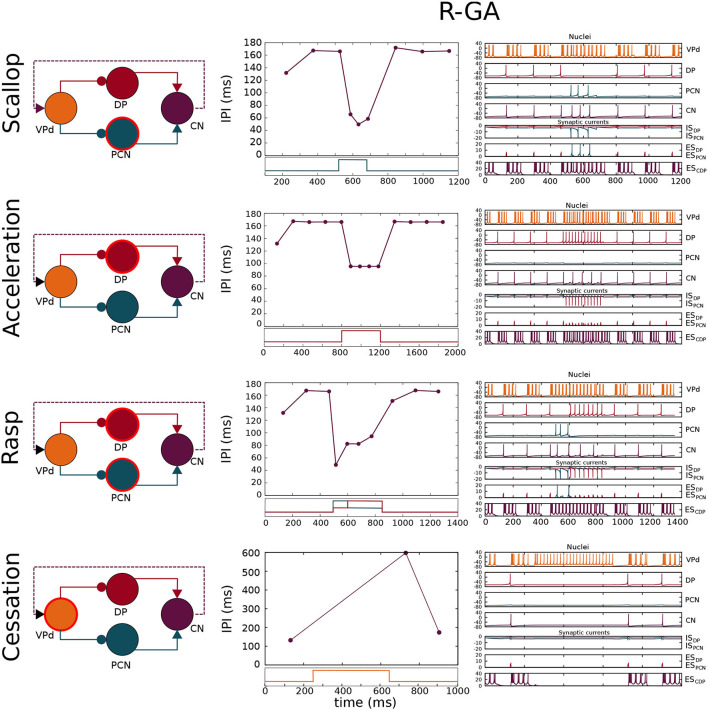
Mormyridae, a family of weakly electric fish, use electric pulses for communication and for extracting information from the environment (active electroreception). The electromotor system controls the timing of pulse generation. Ethological studies have described several sequences of pulse intervals (SPIs) related to distinct behaviors (e.g., mating or exploratory behaviors). Accelerations, scallops, rasps, and cessations are four different SPI patterns reported in these fish, each showing characteristic stereotyped temporal structures. This article presents a computational model of the electromotor command circuit that reproduces a whole set of SPI patterns while keeping the same internal network configuration. The topology of the model is based on a simplified representation of the network with four neuron clusters (nuclei). An initial configuration was built to reproduce nucleus characteristics and network topology as described by detailed morphological and electrophysiological studies. Then, a methodology based on a genetic algorithm (GA) was developed and applied to tune the model connectivity parameters to automatically reproduce a whole set of patterns recorded from freely-behaving Gnathonemus petersii specimens. Robustness analyses of input variability were performed to discard overfitting and assess validity. Results show that the set of SPI patterns is consistently reproduced reaching a dynamic balance between synaptic properties in the network. This model can be used as a tool to test novel hypotheses regarding temporal structure in electrogeneration. Beyond the electromotor model itself, the proposed methodology can be adapted to fit models of other biological networks that also exhibit sequential patterns.

Keywords: computational neuroethology; inter-pulse interval coding; multiple sequence network topology; neural sequences; temporal structure evolutionary tuning.


Conflict of interest statement

The authors declare that the research was conducted in the absence of any commercial or financial relationships that could be construed as a potential conflict of interest.

Figures

Figure 1
Figure 1
Abridged schematic of the electromotor command network based on Bell et al. (1983) and Carlson (2003) and used for developing the computational model discussed in this article. An EOD occurs after each action potential in CN (Grant et al., 1986), thus, CN activations represent the output of the model. CN receives excitatory projections from DP (ESDP) and PCN (ESPCN). Inhibitory afferents are driven to DP and PCN through VPd (ISDP and ISPCN, respectively) triggered by the corollary discharge pathway (ESCDP), which makes VPd to fire a burst of action potentials right after the production of an EOD (Carlson, 2002b). This inhibition feedback seems to regulate the rhythm of EOD output (Von der Emde et al., 2000). Current inputs to the electromotor model (InVPd, InDP, InPCN) can be tuned to simulate different behavioral conditions that give rise to different SPIs.
Figure 2
Figure 2
Characteristic SPI patterns recorded from freely-behaving Gnathonemus petersii specimens (top) and examples of corresponding synthetic SPIs to evolve and validate the electromotor command network model (bottom). Regarding the different SPIs, accelerations are sustained IPI shortenings to a series of almost regular shorter IPIs; scallops are sudden drops to very short IPIs (below the minimum IPI in accelerations) followed by a recovery to regular resting IPIs; rasps are a combination of a sudden drop to very short IPIs as in a scallop followed by a step increase of IPIs duration for a sustained series of IPIs; cessations are activity dropping in the EOD generation for periods up to 1 s. All of them have different temporal structures (Moller, ; Moller et al., ; Carlson and Hopkins, 2004b), different behavioral significance, and they result from different activations within the electromotor network (Carlson, ; Carlson and Hopkins, 2004a). Recorded SPIs were obtained from experimental data recordings of living G. petersii specimens and were used as targets for the R-GA configuration of the model. A set of synthetic SPIs were constructed preserving the characteristic temporal structure of previously reported SPI patterns (Carlson and Hopkins, 2004b), they were used as targets for obtaining the S-GA configuration of the model.
Figure 3
Figure 3
Steps for SPI output fitness evaluation in a rasp pattern example comparing a target SPI (top) and a simulated SPI (bottom). The input current step function is injected at 500 ms and lasts for 400 ms. First, the SPI is normalized to 1,000 arbitrary units (in the figure, it is represented starting at the first IPI). Normalized IPIs are then interpolated every 20 ms and differentiated (ġ(IPI)). Finally, the mean squared error (MSE) is calculated between the target SPI pattern and the simulated one to get the fitting value for one specific pattern (Equation 7). The fitness value of the overall model is the sum of the fitness results for each pattern (refer to Equation 6).
Figure 4
Figure 4
Simulation of the four SPI patterns in the configuration adjusted to patterns recorded from freely-behaving G. petersii specimens (R-GA). Each row shows a schematic of the network where the nucleus/nuclei responsible for generating the SPI (Caputi et al., 2005) is/are highlighted using a circular red stroke. The results are depicted in two columns: the first one shows SPIs resulting from the simulation, and the second one shows the nuclei voltages and synaptic currents. Each chart is related to its corresponding nuclei/synapse by color. Step functions used as current inputs to activate nuclei/nucleus are depicted under each SPI pattern, and they are also related to their corresponding nuclei by color. Relevant model parameters optimized by the GA are described in Table 1. Simulation parameters used in the simulations are described in Supplementary Section 3.
Figure 5
Figure 5
Robustness to input variability analysis of the R-GA electromotor model tuned to recorded G. petersii SPI patterns (Left). The central point in the left panel represents the reference fitness value. The one obtained simulating the model under the predetermined simulation conditions (i.e., ΔDuration = 0 and ΔIntensity = 0). Duration and intensity of the step function current input were varied from –0.5 to 0.5 from their initial values, and the relative change in the fitness value was calculated as described by Equation 9. Reddish colors represent decreases in the fitness value under variable stimulation. White colors represent an equivalent result to the reference fitness value. Blueish colors represent an improvement in the fitness value. Representative example of distinct current inputs in the simulation at different places of the chart (Right).
Figure 6
Figure 6
Mean and variance of simulated SPIs using the R-GA model under the variated simulation conditions of the robustness analysis (refer to Figure 5). As in the GA fitness function, the duration of each simulation was normalized to 1,000 arbitrary units for representation, starting at its first IPI. The blue line is the mean SPI from the executions with variated inputs, blue shade represents the SD. Finally, the SPI represented in black is the closest target pattern. Simulations of each SPI pattern were divided into three partitions (with a similar number of elements) according to its fitting value: the ones that obtain better fitting (upper row: Δf < −100), those that obtain similar results to the reference fitness value (center row: −100 < Δf < 100) and the ones that yield worse fitting results (bottom row: 100 < Δf).
Figure 7
Figure 7
Mean euclidean distance (calculated after the evaluation function steps depicted in Figure 3) between each target SPI pattern and the simulated SPIs during the R-GA robustness analysis. Each chart shows the distance calculated to a different target SPI: scallop, acceleration, rasp, and cessation; and the darkest bar in each chart highlights the simulations corresponding to that target. This bar was expected to be minimum in each case as it represents the mean distance between the set of simulations of a specific SPI and its corresponding target. This held true for all cases. Differences from cessation simulations are not depicted to improve the clarity of the comparison because they are in a larger order of magnitude.

Similar articles

References

    1. Agapie A., Wright A. H. (2014). Theoretical analysis of steady state genetic algorithms. Appl. Math. 59, 509–525. 10.1007/s10492-014-0069-z - DOI
    1. Baker C. A., Kohashi T., Lyons-Warren A. M., Ma X., Carlson B. A. (2013). Multiplexed temporal coding of electric communication signals in mormyrid fishes. J. Exp. Biol. 216(Pt 13), 2365–2379. 10.1242/jeb.082289 - DOI - PMC - PubMed
    1. Bass A. H., Hopkins C. D. (1983). Hormonal control of sexual differentiation: changes in electric organ discharge waveform. Science 220, 971–974. 10.1126/science.6844924 - DOI - PubMed
    1. Bell C., Grant K. (1989). Corollary discharge inhibition and preservation of temporal information in a sensory nucleus of mormyrid electric fish. J. Neurosci. 9, 1029–1044. 10.1523/JNEUROSCI.09-03-01029.1989 - DOI - PMC - PubMed
    1. Bell C., Libouban S., Szabo T. (1983). Pathways of the electric organ discharge command and its corollary discharges in mormyrid fish. J. Compar. Neurol. 216, 327–338. 10.1002/cne.902160309 - DOI - PubMed

LinkOut - more resources