. 2022 Jul 4;12(11):5237-5257.
doi: 10.7150/thno.70884. eCollection 2022.

Stress-induced premature senescence is associated with a prolonged QT interval and recapitulates features of cardiac aging

Affiliations

Stress-induced premature senescence is associated with a prolonged QT interval and recapitulates features of cardiac aging

Edoardo Lazzarini et al. Theranostics. .

Abstract

Rationale: Aging in the heart is a gradual process, involving continuous changes in cardiovascular cells, including cardiomyocytes (CMs), namely cellular senescence. These changes finally lead to adverse organ remodeling and resulting in heart failure. This study exploits CMs from human induced pluripotent stem cells (iCMs) as a tool to model and characterize mechanisms involved in aging. Methods and Results: Human somatic cells were reprogrammed into human induced pluripotent stem cells and subsequently differentiated in iCMs. A senescent-like phenotype (SenCMs) was induced by short exposure (3 hours) to doxorubicin (Dox) at the sub-lethal concentration of 0.2 µM. Dox treatment induced expression of cyclin-dependent kinase inhibitors p21 and p16, and increased positivity to senescence-associated beta-galactosidase when compared to untreated iCMs. SenCMs showed increased oxidative stress, alteration in mitochondrial morphology and depolarized mitochondrial membrane potential, which resulted in decreased ATP production. Functionally, when compared to iCMs, SenCMs showed, prolonged multicellular QTc and single cell APD, with increased APD variability and delayed afterdepolarizations (DADs) incidence, two well-known arrhythmogenic indexes. These effects were largely ascribable to augmented late sodium current (INaL) and reduced delayed rectifier potassium current (Ikr). Moreover sarcoplasmic reticulum (SR) Ca2+ content was reduced because of downregulated SERCA2 and increased RyR2-mediated Ca2+ leak. Electrical and intracellular Ca2+ alterations were mostly justified by increased CaMKII activity in SenCMs. Finally, SenCMs phenotype was furtherly confirmed by analyzing physiological aging in CMs isolated from old mice in comparison to young ones. Conclusions: Overall, we showed that SenCMs recapitulate the phenotype of aged primary CMs in terms of senescence markers, electrical and Ca2+ handling properties and metabolic features. Thus, Dox-induced SenCMs can be considered a novel in vitro platform to study aging mechanisms and to envision cardiac specific anti-aging approach in humans.

Keywords: Induced pluripotent stem cell-derived cardiomyocytes; aging; heart; senescence.


Conflict of interest statement

Competing Interests: The authors have declared that no competing interest exists.

Figures

Figure 1
Figure 1
Response of human iPS-derived cardiomyocytes (iCMs) to doxorubicin (Dox). (A) Cell viability assay. Cells were labelled with Calcein-AM (green, viable cells) or DRAQ7 (red, dead cells) as described in methods section. Quantitative data (ratio of DRAQ7 positive and Calcein negative cells on the total number of cells) are shown in the bar graphs representing means of four independent experiments ± SEM. * P < 0.05, ** P < 0.01 vs iCMs. (B) Apoptosis was assessed by cleaved caspase-3 staining. Cleaved caspase was stained in green. Counterstaining of nuclei was performed with DAPI (blue). Cardiomyocytes were stained with cardiac Troponin T antibody (cTnT Red). Quantitative data (ratio of caspase positive cells on the total number of cTnT positive cells) are shown in the bar graphs representing means of four independent experiments ± SEM. * P < 0.05, ** P < 0.01 vs iCMs. (C) representative bright-field microscopy images of SA β-gal staining in iCMs and in Dox-treated cells at different concentration (0.2-5 μM). The percentages of SA β-gal-positive cells are shown in the bar graphs representing the mean of four independent experiments ± SEM. * P < 0.05 vs iCMs. (D) representative image showing SA β-gal-positive in SenCM upon excitation at 628 nm (far-red spectrum). Cardiac cTnT is shown in green, SA β-gal is shown in red correspondent bright-field microscopy images of SA β-gal staining is shown in the right panel.
Figure 2
Figure 2
Expression of senescence markers in SenCMs. (A) EdU incorporation in iCM and SenCM. Cells were stained for cTnT followed by counterstaining with DAPI. Quantitative analysis of double-positive cells for EdU and cTnT is shown in the bar graphs representing four independent experiments ± SEM. * P < 0.05, ** P < 0.01 vs iCMs. (B) Representative images of immunofluorescence analysis of iCMs and SenCM using anti-γ-H2AX (green) and anti-sarcomeric α-actinin (red) antibodies. Cells nuclei were counterstained with DAPI. The number of γ-H2AX-positive foci per cell was calculated. Data are means of four independent experiments ± SEM. ** P < 0.01 vs iCMs. (C) Time-course for CDKN2A and CDKN1A mRNA relative expression in SenCMs versus iCMs (black dotted line). Data are means of four independent experiments ± SEM; * P < 0.05. (D) Western blotting analysis of p16 and p21 proteins in iCMs and SenCMs. Quantitative data are densitometry analysis of four independent experiments ± SEM; * P < 0.05. Images are showing nuclear expression of p16 and p21 (green) in iCMs and SenCMs stained for cardiac Troponin-T (red) and counterstained with DAPI.
Figure 3
Figure 3
Expression of SASP and induction of hypertrophy in SenCMs (A) SASP-associated genes mRNA relative expression in SenCMs versus iCMs (black dotted line). Data are means of four independent experiments ± SEM. * P < 0.05, ** P < 0.01 vs iCMs. (B) NPPA and NPPB mRNA relative expression in SenCMs versus iCMs. Data are means of four independent experiments ± SEM. * P < 0.05, ** P < 0.01 vs iCMs. (C) Membrane capacitance (Cm) recorded by patch-clamp technique from SenCMs and iCMs. Data are means of 65 and 45 cells respectively, pooled from four independent experiment ± SEM. * P < 0.05. (D) Cell surface area in SenCMs and iCMs. Data are means of 577 and 459 cells respectively, pooled from four independent experiment ± SEM. * P < 0.05.
Figure 4
Figure 4
Induction of mitochondrial damage in SenCMs. (A) Measurement of oxygen consumption rate (OCR) by Seahorse-XF assay. Time-course of oxygen consumption rate (OCR) is shown in iCMs (black line) and SenCMs (red line). Timing for injection of Oligomycin 1µM, FCCP 0.5µM, Rotenone/Antimycin A 1µM OCR are indicated. (B) Basal respiration was measured as OCR level previous to Oligomycin treatment - minimum OCR level after Rotenone/Antimycin A injection. ATP linked production was measured as maximum OCR level after Oligomycin injection - Basal Respiration. Normalization for cell number was obtained with Sulforhodamine B assay. Data are means of three independent experiments ± SEM; * P < 0.05, ** P < 0.01 vs iCMs. (C) Mitochondrial membrane potential (ΔΨm) is evaluated by potential-sensitive dye JC-10. The graph represents the means of four independent experiments ± SEM ** P < 0.01 vs iCMs. (D) Representative TEM images and quantitative analysis (surface area, Feret's diameter and aspect ratio) of mitochondria morphology in SenCMs (N=136) vs iCMs (N=80). Data are pooled from three independent experiments ± SEM ** P < 0.01. (E) Reactive oxygen species were assessed in SenCMs vs iCMs using DHE assay. Cells were incubated with DHE for intracellular H2O2 detection as described in Methods and Materials. Quantitative data are shown in the bar graph as means of four independent experiments ± SEM; * P < 0.05, ** P < 0.01 vs iCMs. (F) ATP/AMP ratio was by measuring intracellular ATP and AMP levels as described in Methods and Materials. Data are means of four independent experiments ± SEM; * P < 0.05 vs iCMs (G) pThr172 AMPK:AMPKtot protein expression levels. Quantitative data of four independent experiments ± SEM (densitometric values for the proteins of interest normalized for GAPDH). (H) AMPKα1 and AMPKα2 mRNA relative expression in SenCMs versus iCMs. Data are means of three independent experiments ± SEM. * P < 0.05, ** P < 0.01 vs iCMs.
Figure 5
Figure 5
Alterations of electrical activity in SenCMs. (A) The electrical activity of spontaneously beating clusters of iCMs and SenCMs was recorded using MEA for 7 consecutive days after Dox treatment. Data are means of five independent experiments ± SEM; * P < 0.05 vs iCMs. QTcB: QT-interval corrected by Bazett's formula. Examples of field potentials in iCMs and SenCMs at day 1 and 7 are shown. (B) Rate-dependency of APD in isolated SenCMs (N=17) vs iCMs (N=22). Data are pooled from four indipendent experiments. ± SEM. * P < 0.05. Representative APs recorded at 1 Hz in each group are shown. Numerical IK1 (see Methods) was injected through Dynamic Clamp technique to compensate the low expression of native IK1 in iCMs. (C) Rate-dependency of short term variability (STV) of APD90 (left panel) and linear correlations between STV of APD90 and APD90 values (right panel) in each group; data from all stimulation rates were pooled. Data are means of at least 20 cells for every group, pooled from four independent experiments ± SEM. * P < 0.05. (D) DADs incidence in each group; recordings at 1Hz in each group are superimposed on the left to highlight DADs occurrence. *p<0.05 vs iCMs.
Figure 6
Figure 6
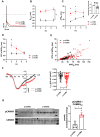
Alterations of IKr, INaL and Ca2+ handling in SenCMs. (A) E-4031 (3µM)-sensitive currents (IKr) activated according to the protocol shown on top and relative I/V relationships in iCMs (N = 21) and SenCMs (N = 26) 5-7 days after treatment. Data pooled from four independent experiments are presented as ± SEM. * P < 0.05, ** P < 0.01 vs iCMs. (B) HERG (KCNH2) protein expression levels in iCMs and SenCMs. Quantitative data of four independent experiments ± SEM (densitometric values for the protein of interest normalized for histone H3). ± SEM. * P < 0.05, ** P < 0.01 vs iCMs. (C) TTX (2 µM)-sensitive current (ITTX) activated during slow voltage ramps (28 mV/sec) from a holding potential of -100 mV. Mean ± SEM I/V relationships for iCMs (N = 12) and SenCMs (N = 13) are shown. Data pooled from four independent experiments are presented as ± SEM. * P < 0.05, ** P < 0.01 vs iCMs. Statistics of ITTX at 0 mV, representative of INaL, are reported on the right. (D) pThr286 CAMKII:CAMKII total protein expression levels in SenCMs versus iCMs. Quantitative data are from four independent experiments ± SEM (densitometric values for the proteins of interest normalized for GAPDH). * P < 0.05, ** P < 0.01 vs iCMs. (E) Membrane currents and Ca2+ transients (CaT) were recorded simultaneously according to the voltage clamp protocol shown on top in Fluo4-loaded iCMs. Examples (left panel) and statistics (right panel) of CaL influx, CaT amplitude and caffeine-induced CaT amplitude (estimating CaSR) in iCMs (N = 22) and SenCMs (N= 14) 5-7 days after Dox treatment. Data pooled from four independent experiments are presented as ± SEM. * P < 0.05, ** P < 0.01 vs iCMs. (F) SERCA2 and monomeric (m) PLN protein expression levels in iCMs and SenCMs. Quantitative data of five independent experiments ± SEM (densitometric values for the protein of interest normalized for actin). (G) Statistics of Ca2+ spark rate and characteristics in SenCMs (N=410) vs iCMs (N=266). Line scan (xt) images are shown on the left (time bar: 100 ms). * P < 0.05, ** P < 0.01 vs iCMs.
Figure 7
Figure 7
Validation of Dox-induced senescence through physiological senescence in mice. (A) APs recorded at 2 Hz in old (o-) vs young (y-) mCMs are superimposed. (B-C) Statistics of rate-dependency of Ediast and APD90 in y-mCMs (N=25-34) and o-mCMs (N=17-31). In comparison to y-mCMs, a significative portion of o-mCMs failed to adapt at 7 Hz (statistics in the inset on the right). Data pooled from four independent experiments are presented as ± SEM; * P < 0.05, ** P < 0.01 vs iCMs. (D) Rate-dependency of short term variability (STV) of APD90. (E) linear correlations between STV of APD90 and APD90 values in each group; data from all stimulation rates were pooled. Data pooled from four independent experiments are presented as ± SEM; * P < 0.05, ** P < 0.01 vs iCMs. (F) TTX (2 µM)-sensitive current (ITTX) activated during slow voltage ramps (28 mV/sec) from a holding potential of -100 mV. Mean ± SEM I/V relationships for y-mCMs (N = 41) and o-mCMs (N = 42) (left panel) and statistics of ITTX at 0 mV, representative of INaL (right panel). Data pooled from four independent experiments are presented as ± SEM; * P < 0.05, ** P < 0.01 vs iCMs. (G) pThr286 CAMKII:CAMKII total protein expression levels in o-mCMs in comparison to y-mCMs. Quantitative data are from six independent experiments ± SEM (densitometric values for the proteins of interest normalized for GAPDH).
Figure 8
Figure 8
Prevention of most aging markers by resveratrol treatment. (A) Protocol outline. (B-D) Statistics of SA β-gal positive cells, ROS levels through DHE assay, and QTc prolongation in all experimental groups (iCMs, SenCMs and SenCms + Resv 25 µM). Quantitative data of three-four independent experiments ± SEM. * P < 0.05, ** P < 0.01 vs SenCMs.

References

    1. Zi H, He SH, Leng XY, Xu XF, Huang Q, Weng H. et al. Global, regional, and national burden of kidney, bladder, and prostate cancers and their attributable risk factors, 1990-2019. Mil Med Res. 2021;8:60. - PMC - PubMed
    1. McHugh D, Gil J. Senescence and aging: Causes, consequences, and therapeutic avenues. J Cell Biol. 2018;217:65–77. - PMC - PubMed
    1. Childs BG, Durik M, Baker DJ, van Deursen JM. Cellular senescence in aging and age-related disease: from mechanisms to therapy. Nat Med. 2015;21:1424–35. - PMC - PubMed
    1. Ogrodnik M, Salmonowicz H, Gladyshev VN. Integrating cellular senescence with the concept of damage accumulation in aging: Relevance for clearance of senescent cells. Aging Cell. 2019;18:e12841. - PMC - PubMed
    1. Kuilman T, Michaloglou C, Mooi WJ, Peeper DS. The essence of senescence. Genes Dev. 2010;24:2463–79. - PMC - PubMed

Publication types