. 2022 Jun 27;12(11):4965-4979.
doi: 10.7150/thno.73152. eCollection 2022.

Docetaxel remodels prostate cancer immune microenvironment and enhances checkpoint inhibitor-based immunotherapy

Affiliations

Docetaxel remodels prostate cancer immune microenvironment and enhances checkpoint inhibitor-based immunotherapy

Zehua Ma et al. Theranostics. .

Abstract

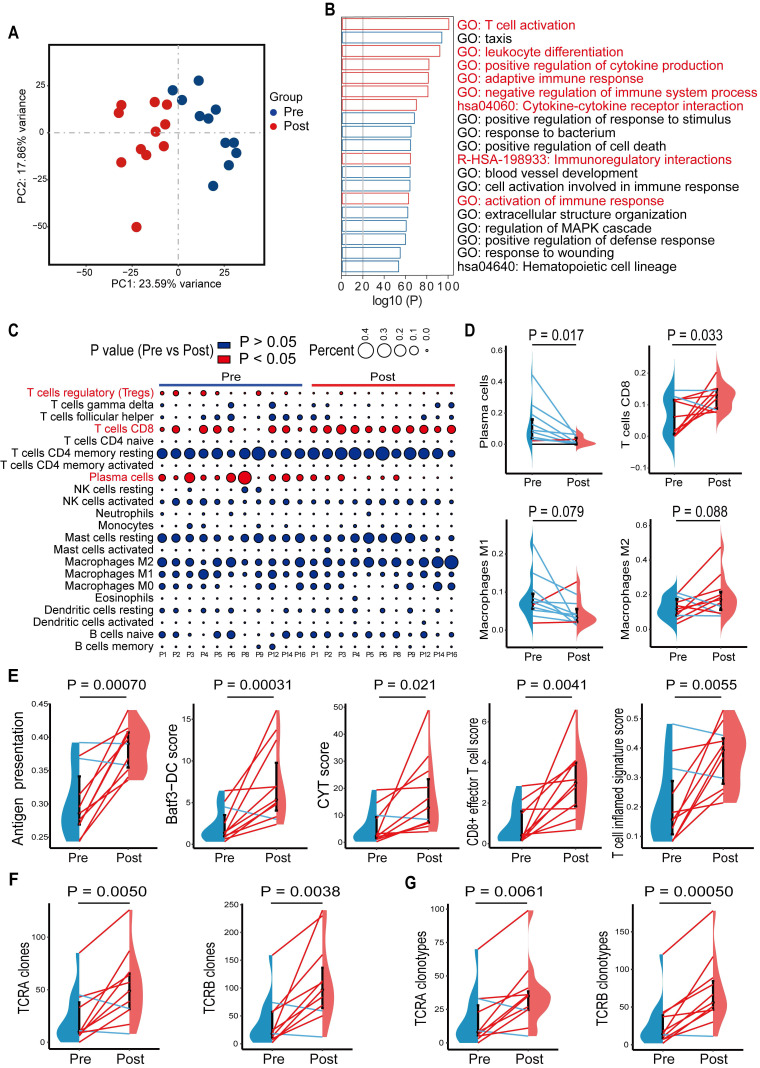
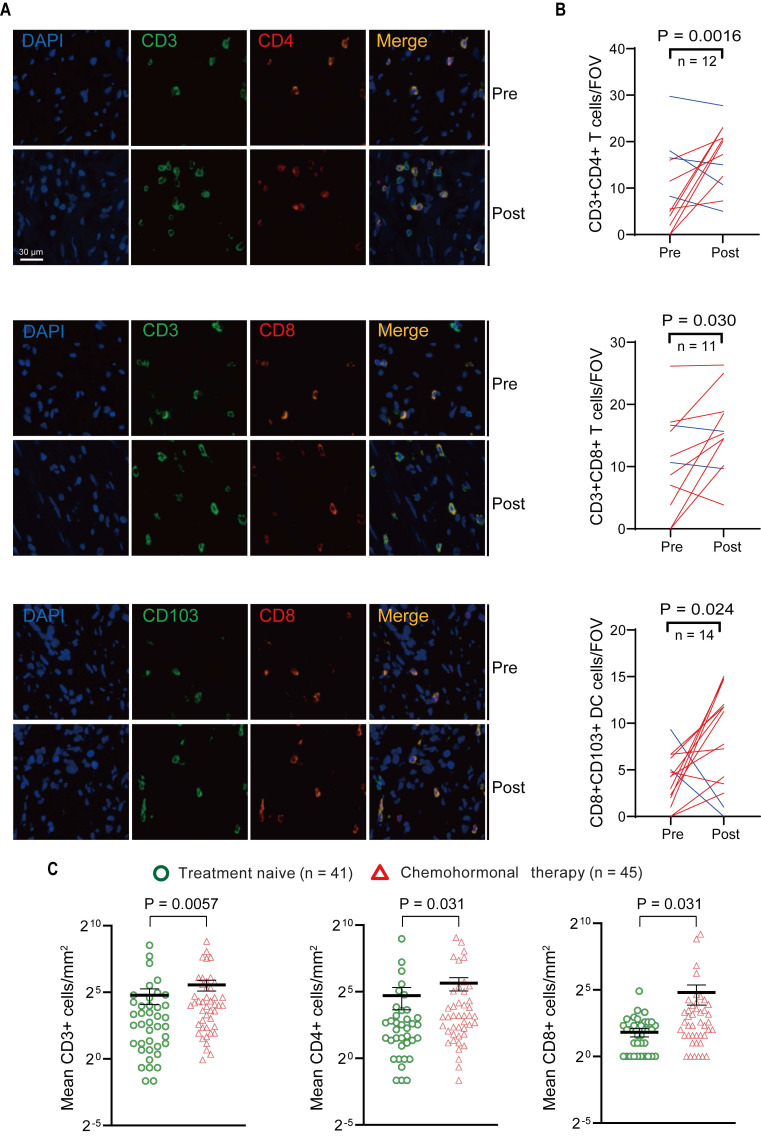
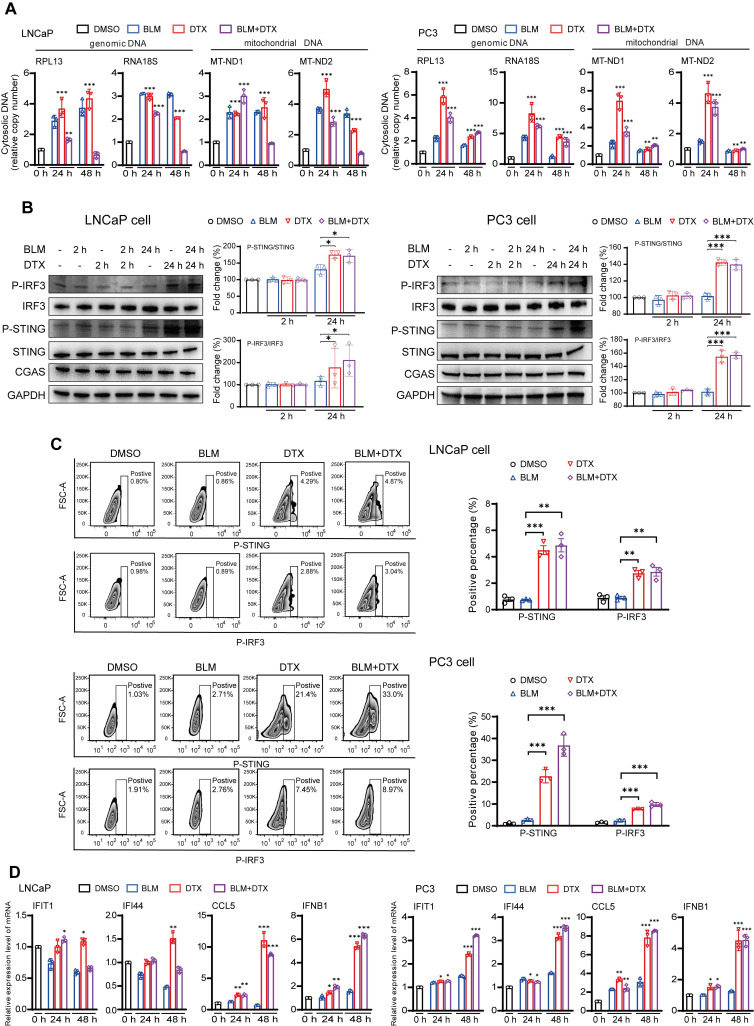
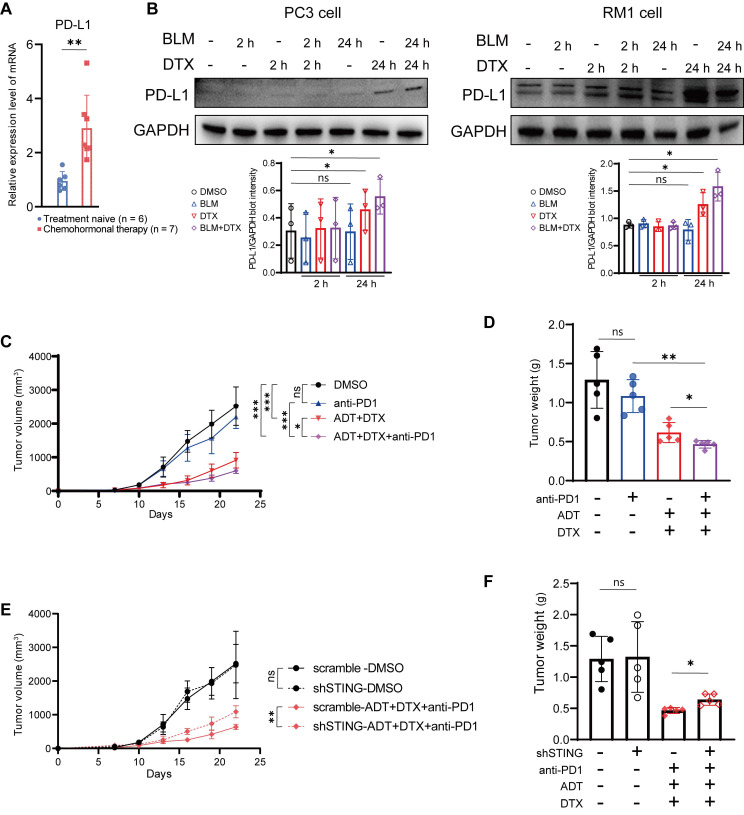
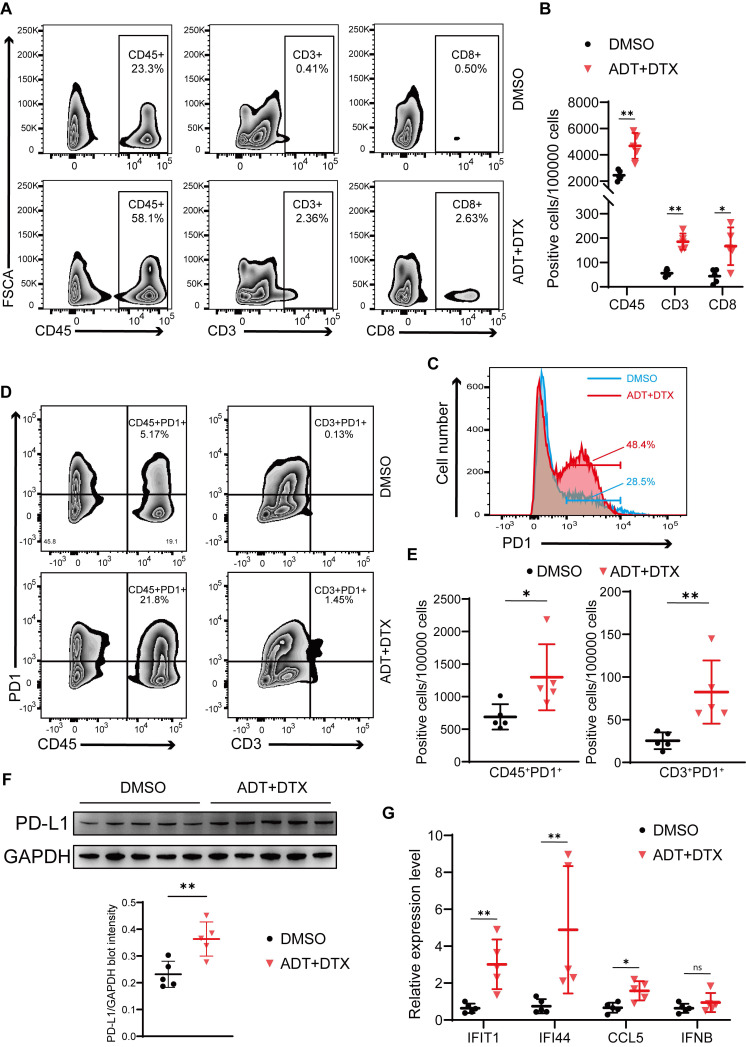
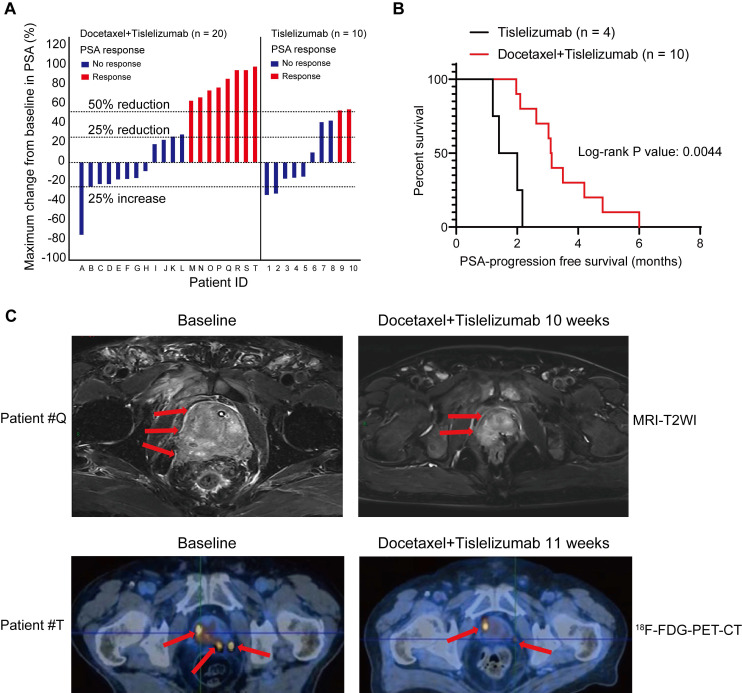
Background: Prostate cancer is usually considered as immune "cold" tumor with poor immunogenic response and low density of tumor-infiltrating immune cells, highlighting the need to explore clinically actionable strategies to sensitize prostate cancer to immunotherapy. In this study, we investigated whether docetaxel-based chemohormonal therapy induces immunologic changes and potentiates checkpoint blockade immunotherapy in prostate cancer. Methods: We performed transcriptome and histopathology analysis to characterize the changes of prostate cancer immune microenvironment before and after docetaxel-based chemohormonal therapy. Furthermore, we investigated the therapeutic benefits and underlying mechanisms of chemohormonal therapy combined with anti-PD1 blockade using cellular experiments and xenograft prostate cancer models. Finally, we performed a retrospective cohort analysis to evaluate the antitumor efficacy of anti-PD1 blockade alone or in combination with docetaxel-based chemotherapy. Results: Histopathology assessments on patient samples confirmed the enrichment of tumor-infiltrating T cells after chemohormonal therapy. Moreover, we found that docetaxel activated the cGAS/STING pathway in prostate cancer, subsequently induced IFN signaling, resulting in lymphocytes infiltration. In a xenograft mouse model, docetaxel-based chemohormonal therapy prompted the intratumoral infiltration of T cells and upregulated the abundance of PD1 and PD-L1, thereby sensitizing mouse tumors to the anti-PD1 blockade. To determine the clinical significance of these results, we retrospectively analyzed a cohort of 30 metastatic castration-resistant prostate cancer patients and found that docetaxel combined with anti-PD1 blockade resulted in better prostate-specific antigen progression-free survival when compared with anti-PD1 blockade alone. Conclusions: Our study demonstrates that docetaxel activates the antitumoral immune response and facilitates T cell infiltration in a cGAS/STING-dependent manner, providing a combination immunotherapy strategy that would improve the clinical benefits of immunotherapy.

Keywords: Docetaxel; Immune microenvironment; Immunotherapy; Prostate Cancer; cGAS/STING.


Conflict of interest statement

Competing Interests: The authors have declared that no competing interest exists.

Figures

Figure 1
Figure 1
Gene signatures of tumors before and after chemohormonal therapy in prostate cancer patients. A. Principal component analysis of transcriptomic data from all 22 patient samples. Each dot represents a patient sample that is colored on the basis of treatment (blue, pretreatment; red, posttreatment). B. The horizontal bar graph showing the top 20 of upregulated differentially enriched pathways and functions in post-chemohormonal therapy tumor samples compared to paired pretreatment samples. Red bars indicate the immune-related differentially expressed pathways and functions. C. Bubble plot illustrating relevant immune cell profiles of paired pre- and post-chemohormonal therapy tumor samples. Bubble size reflects the percentage of immune cell subtypes enriched in corresponding immune cell profile. Bubble color reflects the P value. D. Changes in fractions of plasma cells, CD8 T cells, M1 macrophages, and M2 Macrophages between paired pre- and post-chemohormonal therapy tumor samples. E. Changes in antigen presentation score, Batf3-DC signature score, and three T cell-phenotype signatures scores (CYT score, CD8+ effector T cell score, and T cell inflamed signature score) between paired pre- and post-chemohormonal therapy tumor samples. F. Changes in the numbers of TRA and TRB clones detected between paired pre- and post-chemohormonal therapy tumor samples. G. Changes in the numbers of individual TRA and TRB clonotypes between paired pre- and post-chemohormonal therapy tumor samples. Each point represents an independent sample. Data were presented as mean values ± SEM. Paired data were analyzed using the paired t-test or Wilcoxon paired rank test.
Figure 2
Figure 2
Multiplex immunofluorescence and immunohistochemistry assessment of immune cells in the tumor microenvironment of pre- and post-chemohormonal therapy tumor samples. A. Representative fluorescence images of immunolabeled CD4+ T cells (CD4+CD3+), CD8+ T cells (CD8+CD3+), and tumor-resident T cells (CD103+CD8+) from paired pre- and post-chemohormonal therapy tumor samples. B. Changes in the densities of immune cells in (A) between paired pre- and post-chemohormonal therapy tumor samples. FOV, field of view. C. Scatterplots comparing the densities of tumor-infiltrating lymphocytes, including CD3+ cells, CD4+ cells, and CD8+ cells between treatment naive and chemohormonal therapy treated tumor samples. Each point represents an independent sample. Data were presented as mean values ±SEM. Unpaired data were analyzed using the t-test or Wilcox rank sum test. Paired data were analyzed using the paired t-test or Wilcoxon paired rank test.
Figure 3
Figure 3
Combination of docetaxel and androgen-deprived treatment activates the cGAS/STING pathway in prostate cancer cells. A. QRT-PCR analysis of genomic DNA (RPL13 and RNA18S) and mitochondrial DNA (MT-ND1 and MT-ND2) in LNCaP cells (left panel) and PC3 cells (right panel) after treatment with DMSO, bicalutamide (BLM), docetaxel (DTX), or bicalutamide plus docetaxel (BLM+DTX) for the indicated time. B. Western blot analysis of cGAS/STING pathways components with indicated antibodies in LNCaP cells (left panel) and PC3 cells (right panel) after treatment with DMSO, bicalutamide (BLM), docetaxel (DTX), or bicalutamide plus docetaxel (BLM+DTX) for the indicated time. C. Representative flow plots and quantification of the positive percentage of p-STING and p-IRF3 expression in LNCaP cells (upper panel) and PC3 cells (lower panel) after DMSO, bicalutamide (BLM), docetaxel (DTX), or bicalutamide plus docetaxel (BLM+DTX) treatment for 24 hours. D. QRT-PCR analysis of cGAS/STING pathway downstream immune genes in LNCaP cells (left panel) and PC3 cells (right panel) after treatment with DMSO, bicalutamide (BLM), docetaxel (DTX), or bicalutamide plus docetaxel (BLM+DTX) for the indicated time. Each point represents an independent experiment. Data were presented as mean values ± SEM. Unpaired data were analyzed using the t-test or Wilcox rank sum test. *, P < 0.05; **, P < 0.01; ***, P < 0.001.
Figure 4
Figure 4
Chemohormonal therapy sensitizes RM1 tumor-bearing mice to anti-PD1 blockade therapy. A. QRT-PCR analysis of PD-L1 mRNA level in treatment naive and chemohormonal therapy tumor samples. Each point represents an independent sample. B. Western blot showing the protein level of PD-L1 in PC3 cells (left panel) and RM1 cells (right panel) after treatment with DMSO, bicalutamide (BLM), docetaxel (DTX), or bicalutamide plus docetaxel (BLM+DTX) for the indicated time. Each point represents an independent experiment. C-D. Tumor size (C) and tumor weight (D) of RM1 tumor xenografts in C57 mice, treated with castration plus either DMSO, anti-PD1 (RMP1-14, 6 mg/kg), bicalutamide (20 mg/kg) + docetaxel (10 mg/kg), or combination treatment. Tumor sizes were measured every 3 days. Each point represents an independent sample. E-F. Tumor size (E) and tumor weight (F) of RM1 (scramble or shSTING) tumor xenografts in C57 mice, treated with castration plus either DMSO or anti-PD1 (RMP1-14, 6 mg/kg) + bicalutamide (20 mg/kg) + docetaxel (10 mg/kg). Tumor sizes were measured every 3 days. Each point represents an independent sample. Data were presented as mean values ±SEM. Unpaired data were analyzed using the t-test or Wilcox rank sum test. *, P < 0.05; **, P < 0.01; ***, P < 0.001.
Figure 5
Figure 5
Chemohormonal therapy activates immune response to suppress xenografted tumors growth. A-B. Representative flow plots (A) and densities (B) of intratumoral CD45+ leukocytes, CD3+ T cells, and CD8+ T cells in xenografted tumors of indicated groups. C. The distribution of PD1 expression in xenografted tumors of indicated groups. The proportion of cells is indicated in the plot. D-E. Representative flow plots (D) and densities (E) of CD45+PD1+ cells and CD3+ PD1+ cells in xenografted tumors of indicated groups. F. Western blot showing the protein level of PD-L1 in xenografted tumors of indicated groups. G. QRT-PCR analysis of cGAS/STING pathway downstream immune genes in xenografted tumors of indicated groups. Each point represents an independent sample. Data were presented as mean values ± SEM. Unpaired data were analyzed using the t-test or Wilcox rank sum test. *, P < 0.05; **, P < 0.01; ***, P < 0.001.
Figure 6
Figure 6
Pilot clinical study to determine metastatic castration-resistant prostate cancer (mCRPC) response to docetaxel plus tislelizumab therapy. A. PSA responses among chemotherapy-naive mCRPC patients after the treatment of tislelizumab with or without docetaxel. Patients were labelled from A to T (left panel) or 1-10 (right panel). B. PSA progression-free survival in patients with ≥25% PSA reduction after the treatment of tislelizumab with or without docetaxel. C. The representative MRI images (upper panel) and 18F-FDG-PET-CT images (lower panel) showing tumor regression in two patients (patient #Q and #T) during the combination treatment of docetaxel and tislelizumab.

References

    1. Sung H, Ferlay J, Siegel R, Laversanne M, Soerjomataram I, Jemal A. et al. Global cancer statistics 2020: globocan estimates of incidence and mortality worldwide for 36 cancers in 185 countries. CA: a cancer journal for clinicians. 2021;71:209–49. - PubMed
    1. Cornford P, van den Bergh RCN, Briers E, Van den Broeck T, Cumberbatch MG, De Santis M. et al. Eau-eanm-estro-esur-siog guidelines on prostate cancer. part ii-2020 update: treatment of relapsing and metastatic prostate cancer. European Urology. 2021;79:263–82. - PubMed
    1. Petrylak DP, Tangen CM, Hussain MH, Lara PN Jr, Jones JA, Taplin ME. et al. Docetaxel and estramustine compared with mitoxantrone and prednisone for advanced refractory prostate cancer. N Engl J Med. 2004;351:1513–20. - PubMed
    1. Galon J, Bruni D. Approaches to treat immune hot, altered and cold tumours with combination immunotherapies. Nature reviews Drug discovery. 2019;18:197–218. - PubMed
    1. Sharma P, Allison J. The future of immune checkpoint therapy. Science (New York, NY) 2015;348:56–61. - PubMed

Publication types