KDM4 inhibitor SD49-7 attenuates leukemia stem cell via KDM4A/MDM2/p21CIP1 axis
- PMID: 35836814
- PMCID: PMC9274755
- DOI: 10.7150/thno.71460
KDM4 inhibitor SD49-7 attenuates leukemia stem cell via KDM4A/MDM2/p21CIP1 axis
Abstract
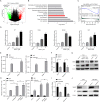
Rationale: Traditional treatments for leukemia fail to address stem cell drug resistance characterized by epigenetic mediators such as histone lysine-specific demethylase 4 (KDM4). The KDM4 family, which acts as epigenetic regulators inducing histone demethylation during the development and progression of leukemia, lacks specific molecular inhibitors. Methods: The KDM4 inhibitor, SD49-7, was synthesized and purified based on acyl hydrazone Schiff base. The interaction between SD49-7 and KDM4s was monitored in vitro by surface plasma resonance (SPR). In vitro and in vivo biological function experiments were performed to analyze apoptosis, colony-formation, proliferation, differentiation, and cell cycle in cell sub-lines and mice. Molecular mechanisms were demonstrated by RNA-seq, ChIP-seq, RT-qPCR and Western blotting. Results: We found significantly high KDM4A expression levels in several human leukemia subtypes. The knockdown of KDM4s inhibited leukemogenesis in the MLL-AF9 leukemia mouse model but did not affect the survival of normal human hematopoietic cells. We identified SD49-7 as a selective KDM4 inhibitor that impaired the progression of leukemia stem cells (LSCs) in vitro. SD49-7 suppressed leukemia development in the mouse model and patient-derived xenograft model of leukemia. Depletion of KDM4s activated the apoptosis signaling pathway by suppressing MDM2 expression via modulating H3K9me3 levels on the MDM2 promoter region. Conclusion: Our study demonstrates a unique KDM4 inhibitor for LSCs to overcome the resistance to traditional treatment and offers KDM4 inhibition as a promising strategy for resistant leukemia therapy.
Keywords: Leukemia stem cells; Lysine-specific demethylase 4; Small molecular compounds.
© The author(s).
Conflict of interest statement
Competing Interests: The authors have declared that no competing interest exists.
Figures


Similar articles
-
KDM4 Demethylases: Structure, Function, and Inhibitors.Adv Exp Med Biol. 2023;1433:87-111. doi: 10.1007/978-3-031-38176-8_5. Adv Exp Med Biol. 2023. PMID: 37751137
-
Jmjd2/Kdm4 demethylases are required for expression of Il3ra and survival of acute myeloid leukemia cells.Genes Dev. 2016 Jun 1;30(11):1278-88. doi: 10.1101/gad.280495.116. Epub 2016 Jun 2. Genes Dev. 2016. PMID: 27257215 Free PMC article.
-
Advances in histone demethylase KDM4 as cancer therapeutic targets.FASEB J. 2020 Mar;34(3):3461-3484. doi: 10.1096/fj.201902584R. Epub 2020 Jan 21. FASEB J. 2020. PMID: 31961018 Review.
-
TACH101, a first-in-class pan-inhibitor of KDM4 histone demethylase.Anticancer Drugs. 2023 Nov 1;34(10):1122-1131. doi: 10.1097/CAD.0000000000001514. Epub 2023 Mar 24. Anticancer Drugs. 2023. PMID: 37067993 Free PMC article.
-
Targeting N-Methyl-lysine Histone Demethylase KDM4 in Cancer: Natural Products Inhibitors as a Driving Force for Epigenetic Drug Discovery.ChemMedChem. 2025 Feb 16;20(4):e202400682. doi: 10.1002/cmdc.202400682. Epub 2024 Nov 21. ChemMedChem. 2025. PMID: 39498961 Free PMC article. Review.
Cited by
-
KDM4 Demethylases: Structure, Function, and Inhibitors.Adv Exp Med Biol. 2023;1433:87-111. doi: 10.1007/978-3-031-38176-8_5. Adv Exp Med Biol. 2023. PMID: 37751137
-
A novel EZH1/2 dual inhibitor inhibits GCB DLBCL through cell cycle regulation and M2 tumor-associated macrophage polarization.J Biol Chem. 2024 Nov;300(11):107788. doi: 10.1016/j.jbc.2024.107788. Epub 2024 Sep 19. J Biol Chem. 2024. PMID: 39303914 Free PMC article.
-
Epigenetics-targeted drugs: current paradigms and future challenges.Signal Transduct Target Ther. 2024 Nov 26;9(1):332. doi: 10.1038/s41392-024-02039-0. Signal Transduct Target Ther. 2024. PMID: 39592582 Free PMC article. Review.
-
Targeted Epigenetic Interventions in Cancer with an Emphasis on Pediatric Malignancies.Biomolecules. 2022 Dec 28;13(1):61. doi: 10.3390/biom13010061. Biomolecules. 2022. PMID: 36671446 Free PMC article. Review.
-
The role of histone post-translational modifications in cancer and cancer immunity: functions, mechanisms and therapeutic implications.Front Immunol. 2024 Nov 15;15:1495221. doi: 10.3389/fimmu.2024.1495221. eCollection 2024. Front Immunol. 2024. PMID: 39620228 Free PMC article. Review.
References
-
- Khwaja A, Bjorkholm M, Gale RE, Levine RL, Jordan CT, Ehninger G. et al. Acute myeloid leukaemia. Nat Rev Dis Primers. 2016;2:16010. - PubMed
-
- Hanekamp D, Cloos J, Schuurhuis GJ. Leukemic stem cells: identification and clinical application. International journal of hematology. 2017;105(5):549–557. - PubMed
-
- de Jonge HJ, Huls G, de Bont ES. Gene expression profiling in acute myeloid leukaemia. The Netherlands journal of medicine. 2011;69(4):167–176. - PubMed
Publication types
MeSH terms
Substances
LinkOut - more resources
Full Text Sources
Medical
Research Materials

