. 2021 Dec 15;32(4):3fc1f5fe.3eccea01.
doi: 10.7171/3fc1f5fe.3eccea01.

Comparative Analysis of Single-Cell RNA Sequencing Platforms and Methods

Affiliations

Comparative Analysis of Single-Cell RNA Sequencing Platforms and Methods

John M Ashton et al. J Biomol Tech. .

Abstract

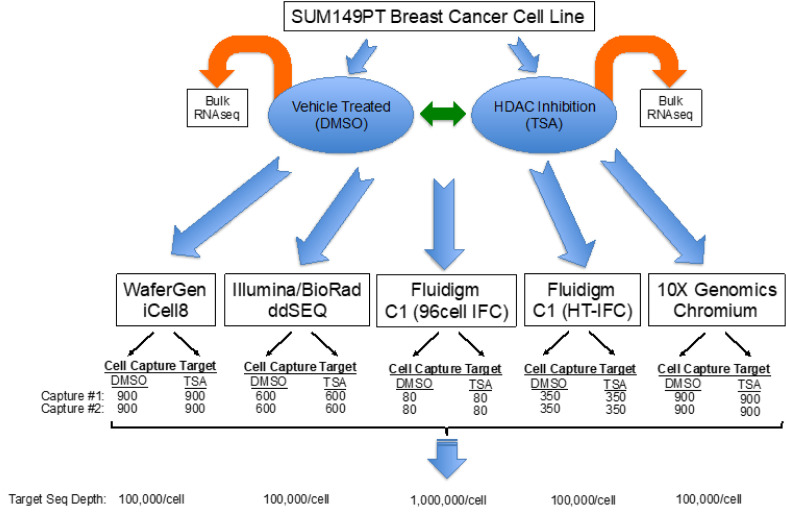
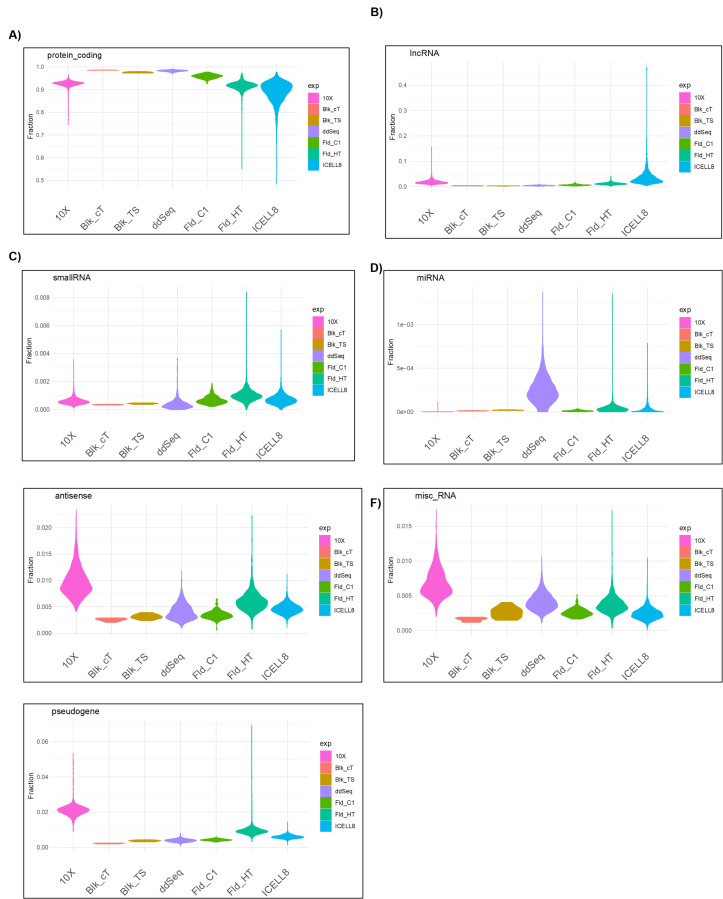
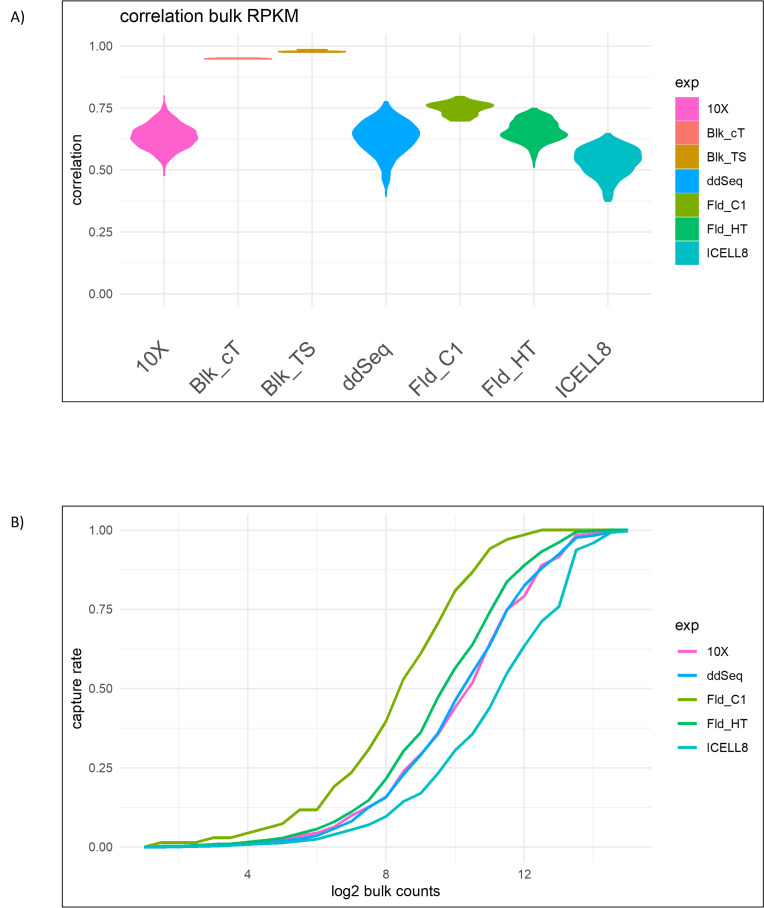
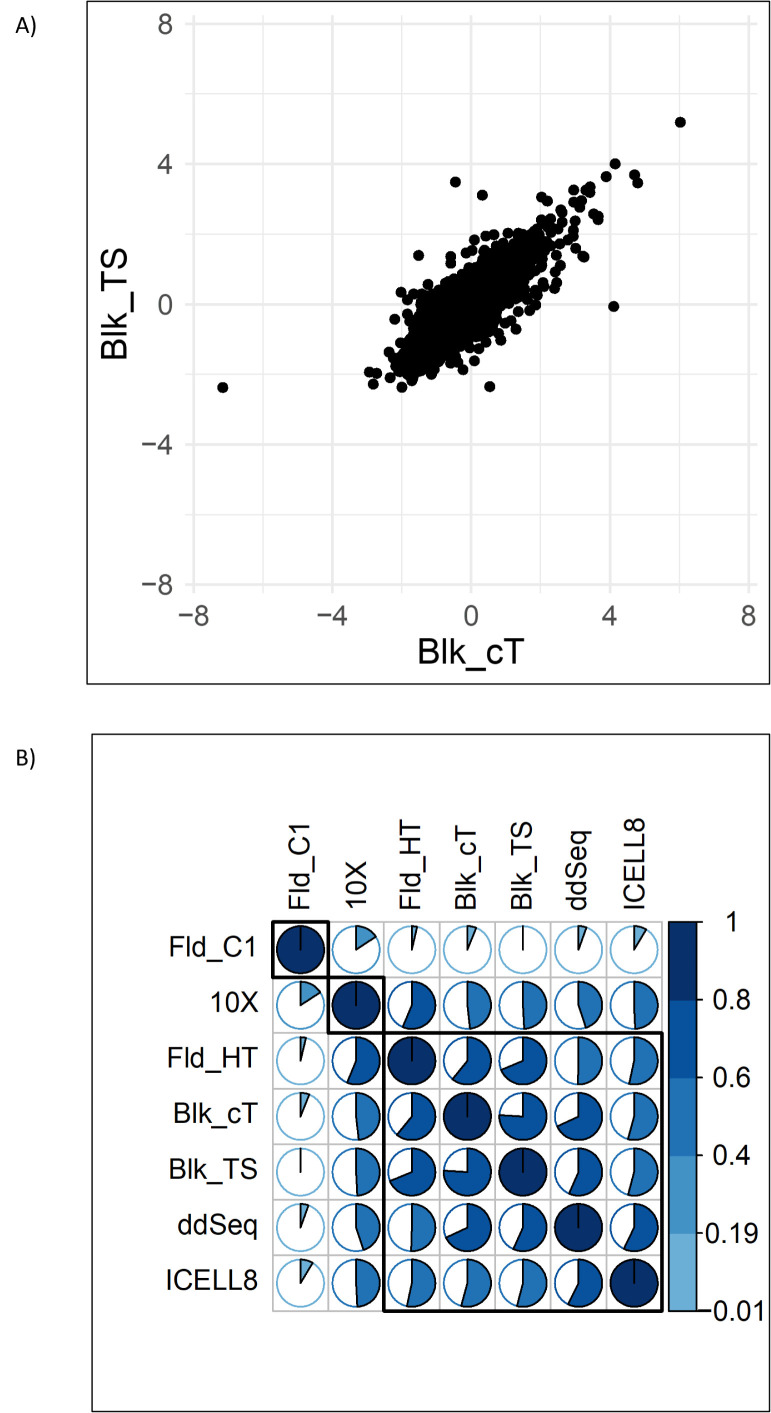
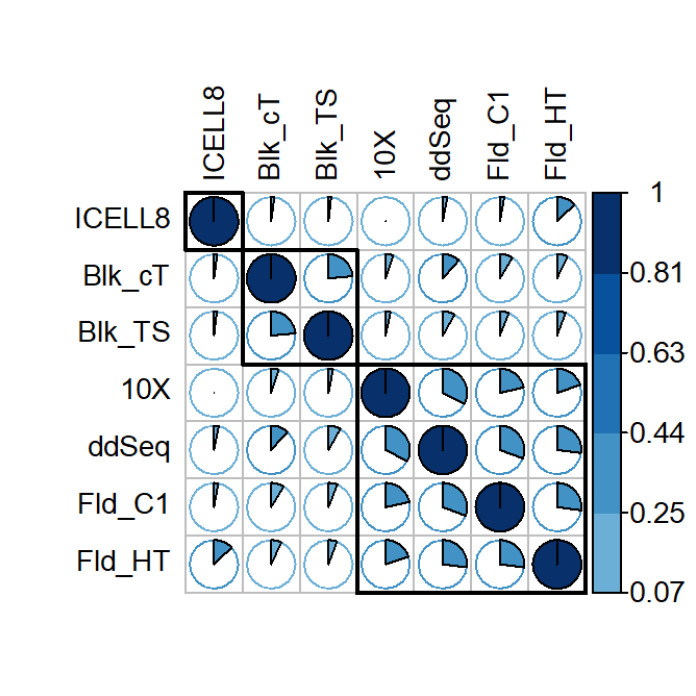
Single-cell RNA sequencing (scRNA-seq) offers great new opportunities for increasing our understanding of complex biological processes. In particular, development of an accurate Human Cell Atlas is largely dependent on the rapidly advancing technologies and molecular chemistries employed in scRNA-seq. These advances have already allowed an increase in throughput for scRNA-seq from 96 to 80,000 cells on a single instrument run by capturing cells within nanoliter droplets. Although this increase in throughput is critical for many experimental questions, a thorough comparison between microfluidic-based, plate-based, and droplet-based technologies or between multiple available platforms utilizing these technologies is largely lacking. Here, we report scRNA-seq data from SUM149PT cells treated with the histone deacetylase inhibitor trichostatin A versus untreated controls across several scRNA-seq platforms (Fluidigm C1, WaferGen iCell8, 10x Genomics Chromium Controller, and Illumina/BioRad ddSEQ). The primary goal of this project was to demonstrate RNA sequencing methods for profiling the ultra-low amounts of RNA present in individual cells, and this report discusses the results of the study, as well as technical challenges and lessons learned and present general guidelines for best practices in sample preparation and analysis.

Keywords: RNA-seq; platforms; single cell.


Conflict of interest statement

Conflict of Interest Disclosures: The authors declare no conflicts of interest.

Figures

FIGURE 1.
FIGURE 1.
Experimental setup. Cells from the sum149PT breast cancer cell line were subjected to DMSO and TSA treatment and subsequently sequenced using different technologies.
FIGURE 2.
FIGURE 2.
We show basic statistics of the single-cell data. (A) The plot shows the number of reads sequenced versus the number of cells targeted for each technology. 10x Genomics targeted the most cells. (B) Violin plots showing the number of genes detected in all cells. The plot shows all cells without quality filtering. (C) The bar plot shows whether the targeted cells were actually detected and passed the QC filtering for each technology.
FIGURE 3.
FIGURE 3.
Sequencing saturation analysis. (A) Cells were sorted by decreasing number of reads, and the number of reads contributing to expression values is plotted. The Fluidigm C1 technology has more reads per cell but less cells than the other technologies. (B) Relationship of the number of genes detected in a cell versus the number of reads contributing to the expression values. (C) Violin plots show the number of genes detected when the sequencing depth is subsampled to 20,000 reads for each cell.
FIGURE 4.
FIGURE 4.
Detection bias of low-GC, high-GC, short, and long genes. The violin plots show the bias present in the individual cells. For reference, we also added the bulk protocols. Interestingly, short genes are underrepresented in bulk RNA-seq and Fluidigm C1 but not in the other scRNA-seq technologies. Overall, the bulk technologies show the smallest bias.
FIGURE 5.
FIGURE 5.
Distribution of gene types detected by the different technologies.
FIGURE 6.
FIGURE 6.
(A) Correlation of single-cell expression profiles with the bulk RNA-seq profile. (B) Gene-detection rate stratified by bulk RNA-seq expression. The plot shows the median detection rate in each strata. The x axis shows the log2 read counts in the bulk RNA-seq data.
FIGURE 7.
FIGURE 7.
Correlation of expression ratios TSA versus DMSO. (A) Scatter plot comparing the 2 bulk RNA-seq technologies. (B) Correlation plot showing the pairwise correlation values as pie charts.
FIGURE 8.
FIGURE 8.
Comparing the highly variable genes across technologies. The plot shows the Jaccard Index of the pairwise overlap of the highly variable genes.

References

    1. Karaayvaz M, Cristea S, Gillespie SM, et al.. Unravelling subclonal heterogeneity and aggressive disease states in TNBC through single-cell RNA-seq. Nat Commun 2018;9:3588. - PMC - PubMed
    1. Navin N, Kendall J, Troge J, et al.. Tumour evolution inferred by single-cell sequencing. Nature 2011;472: 90–94. - PMC - PubMed
    1. Sen R, Dolgalev I, Bayin NS, Heguy A, Tsirigos A, Placantonakis DG. Single-cell RNA sequencing of glioblastoma cells. Methods Mol Biol 2018;1741:151–170. - PubMed
    1. Saunders A, Macosko EZ, Wysoker A, et al.. Molecular diversity and specializations among the cells of the adult mouse brain. Cell 2018;174:1015–1030.e16. - PMC - PubMed
    1. Goldstein LD, Chen Y-JJ, Dunne J, et al.. Massively parallel nanowell-based single-cell gene expression profiling. BMC Genomics 2017;18:519. - PMC - PubMed

MeSH terms