. 2021;6(3):869-875.
doi: 10.1007/s41403-021-00248-5. Epub 2021 Jun 28.

Analysis of Second Wave of COVID-19 in Different Countries

Affiliations

Analysis of Second Wave of COVID-19 in Different Countries

Rajneesh Bhardwaj et al. Trans Indian Natl Acad Eng. 2021.

Abstract

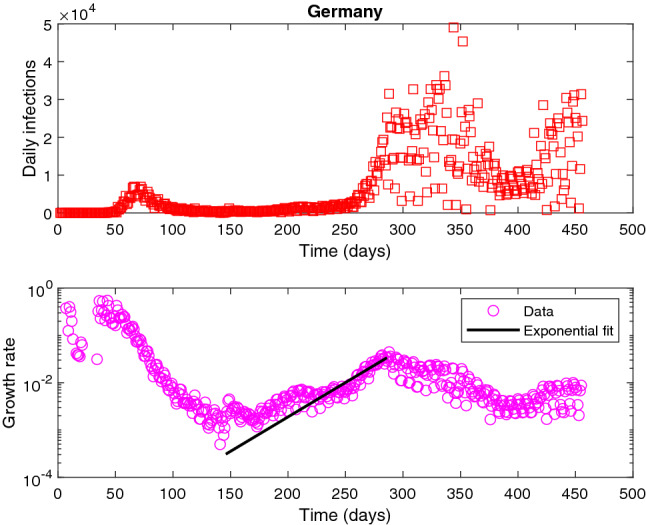
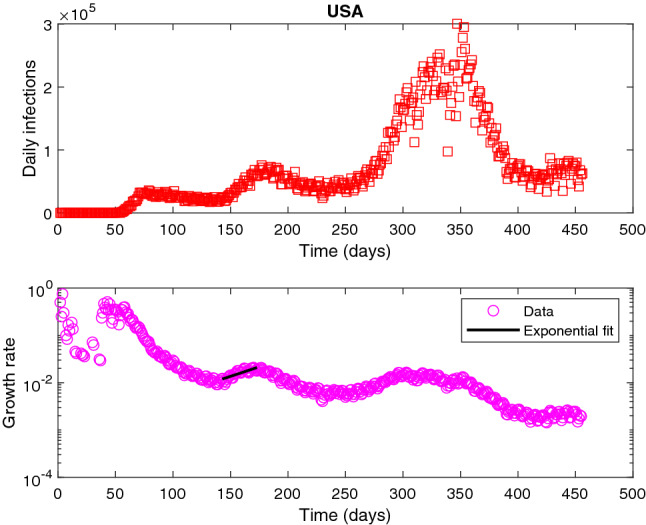
We analyse the evolution of the second wave of the COVID-19 pandemic in several countries by using a logistic model. The model uses a regression analysis based on the least-squares fitting. In particular, the growth rate of the infection has been fitted as an exponential increase, as compared to a power law increase, reported previously in logistic models. The data shows that the increase in the exponent of the exponential increase is around 0.03 day - 1 , with a standard deviation of 0.01 day - 1 . The present results suggest that duration of the peaking of the second wave is almost same for several countries considered. The growth rate is also on the same order of several countries regardless of the total number of infections in a particular country. Since the decay of the growth rate is self-similar to that during the increase in the second wave of several countries, we can predict the end of the second wave in India. The model suggests that the second wave will end in the first week of August 2021, with a growth rate of 0.1% day - 1 at that time.

Keywords: COVID-19; Epidemiology; Logistic model; Second wave.


Figures

Fig. 1
Fig. 1
Data for Belgium. Day 0 is 22 Jan, 2020 and data until 30 April 2021 is analysed. Time-history of daily infections (top frame), growth rate (bottom frame). In bottom frame, the data is shown by symbols while the solid lines are predicted from the model
Fig. 2
Fig. 2
Data for Brazil. Rest of caption is the same as of Fig. 1
Fig. 3
Fig. 3
Data for France. Rest of caption is the same as of Fig. 1
Fig. 4
Fig. 4
Data for Germany. Rest of caption is the same as of Fig. 1
Fig. 5
Fig. 5
Data for India. Rest of caption is the same as of Fig. 1
Fig. 6
Fig. 6
Data for Italy. Rest of caption is the same as of Fig. 1
Fig. 7
Fig. 7
Data for Netherlands. Rest of caption is the same as of Fig. 1
Fig. 8
Fig. 8
Data for Peru. Rest of caption is the same as of Fig. 1
Fig. 9
Fig. 9
Data for Poland. Rest of caption is the same as of Fig. 1
Fig. 10
Fig. 10
Data for South Africa. Rest of caption is the same as of Fig. 1
Fig. 11
Fig. 11
Data for Spain. Rest of caption is the same as of Fig. 1
Fig. 12
Fig. 12
Data for Sweden. Rest of caption is the same as of Fig. 1
Fig. 13
Fig. 13
Data for UK. Rest of caption is the same as of Fig. 1
Fig. 14
Fig. 14
Data for the USA. Rest of caption is the same as of Fig. 1
Fig. 15
Fig. 15
Prediction for India. The end of the second wave is predicted at 566 day from the start of the pandemic or in first week of August. The growth rate will reduce to 0.1% in this week, according to the model predictions
Fig. 16
Fig. 16
Comparison of model prediction with data for India. The growth rate, daily infections and cumulative infections are in very good agreement with the data recorded after 6 May, 2021

References

    1. Ansumali S, Kaushal S, Kumar A, Prakash M, Vidyasagar M (2020) Modelling a pandemic with asymptomatic patients, impact of lockdown and herd immunity, with applications to SARS-CoV-2. Ann Rev Control 50:432–447 - PMC - PubMed
    1. Anand N, Sabarinath A, Geetha S, Somanath S (2020) Predicting the spread of COVID-19 using SIR model augmented to incorporate quarantine and testing. Trans Indian Natl Acad Eng 5(2):141–148 - PMC - PubMed
    1. Asad A, Srivastava S, Verma M (2020) Evolution of COVID-19 pandemic in India. Trans Indian Natl Acad Eng 5(4):711–718 - PMC - PubMed
    1. Bhardwaj R (2020) A predictive model for the evolution of COVID-19. Trans Indian Natl Acad Eng 5(2):133–140 - PMC - PubMed
    1. Bhattacharjee A, Kumar M, Patel KK (2021) When COVID-19 will decline in India? Prediction by combination of recovery and case load rate. Clin Epidemiol Global Health 9:17–20 - PMC - PubMed

LinkOut - more resources