. 2022 Jun 28:13:892239.
doi: 10.3389/fimmu.2022.892239. eCollection 2022.

Spatiotemporal Patterns of Substance P-Bound MRGPRX2 Reveal a Novel Connection Between Macropinosome Resolution and Secretory Granule Regeneration in Mast Cells

Affiliations

Spatiotemporal Patterns of Substance P-Bound MRGPRX2 Reveal a Novel Connection Between Macropinosome Resolution and Secretory Granule Regeneration in Mast Cells

Pia Lazki-Hagenbach et al. Front Immunol. .

Abstract

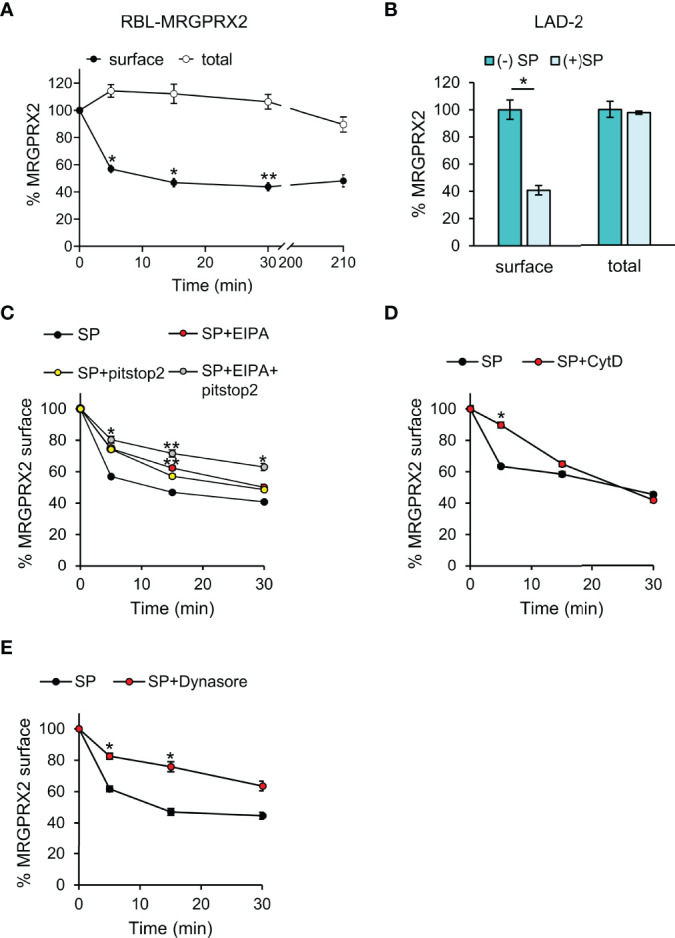
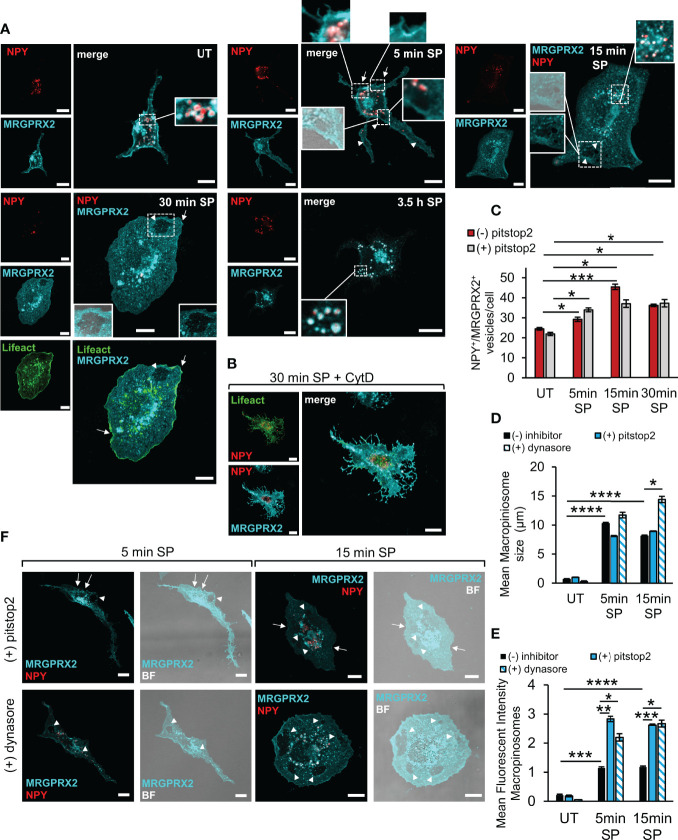
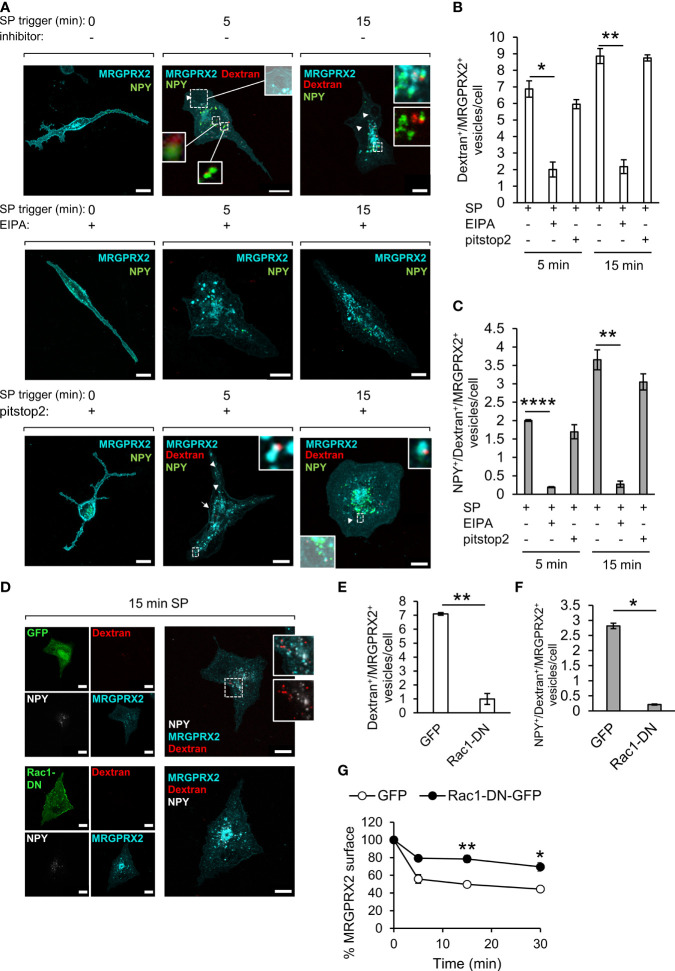
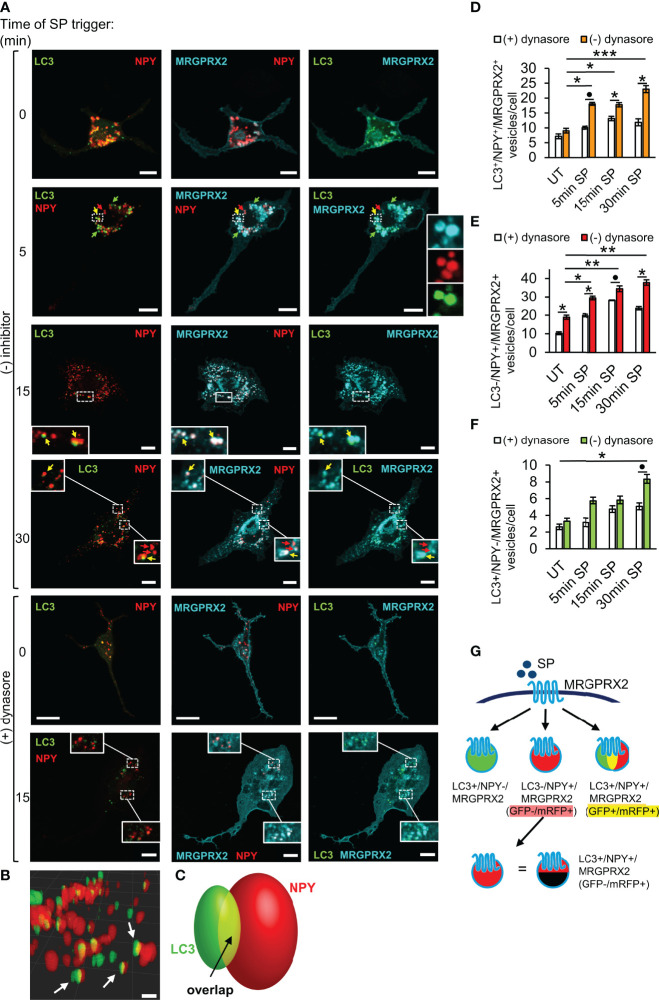
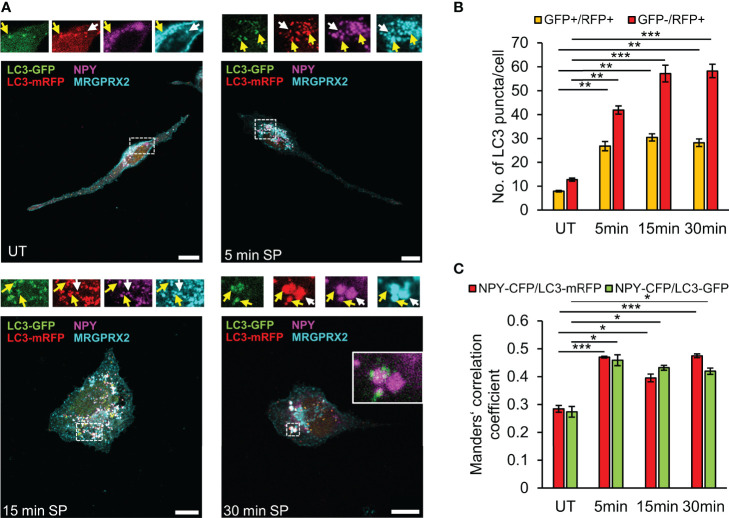
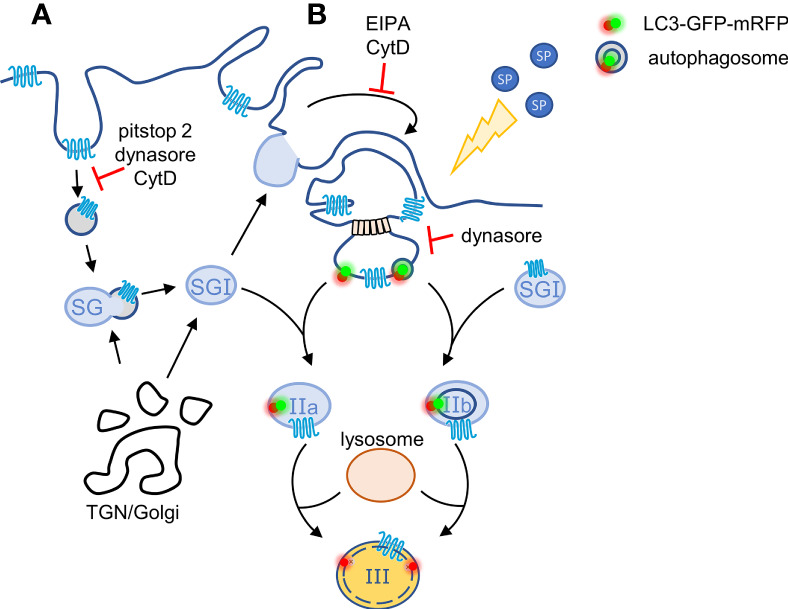
MRGPRX2, the human member of the MAS-related G protein coupled receptors (Mrgprs), serves as the cellular target of human mast cells (MCs) for innate ligands, including neuropeptides and antimicrobial peptides. In addition, MRGPRX2 also functions as the receptor for multiple FDA-approved drugs. As such, MRGPRX2 is a mediator of MC responses in neurogenic inflammation, host defense and pseudoallergy. We analyzed the spatiotemporal patterns of MRGPRX2 following its binding of the neuropeptide substance P (SP). Herein, we show that MRGPRX2 internalizes via both endocytosis and macropinocytosis, followed by its distribution between a perinuclear region and the secretory granules (SGs). Further, we show that MRGPRX2-containing macropinosomes undergo resolution by a mechanism that involves dynamin and LC3, giving rise to the incorporation of both LC3 and MRGPRX2 into the SGs. SP then promotes the acidification of the LC3-associated SGs, presumably by stimulating their fusion with lysosomes. Taken together, our results reveal a unique mode of MRGPRX2 trafficking that complements endocytosis and involves macropinocytosis, autophagic machinery-assisted macropinosome resolution and receptor delivery to the SGs.

Keywords: MRGPRX2; autophagy; endocytosis; macropinocytosis; mast cell; secretory granules; substance P.


Conflict of interest statement

The authors declare that the research was conducted in the absence of any commercial or financial relationships that could be construed as a potential conflict of interest.

Figures

Figure 1
Figure 1
MRGPRX2 internalizes into non-recycling and non-degradative compartment(s). RBL-MRGPRX2 cells (A, C–E) or LAD-2 cells (B) were incubated for 30 min with either vehicle (A, B), or 20 µM pitstop2, 50 µM EIPA or their combination (C), or 10 µM CytD (D), or 80 µM dynasore (E), as indicated. Cells were subsequently triggered with 10 µM SP for the indicated time periods (A, C-E) or for 30 min (B) and stained with anti-MRGPRX2 antibodies in the absence (A, closed circles, B–E) or presence of 0.1% saponin (A, open circles, B). Cells were analyzed by flow cytometry as described under Materials and Methods. Cell surface and total receptor expression are presented as the percentage of cell surface or total MRGPRX2 expression in the absence of trigger. Data are means ± SEM (n = 5-9). Statistical significance was determined by one–way ANOVA, followed by Dunnett’s post-test, for A - C. *P < 0.05, **P < 0.01, and P< 0.05 for 5 min SP vs. 5 min SP +pitstop2, P< 0.01 for 5 min SP vs. 5 min SP + EIPA and P< 0.05 for 15 min SP vs. 15 min SP + pitstop2. Statistical significance was determined by unpaired two-tailed Student’s t-test for B, D and E *P[surface (–):SP vs. (+)SP] = 0.0156, *P[5 min: SP vs. SP+CytD] = 0.019, *P[5 min: SP vs. SP + dynasore] = 0.013, *P[15 min: SP vs. SP + dynasore] = 0.019.
Figure 2
Figure 2
Modes of MRGPRX2 internalization. RBL-MRGPRX2 cells, transiently transfected with NPY-mRFP (red) or NPY-mRFP and Lifeact-GFP (green), as indicated, were either left untreated (UT), or triggered with 10 µM SP for the indicated time periods, in the absence of inhibitor (A, C–E), or following preincubation for 30 min with 10 µM CytD (B), 20 µM pitstop2 (C, D–F) or 80 µM dynasore (D–F), as indicated. Cells were immunostained with anti-HA antibodies, followed by Alexa Fluor® 647-conjugated secondary antibodies (pseudo colored cyan). Enlargements correspond to the boxed areas. Macropinosomes are shown by the overlap with the brightfield (BF) image. Arrows point to MRGPRX2 that is localized to cell ruffles. Arrowheads point to macropinosomes. Scale bars = 10µm. The mean number of vesicles/cell that are double positive for NPY-mRFP and MRGPRX2 (NPY+/MRGPRX2+) (C), the mean size of macropinosomes (D), and the Mean Fluorescent Intensity (MFI) of macropinosome-associated MRGPRX2 (E), were calculated as described under Materials and Methods. Results are the means ± SEM from three independent experiments for dynasore and four independent experiments for pitstop2, each experiment including at least 20 cells/condition. Statistical significance was determined by one–way ANOVA, followed by Dunnett’s post-test for C *P < 0.05, **P < 0.01 and ***P < 0.001. Statistical significance was determined by unpaired two-tailed Student’s t-test for D, ****P[UT vs. 5 min SP] = 6.12552E-08, ****P[UT vs.15 min SP = 1.62931E-07, *P[15 min: SP vs. SP + dynasore] = 0.013, and for E, ***P[UT vs. 5 min SP] = 0.0001, ****P[UT vs. 15 min SP] = 2.01147E-05, *P[5 min: SP vs. SP + dynasore] = 0.042, **P[5 min: SP vs. SP + pitstop2] = 0.0017, *P[15 min: SP vs. SP + dynasore] = 0.0171, ***P[15 min: SP vs. SP + pitstop2] = 4.6873E-06).
Figure 3
Figure 3
MRGPRX2 internalizes by macropinocytosis. RBL-MRGPRX2 cells, transiently transfected with NPY-Venus (green) (A), or co-transfected with NPY-CFP (pseudo colored white) and either GFP or Rac1-DN-GFP (green) (D), were triggered with 10 µM SP in the presence of 0.1 mg/ml TRITC-Dextran (red) for the indicated time periods, in the presence of vehicle (A, D) or following 30 min pre-incubation with either 50 µM EIPA or 20 µM pitstop2, as indicated (A). Cells were immunostained with anti-HA antibodies followed by Alexa Fluor® 647-conjugated secondary antibodies (pseudo colored cyan). Enlargements correspond to the boxed areas. Macropinosomes are shown as the overlap with the brightfield images. Arrows point to MRGPRX2 position at sites of macropinosome formation and arrowheads point to macropinosomes. Scale bars = 10µm. The mean number of vesicles/cell that are double positive for Dextran and MRGPRX2 (Dextran+/MRGPRX2+) (B, E), or triple positive for NPY, Dextran and MRGPRX2 (NPY+/Dextran+/MRGPRX2) (C, F), was calculated for cells that were triggered for the indicated time periods with SP (15 min for E and F), in the absence or presence of the indicated inhibitors or Rac1-DN. Results are means ± SEM from three (D–F, G) or four (A–C) independent experiments, with each experiment including 15-20 cells/condition. The effect of Rac1-DN expression on SP-induced internalization of MRGPRX2 was quantified by flow cytometry, by measuring the cell surface amount of MRGPRX2 gated on GFP-positive single cells. Results are presented as the percentage of the amount of cell surface MRGPRX2 in the absence of stimulation by SP (G). Data are means ± SEM of four independent experiments. Statistical significance was determined by unpaired two-tailed Welch’s t-test. P values for Dextran+/MRGPRX2+ vesicles/cell: *P[5 min: SP vs. SP+ EIPA] = 0.0271, **P[15 min: SP vs. SP + EIPA] = 0.0026, **P[GFP vs. Rac1-DN-GFP] = 0.009. P values for NPY+/Dextran+/MRGPRX2+ vesicles/cell: **P[15 min: SP vs. SP + EIPA] = 0.01, ****P[5 min: SP vs. 5 min SP + EIPA] = 2.996x10^6, *P[GFP vs. Rac1-DN-GFP] = 0.018. P values for MRGPRX2 surface expression are **P[5 min: SP/GFP vs. SP/Rac1-DN-GFP] = 0.01, *P[15 min: SP/GFP vs. SP/Rac1-DN-GFP] = 0.0358.
Figure 4
Figure 4
LC3 and dynamin assist MRGPRX2 trafficking to SGs. RBL-MRGPRX2 cells, transiently co-transfected with NPY-mRFP (red) and LC3-GFP (green), were triggered for the indicated time periods with 10 µM SP, in the presence of vehicle or following 30 min pre-incubation with 80 µM dynasore, as indicated (A). Cells were immunostained with anti-HA antibodies followed by Alexa Fluor® 647-conjugated secondary antibodies (pseudo colored cyan). Yellow arrows point to MRGPRX2 that is localized to NPY-mRFP and LC3-positive SGs, red arrows point to NPY-mRFP-positive, but LC3 negative SGs, and green arrows point to LC3 positive, but NPY-mRFP negative vesicles. Enlargements correspond to the boxed areas. Scale bars = 10µm. Confocal images of cells that were activated for 15 min with SP, were 3-dimensionally reconstructed by using Imaris software (scale bars 2 µm) (B). Arrows point to LC3+/NPY+ vesicles. A scheme of a 3-dimensionally reconstructed LC3+/NPY+ vesicle is shown in (C), showing that some of the fluorescence of LC3-GFP overlaps with NPY-mRFP (yellow). The average number of LC3+/NPY+/MRGPRX2+ (D), LC3-/NPY+/MRGPRX2+ (E), or LC3+/NPY-/MRGPRX2+ (F) vesicles/cell was calculated using the ImageJ software and is presented as the mean ± SEM from three to six independent experiments, with each experiment including at least 20 cells/condition. Statistical significance was determined by one-way ANOVA, followed by Dunnett’s post-test, for comparison of UT with different time points of SP trigger in D-F: *P < 0.05, **P < 0.01, ***P < 0.001, or unpaired two-tailed Welch’s t-test comparison SP ± dynasore for D, *P[LC3+/NPY+/MRGPRX2+ - 5 min: SP vs. SP + dynasore] = 0.0652, for E, *P[LC3+/NPY+/MRGPRX2+ - 15 min: SP vs. SP + dynasore] = 0.0220, *P[LC3+/NPY+/MRGPRX2+ - 30 min: SP vs. SP + dynasore] = 0.0365, and for F, *P[LC3-/NPY+/MRGPRX2+ - UT: SP vs. SP + dynasore] = 0.0191, *P[LC3-/NPY+/MRGPRX2+ - 5 min: SP vs. SP + dynasore] = 0.0238, *P[LC3-/NPY+/MRGPRX2+ - 15 min: SP vs. SP + dynasore] = 0.1049 and *P[LC3-/NPY+/MRGPRX2+ - 5 min: SP vs. SP + dynasore] = 0.0216. A schematic presentation of the types of vesicles into which MRGPRX2 internalizes in response to SP trigger is shown in (G).
Figure 5
Figure 5
SP stimulates fusion of LC3-positive SGs with lysosomes. RBL-MRGPRX2 cells, transiently co-transfected with NPY-CFP (magenta) and LC3-GFP-mRFP (green and red), were either left untreated (UT) or triggered for the indicated time periods with 10 µM SP. Cells were subsequently immunostained with anti-HA antibodies followed by Alexa Fluor® 647-conjugated secondary antibodies (pseudo colored cyan) (A). Enlargements correspond to the boxed areas. Yellow arrows point to MRGPRX2 that is localized to LC3-positive-SGs (GFP+/mRFP+), and white arrows point to MRGPRX2 that is localized to LC3-autolysosome-SGs (GFP-/mRFP+). An example of the merge of NPY-CFP and LC3-GFP is shown in the inset of the 30 min image. Scale bars = 10µm. The average number of double positive GFP+/mRFP+ vesicles or single GFP-/mRFP+ vesicles was quantified using the ImageJ software and is presented as the mean ± SEM from five independent experiments, with each experiment including at least 20 cells/condition (B). The extent of colocalization of NPY-CFP with LC3-mRFP or LC3-GFP was quantified (n = 3) and is presented as Mander’s correlation coefficient (C). Statistical significance was determined by one-way ANOVA, followed by Dunnett’s post-test. *P < 0.05, **P < 0.01, *** P< 0.001.
Figure 6
Figure 6
Model for the crosstalk between macropinosomes and the SGs. According to our model, plasma membrane-localized MRGPRX2 internalizes in response to cell stimulation by SP by two parallel mechanisms: (A) by endocytosis that is partially sensitive to pitstop2 and (B) by macropinocytosis. Endosomes may fuse with the SGs, thereby delivering MRGPRX2 to the SGs, whereas MRGPRX2-containing vesicles bud from macropinosomes by a mechanism that involves dynamin and either the binding of cytosolic or phagophore associated LC3, or fusion with autophagosomes. These vesicles then fuse with TGN-derived SGs (Type I) generating respectively, Type IIa or Type IIb, LC3-positive SGs. The latter then acidify, most likely by their fusion with lysosomes, by a SP-stimulated process, generating Type III SGs.

Similar articles

Cited by

References

    1. Blank U, Huang H, Kawakami T. The High Affinity Ige Receptor: A Signaling Update. Curr Opin Immunol (2021) 72:51–8. doi: 10.1016/j.coi.2021.03.015 - DOI - PubMed
    1. Galli SJ, Tsai M. Mast Cells: Versatile Regulators of Inflammation, Tissue Remodeling, Host Defense and Homeostasis. J Dermatol Sci (2008) 49(1):7–19. doi: 10.1016/j.jdermsci.2007.09.009 - DOI - PMC - PubMed
    1. Jiménez M, Cervantes-García D, Córdova-Dávalos LE, Pérez-Rodríguez MJ, Gonzalez-Espinosa C, Salinas E. Responses of Mast Cells to Pathogens: Beneficial and Detrimental Roles. Front Immunol (2021) 12:685865. doi: 10.3389/fimmu.2021.685865 - DOI - PMC - PubMed
    1. Redegeld FA, Yu Y, Kumari S, Charles N, Blank U. Non-Ige Mediated Mast Cell Activation. Immunol Rev (2018) 282(1):87–113. doi: 10.1111/imr.12629 - DOI - PubMed
    1. Dahlin JS, Maurer M, Metcalfe DD, Pejler G, Sagi-Eisenberg R, Nilsson G. The Ingenious Mast Cell: Contemporary Insights Into Mast Cell Behavior and Function. Allergy (2021) 77:83–99. doi: 10.1111/all.14881 - DOI - PubMed

Publication types