. 2022 Jun 28:13:908000.
doi: 10.3389/fpls.2022.908000. eCollection 2022.

A Novel Combination of Genes Causing Temperature-Sensitive Hybrid Weakness in Rice

Affiliations

A Novel Combination of Genes Causing Temperature-Sensitive Hybrid Weakness in Rice

Than Kutay Soe et al. Front Plant Sci. .

Abstract

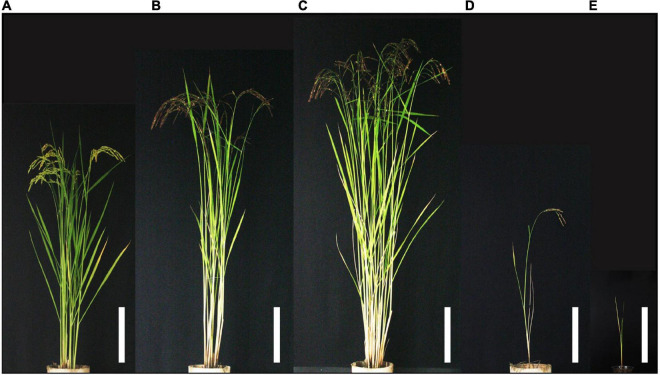
Reproductive isolation is an obstacle for plant breeding when a distant cross is demanded. It can be divided into two main types based on different growth stages: prezygotic isolation and postzygotic isolation. The hybrid weakness, which is a type of postzygotic isolation, can become a problem in crop breeding. In order to overcome reproductive isolation, it is necessary to elucidate its mechanism. In this study, genetic analysis for low temperature-dependent hybrid weakness was conducted in a rice F2 population derived from Taichung 65 (T65, Japonica) and Lijiangxintuanheigu (LTH, Japonica). The weak and severe weak plants in F2 showed shorter culm length, late heading, reduced panicle number, decreased grain numbers per panicle, and impaired root development in the field. Our result also showed that hybrid weakness was affected by temperature. It was observed that 24°C enhanced hybrid weakness, whereas 34°C showed recovery from hybrid weakness. In terms of the morphology of embryos, no difference was observed. Therefore, hybrid weakness affects postembryonic development and is independent of embryogenesis. The genotypes of 126 F2 plants were determined through genotyping-by-sequencing and a linkage map consisting of 862 single nucleotide polymorphism markers was obtained. Two major quantitative trait loci (QTLs) were detected on chromosomes 1 [hybrid weakness j 1 (hwj1)] and 11 [hybrid weakness j 2 (hwj2)]. Further genotyping indicated that the hybrid weakness was due to an incompatible interaction between the T65 allele of hwj1 and the LTH allele of hwj2. A large F2 populations consisting of 5,722 plants were used for fine mapping of hwj1 and hwj2. The two loci, hwj1 and hwj2, were mapped in regions of 65-kb on chromosome 1 and 145-kb on chromosome 11, respectively. For hwj1, the 65-kb region contained 11 predicted genes, while in the hwj2 region, 22 predicted genes were identified, two of which are disease resistance-related genes. The identified genes along these regions serve as preliminary information on the molecular networks associated with hybrid weakness in rice.

Keywords: QTL; genotyping-by-sequencing (GBS); hybrid weakness; reproductive isolation; rice.


Conflict of interest statement

HS was employed by Environmental Control Center Co., Ltd. The remaining authors declare that the research was conducted in the absence of any commercial or financial relationships that could be construed as a potential conflict of interest.

Figures

FIGURE 1
FIGURE 1
Morphology of F2 plants and parents at the reproductive stage. (A) T65, (B) Lijiangxintuanheigu (LTH), (C) normal plant, (D) weak plant, and (E) severe weak plant. Scale bars = 20 cm.
FIGURE 2
FIGURE 2
Segregation of traits in F2 population. Frequency distributions of (A) days to heading, (B) number of panicles, and (C) culm length. The averages of T65 and LTH were shown in each panel. (D) Scatter plot between number of panicles and culm length.
FIGURE 3
FIGURE 3
Heat map showing quantitative trait loci (QTL) for number of panicles by assuming interaction of two loci. Bottom and upper diagonals show the LOD score of full models (LODT) and full-additive model (LODInt = LODT – LODx – LODy), respectively. The yellow circles indicate sites with high LOD values and interaction between the two factors. The scale on the right shows LOD values of upper (left) and bottom (right) diagonals.
FIGURE 4
FIGURE 4
Boxplot of evaluated traits of F2 population in field condition: (A) panicle number, (B) culm length (cm), (C) days to heading, (D) number of grains per main panicle, and (E) seed-setting rate. Different letters in each phenotype represents significant differences among the genotypes based on one-way ANOVA followed by Tukey’s HSD test (p < 0.05).
FIGURE 5
FIGURE 5
Fine mapping of the hwj1 locus. (A) Initial mapping of hwj1 on chromosome 1. Numbers show physical positions in megabase (Mb), (B) fine mapping of hwj1. The hwj1 locus was delimited between flanking markers IDMSO0102 and CAPS_LTH0110. Blue-double head arrow shows candidate region, and (C) annotated genes in the candidate region. The black arrows represent the annotated genes.
FIGURE 6
FIGURE 6
Fine mapping of the hwj2 locus. (A) Initial mapping of hwj2 on chromosome 11. Numbers show physical positions in megabase (Mb), (B) fine mapping of hwj2. The hwj2 locus was delimited between flanking markers CAPS_LTH1101 and CAPS_LTH1107. Blue-double head arrow shows the candidate region, and (C) annotated genes in the candidate region. The red arrows represent NB-LRR disease-resistance gene and disease resistance-related gene. The black arrows represent other annotated genes.
FIGURE 7
FIGURE 7
Morphology of 10-day-old seedlings grown under different temperatures. Seedlings grown at 24°C (A) T65, (B) LTH, (C) normal genotype, (D,E) weak genotypes, and (F) severe weak genotype; seedlings grown at 34°C (G) T65, (H) LTH, (I) normal genotype, (J,K) weak genotypes, and (L) severe weak genotype. Arrowheads point primary root. Arrows point crown root. Scale bars = 5 cm.
FIGURE 8
FIGURE 8
Boxplots of phenotypic evaluations of (A,B) shoot length, (C,D) root Length, and (E,F) number of roots of 10-day-old seedlings grown at 24 and 34°C. Different letters in each phenotype represent significant differences among the genotypes based on one way ANOVA followed by Tukey’s HSD test (p < 0.05).
FIGURE 9
FIGURE 9
Morphology of embryos of F2 and the parents 1 day after soaking in water at 24°C. (A) T65, (B) LTH, (C) normal genotype, (D,E) weak genotypes, and (F) severe weak genotype. Scale bars = 1 mm.
FIGURE 10
FIGURE 10
Histological characteristics of embryos of F2 and the parents in germinating seeds 1 day after soaking in water at 24°C. (A) T65, (B) LTH, (C) normal genotype, (D,E) weak genotypes, and (F) severe weak genotype. The sections (20 μm thick) were stained with hematoxylin and eosin. pl, plumule (shoot meristem); ra, radicle. Scale bars = 500 μm.
FIGURE 11
FIGURE 11
The expression level of pathogen-related genes (PRs) in the leaf blades and sheaths of severe weak genotype (aabb), weak genotypes (aaBb and Aabb), normal genotype (AaBB and AABb), and the parents (T65 and LTH) at 7-day-old seedling stage. (A) PBZ1, (B) PR1a, (C) PR4, and (D) JIOsPR1. Each qRT-PCR analysis was performed with three biological replications, but severe weak plants had no replication. Bars represent the means ± SE. Actin was used as the endogenous control for normalization.

Similar articles

Cited by

References

    1. Alcázar R., García A. V., Kronholm I., de Meaux J., Koornneef M., Parker J. E., et al. (2010). Natural variation at Strubbelig receptor kinase 3 drives immune-triggered incompatibilities between Arabidopsis thaliana accessions. Nat. Genet. 42 1135–1139. 10.1038/ng.704 - DOI - PubMed
    1. Alcázar R., García A. V., Parker J. E., Reymond M. (2009). Incremental steps toward incompatibility revealed by Arabidopsis epistatic interactions modulating salicylic acid pathway activation. Proc. Natl. Acad. Sci. U.S.A. 106 334–339. 10.1073/pnas.0811734106 - DOI - PMC - PubMed
    1. Bomblies K., Lempe J., Epple P., Warthmann N., Lanz C., Dangl J. L., et al. (2007). Autoimmune response as a mechanism for a Dobzhansky-Muller-type incompatibility syndrome in plants. PLoS Biol. 5:e236. 10.1371/journal.pbio.0050236 - DOI - PMC - PubMed
    1. Bomblies K., Weigel D. (2007). Hybrid necrosis: autoimmunity as a potential gene-flow barrier in plant species. Nat. Rev. Genet. 8 382–393. 10.1038/nrg2082 - DOI - PubMed
    1. Broman K. W., Wu H., Sen S., Churchill G. A. (2003). R/qtl: QTL mapping in experimental crosses. Bioinformatics 19 889–890. 10.1093/bioinformatics/btg112 - DOI - PubMed