

Lineage and role in integrative taxonomy of a heterotrophic orchid complex
- PMID: 35837745
- PMCID: PMC9452484
- DOI: 10.1111/mec.16617
Lineage and role in integrative taxonomy of a heterotrophic orchid complex
Abstract
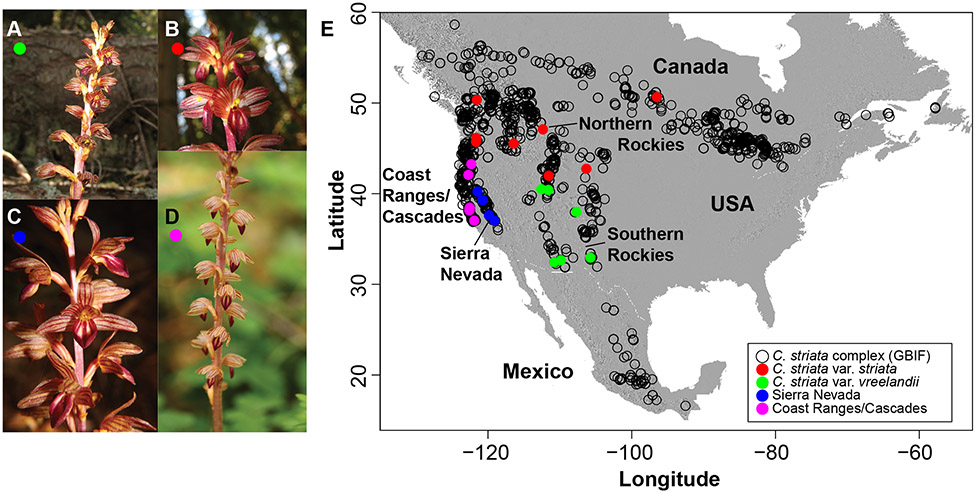
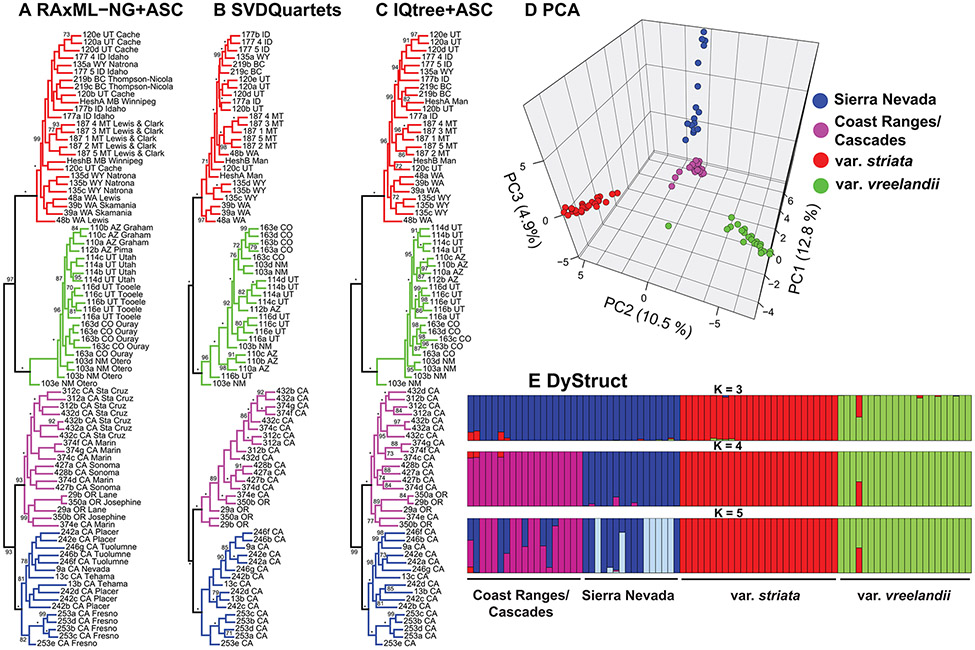
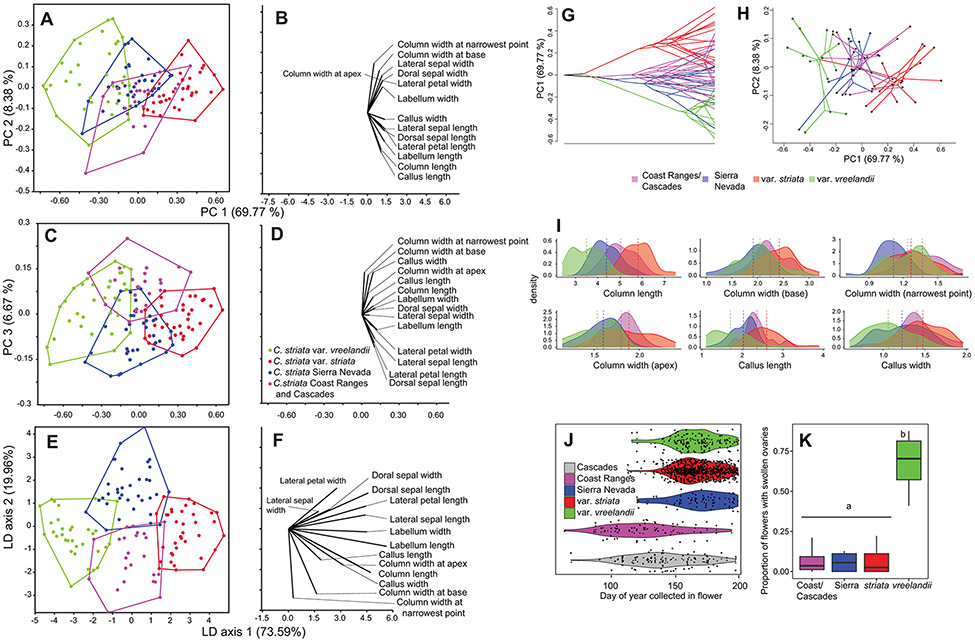
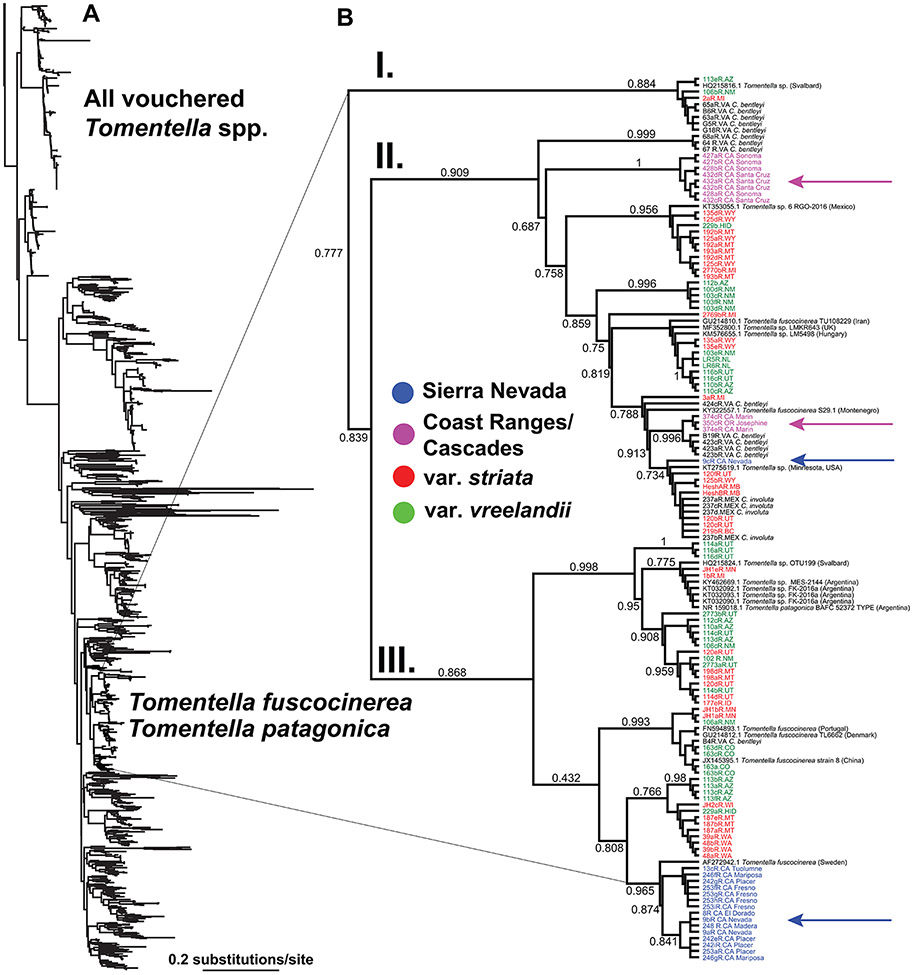
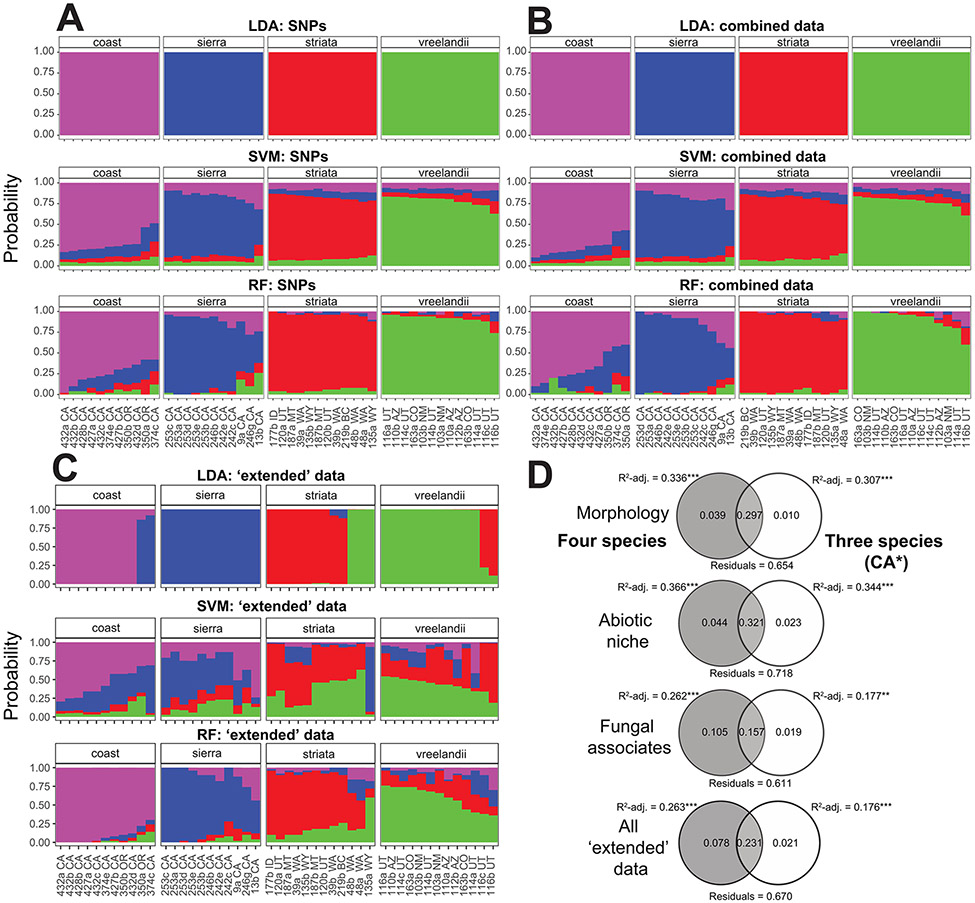
Lineage-based species definitions applying coalescent approaches to species delimitation have become increasingly popular. Yet, the application of these methods and the recognition of lineage-only definitions have recently been questioned. Species delimitation criteria that explicitly consider both lineages and evidence for ecological role shifts provide an opportunity to incorporate ecologically meaningful data from multiple sources in studies of species boundaries. Here, such criteria were applied to a problematic group of mycoheterotrophic orchids, the Corallorhiza striata complex, analysing genomic, morphological, phenological, reproductive-mode, niche, and fungal host data. A recently developed method for generating genomic polymorphism data-ISSRseq-demonstrates evidence for four distinct lineages, including a previously unidentified lineage in the Coast Ranges and Cascades of California and Oregon, USA. There is divergence in morphology, phenology, reproductive mode, and fungal associates among the four lineages. Integrative analyses, conducted in population assignment and redundancy analysis frameworks, provide evidence of distinct genomic lineages and a similar pattern of divergence in the extended data, albeit with weaker signal. However, none of the extended data sets fully satisfy the condition of a significant role shift, which requires evidence of fixed differences. The four lineages identified in the current study are recognized at the level of variety, short of comprising different species. This study represents the most comprehensive application of lineage + role to date and illustrates the advantages of such an approach.
Keywords: ISSRseq; Orchidaceae; SNP data; integrative species delimitation; species boundaries; species concept.
© 2022 John Wiley & Sons Ltd.
Figures
Similar articles
-
An integrative approach to delimiting species in a rare but widespread mycoheterotrophic orchid.Mol Ecol. 2011 Jul;20(13):2771-86. doi: 10.1111/j.1365-294X.2011.05124.x. Epub 2011 May 13. Mol Ecol. 2011. PMID: 21569137
-
Molecular evolution of rbcL in the mycoheterotrophic coralroot orchids (Corallorhiza Gagnebin, Orchidaceae).Mol Phylogenet Evol. 2008 May;47(2):665-79. doi: 10.1016/j.ympev.2008.02.014. Epub 2008 Mar 4. Mol Phylogenet Evol. 2008. PMID: 18374606
-
Using integrative taxonomy and multispecies coalescent models for phylogeny reconstruction and species delimitation within the "Nastanthus-Gamocarpha" clade (Calyceraceae).Mol Phylogenet Evol. 2019 Jan;130:211-226. doi: 10.1016/j.ympev.2018.10.015. Epub 2018 Oct 16. Mol Phylogenet Evol. 2019. PMID: 30336217
-
The plastid genome of the mycoheterotrophic Corallorhiza striata (Orchidaceae) is in the relatively early stages of degradation.Am J Bot. 2012 Sep;99(9):1513-23. doi: 10.3732/ajb.1200256. Epub 2012 Aug 30. Am J Bot. 2012. PMID: 22935364
-
Taxonomic turmoil down-under: recent developments in Australian orchid systematics.Ann Bot. 2009 Aug;104(3):447-55. doi: 10.1093/aob/mcp090. Epub 2009 Apr 26. Ann Bot. 2009. PMID: 19398445 Free PMC article. Review.
Cited by
-
Spiranthes hachijoensis (Orchidaceae), a new species within the S. sinensis species complex in Japan, based on morphological, phylogenetic, and ecological evidence.J Plant Res. 2023 May;136(3):333-348. doi: 10.1007/s10265-023-01448-6. Epub 2023 Mar 17. J Plant Res. 2023. PMID: 36930386 Free PMC article.
-
Morphological, ecological, and molecular phylogenetic approaches reveal species boundaries and evolutionary history of Goodyeracrassifolia (Orchidaceae, Orchidoideae) and its closely related taxa.PhytoKeys. 2022 Nov 4;212:111-134. doi: 10.3897/phytokeys.212.91536. eCollection 2022. PhytoKeys. 2022. PMID: 36761312 Free PMC article.
-
Monotropastrum kirishimense (Ericaceae), a new mycoheterotrophic plant from Japan based on multifaceted evidence.J Plant Res. 2023 Jan;136(1):3-18. doi: 10.1007/s10265-022-01422-8. Epub 2022 Nov 29. J Plant Res. 2023. PMID: 36445504 Free PMC article.
-
Subterranean morphology underpins the degree of mycoheterotrophy, mycorrhizal associations, and plant vigor in a green orchid Oreorchis patens.Plant J. 2025 Feb;121(4):e70045. doi: 10.1111/tpj.70045. Plant J. 2025. PMID: 39969432 Free PMC article.
-
Refining taxonomic identification of microalgae through molecular and genetic evolution: a case study of Prorocentrum lima and Prorocentrum arenarium.Microbiol Spectr. 2024 May 2;12(5):e0236723. doi: 10.1128/spectrum.02367-23. Epub 2024 Apr 4. Microbiol Spectr. 2024. PMID: 38572997 Free PMC article.
References
-
- Abouheif E (1999). A method for testing the assumption of phylogenetic independence in comparative data. Evolutionary Ecology Research, 1, 895–909.
-
- Ackerfield JR, Keil DJ, Hodgson WC, Simmons Mark. P., Fehlberg SD, & Funk VA (2020). Thistle be a mess: Untangling the taxonomy of Cirsium (Cardueae: Compositae) in North America. Journal of Systematics and Evolution, 58(6), 881–912. 10.1111/jse.12692 - DOI
-
- Ackerman JD (1983). Specificity and mutual dependency of the orchid-euglossine bee interaction. Biological Journal of the Linnean Society, 20(3), 301–314. 10.1111/j.1095-8312.1983.tb01878.x - DOI
-
- Aiello-Lammens ME, Boria RA, Radosavljevic A, Vilela B, & Anderson RP (2015). spThin: An R package for spatial thinning of species occurrence records for use in ecological niche models. Ecography, 38(5), 541–545. 10.1111/ecog.01132 - DOI
Publication types
MeSH terms
Associated data
- Actions
Grants and funding
LinkOut - more resources
Full Text Sources
