

Prediction of potential severe coronavirus disease 2019 patients based on CT radiomics: A retrospective study
- PMID: 35837868
- PMCID: PMC9349830
- DOI: 10.1002/mp.15841
Prediction of potential severe coronavirus disease 2019 patients based on CT radiomics: A retrospective study
Abstract
Purpose: Coronavirus disease 2019 (COVID-19) is a recently declared worldwide pandemic. Triaging of patients into severe and non-severe could further help in targeted management. "Potential severe patients" is a category of patients who did not have severe symptoms at their initial diagnosis, but eventually progressed to be severe patients and are easily overlooked in the early stage. This work aimed to develop and evaluate a CT-based radiomics signature for the prediction of these potential severe COVID-19 patients.
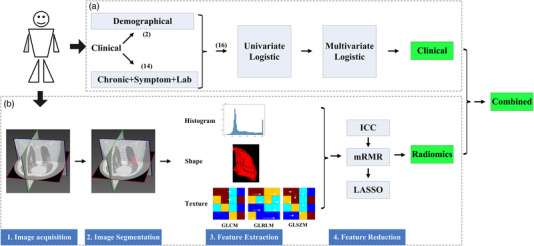
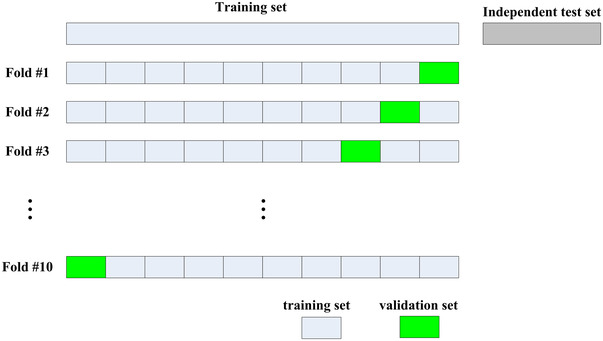
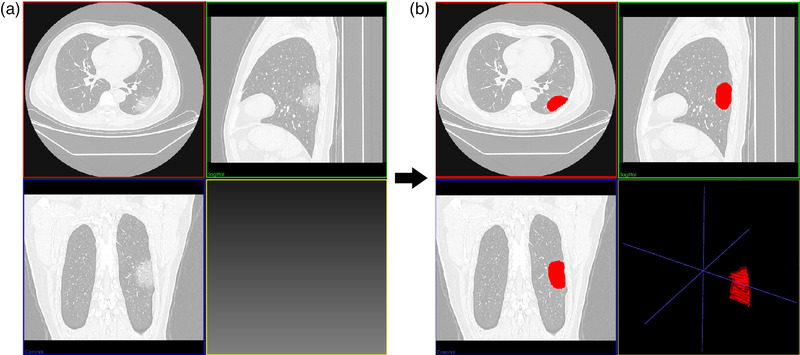
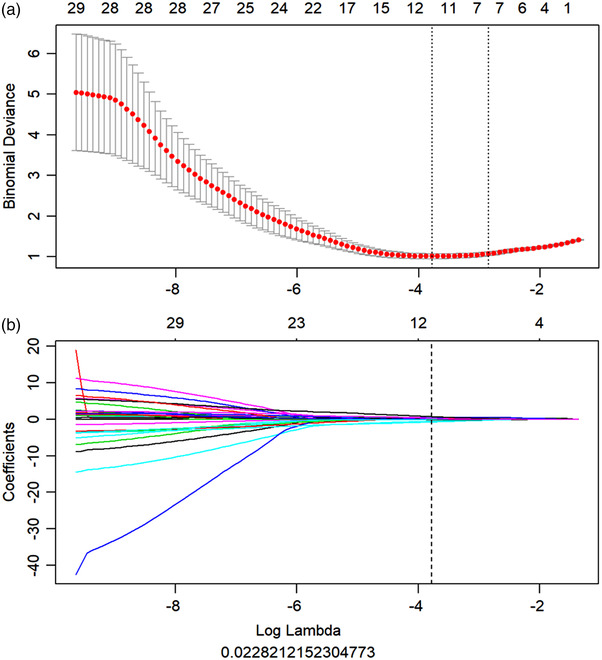
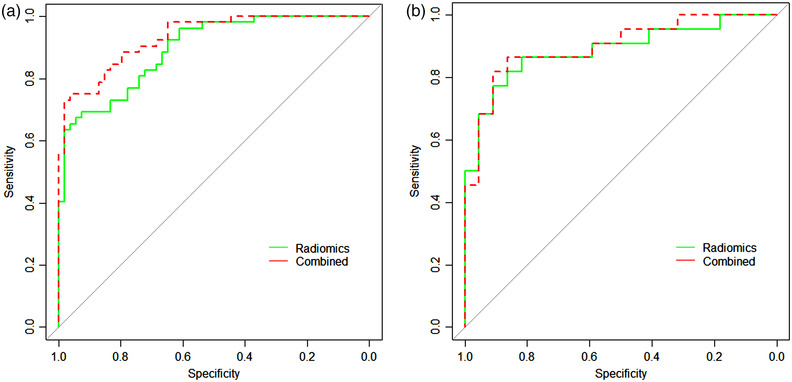
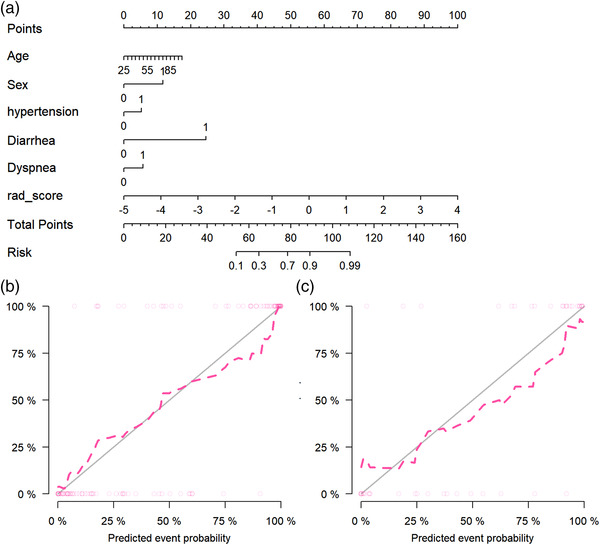
Methods: One hundred fifty COVID-19 patients were enrolled and randomly divided into cross-validation and independent test sets. First, their clinical characteristics were screened using the univariate and multivariate logistic regression step by step. Then, radiomics features were extracted from the lesions on their chest CT images. Subsequently, the inter- and intra-class correlation coefficients (ICC) analysis, minimum-redundancy maximum-relevance (mRMR) selection, and the least absolute shrinkage and selection operator (LASSO) algorithm were used step by step for feature selection and construction of a radiomics signature. Finally, the screened clinical risk factors and constructed radiomics signature were combined for the combined model and Radiomics+Clinics nomogram construction. The predictive performance of the Radiomics and Combined models were evaluated and compared using receiver operating characteristic curve (ROC) analysis, Hosmer-Lemeshow test and Delong test.
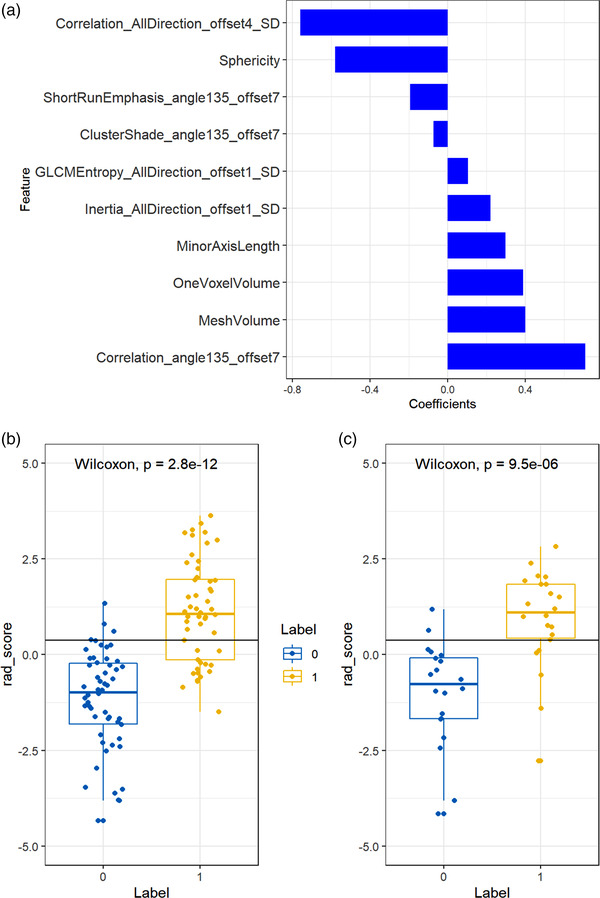
Results: Clinical characteristics analysis resulted in the screening of five clinical risk factors. The combination of ICC, mRMR, and LASSO methods resulted in the selection of ten radiomics features, which made up of the radiomics signature. The differences in the radiomics signature between the potential severe and non-severe groups in cross-validation set and test sets were both p < 0.001. All Radiomics and Combined models showed a very good predictive performance with the accuracy and AUC of nearly or above 0.9. Additionally, we found no significant difference in the predictive performance between these two models.
Conclusions: A CT-based radiomics signature for the prediction of potential severe COVID-19 patients was constructed and evaluated. Constructed Radiomics and Combined model showed good feasibility and accuracy. The Radiomics+Clinical nomogram, acted as a useful tool, may assist clinicians to better identify potential severe cases to target their management in the COVID-19 pandemic prevention and control.
Keywords: COVID-19; CT radiomics; potential severe patient; prediction.
© 2022 American Association of Physicists in Medicine.
Conflict of interest statement
The authors declare that there is no conflict of interest that could be perceived as prejudicing the impartiality of the research reported.
Figures
Similar articles
-
Development and validation of a radiomics-based nomogram for the preoperative prediction of microsatellite instability in colorectal cancer.BMC Cancer. 2022 May 9;22(1):524. doi: 10.1186/s12885-022-09584-3. BMC Cancer. 2022. PMID: 35534797 Free PMC article.
-
Development and multicenter validation of a CT-based radiomics signature for predicting severe COVID-19 pneumonia.Eur Radiol. 2021 Oct;31(10):7901-7912. doi: 10.1007/s00330-021-07727-x. Epub 2021 Mar 30. Eur Radiol. 2021. PMID: 33786655 Free PMC article.
-
A novel CT-based radiomics in the distinction of severity of coronavirus disease 2019 (COVID-19) pneumonia.BMC Infect Dis. 2021 Jun 25;21(1):608. doi: 10.1186/s12879-021-06331-0. BMC Infect Dis. 2021. PMID: 34171991 Free PMC article.
-
Radiomics nomogram for the prediction of 2019 novel coronavirus pneumonia caused by SARS-CoV-2.Eur Radiol. 2020 Dec;30(12):6888-6901. doi: 10.1007/s00330-020-07032-z. Epub 2020 Jul 3. Eur Radiol. 2020. PMID: 32621237 Free PMC article.
-
Predicting N2 lymph node metastasis in presurgical stage I-II non-small cell lung cancer using multiview radiomics and deep learning method.Med Phys. 2023 Apr;50(4):2049-2060. doi: 10.1002/mp.16177. Epub 2023 Jan 6. Med Phys. 2023. PMID: 36563341 Clinical Trial.
Cited by
-
The severity assessment and nucleic acid turning-negative-time prediction in COVID-19 patients with COPD using a fused deep learning model.BMC Pulm Med. 2024 Oct 14;24(1):515. doi: 10.1186/s12890-024-03333-x. BMC Pulm Med. 2024. PMID: 39402509 Free PMC article.
-
Exploring radiomic features of lateral cerebral ventricles in postmortem CT for postmortem interval estimation.Int J Legal Med. 2025 Mar;139(2):667-677. doi: 10.1007/s00414-024-03396-9. Epub 2024 Dec 20. Int J Legal Med. 2025. PMID: 39702800
References
-
- Weekly epidemiological update on COVID‐19—16 March 2021. World Health Organization. Accessed 25 May 2021. https://www.who.int/publications/m/item/weekly‐epidemiological‐update‐on.... Published May 25, 2021.
-
- WHO Global . Clinical management of COVID‐19interim guidance. WHO REFERENCE NUMBER: WHO/2019‐nCoV/clinical/2020.5May27, 2020.
Publication types
MeSH terms
Grants and funding
- 2017YFC0108803/National Key Research and Development Plan of China
- 2020020601012238/Applied Basic Frontier Research Foundation of Wuhan Science and Technology Bureau
- 2020FCA016/New Type Pneumonia Emergency Science and Technology Project of Hubei Province
- 2042020kfxg11/Fundamental Research Funds for the Central Universities
LinkOut - more resources
Full Text Sources
Medical
