. 2022 Jul 15;132(14):e157410.
doi: 10.1172/JCI157410.

Creatine riboside is a cancer cell-derived metabolite associated with arginine auxotrophy

Affiliations

Creatine riboside is a cancer cell-derived metabolite associated with arginine auxotrophy

Amelia L Parker et al. J Clin Invest. .

Abstract

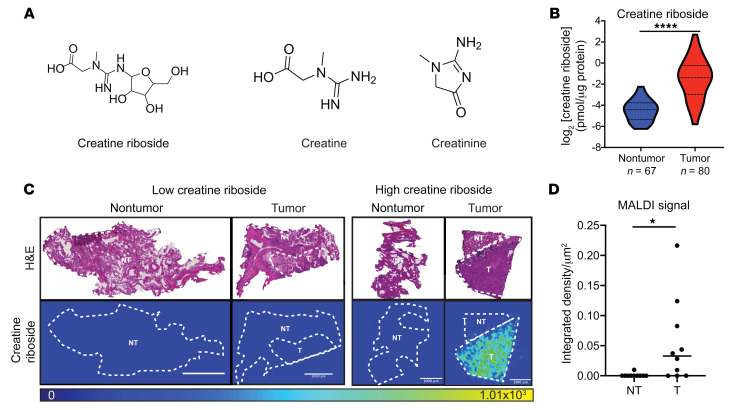
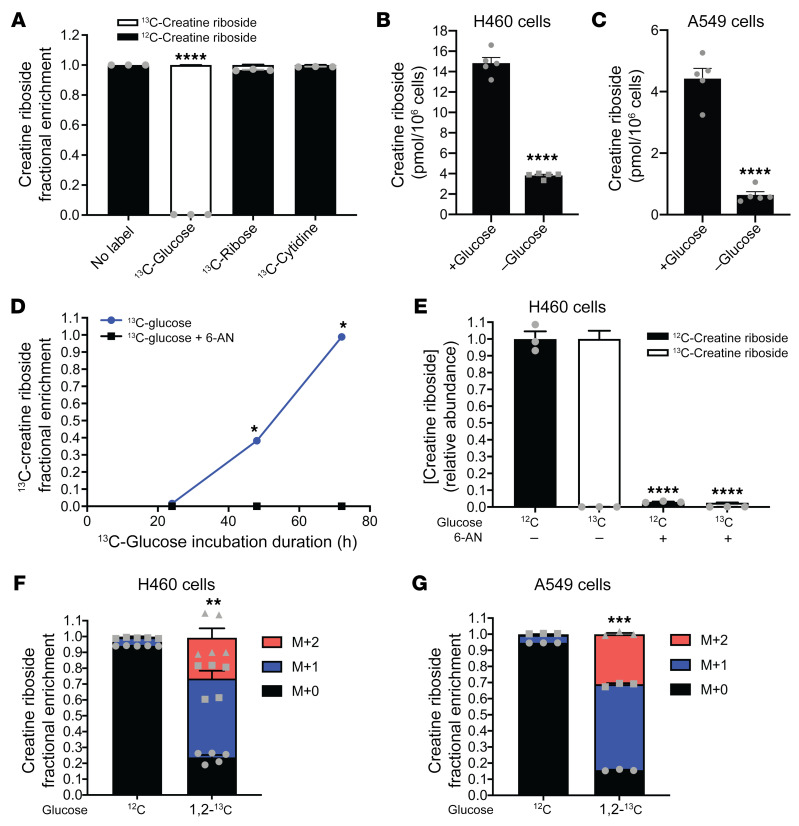
The metabolic dependencies of cancer cells have substantial potential to be exploited to improve the diagnosis and treatment of cancer. Creatine riboside (CR) is identified as a urinary metabolite associated with risk and prognosis in lung and liver cancer. However, the source of high CR levels in patients with cancer as well as their implications for the treatment of these aggressive cancers remain unclear. By integrating multiomics data on lung and liver cancer, we have shown that CR is a cancer cell-derived metabolite. Global metabolomics and gene expression analysis of human tumors and matched liquid biopsies, together with functional studies, revealed that dysregulation of the mitochondrial urea cycle and a nucleotide imbalance were associated with high CR levels and indicators of a poor prognosis. This metabolic phenotype was associated with reduced immune infiltration and supported rapid cancer cell proliferation that drove aggressive tumor growth. CRhi cancer cells were auxotrophic for arginine, revealing a metabolic vulnerability that may be exploited therapeutically. This highlights the potential of CR not only as a poor-prognosis biomarker but also as a companion biomarker to inform the administration of arginine-targeted therapies in precision medicine strategies to improve survival for patients with cancer.

Keywords: Cancer; Lung cancer; Oncology.


Conflict of interest statement

Conflict of interest: The authors have declared that no conflict of interest exists.

Figures

Figure 1
Figure 1. CR is enriched in tumors.
(A) The chemical structure of CR, creatine, and creatinine. (B) The CR concentration was significantly elevated in tumor (n = 80) compared with nontumor (n = 67) lung tissue. ****P < 0.0001, by Mann-Whitney U test. (C) Representative images of CR distribution in human NSCLC tumor (T) and matched adjacent nontumor (NT) tissue measured by MALDI imaging MS. CRlo and a CRhi tumors are shown with H&E staining after imaging in the top panel, and MALDI imaging MS signal of CR distribution within the tissue sections is shown in the lower panel. The MALDI imaging MS signal is pseudocolored to indicate CR abundance (range, 0 to 1.01 × 10³). Scale bars: 1000 μm. (D) CR enrichment in tumoral compared with nontumoral regions of the lung tissue as measured by the integrated CR signal intensity with MALDI imaging MS. n = 10 matched tumor and nontumor samples. *P < 0.05., by Mann-Whitney U test.
Figure 2
Figure 2. CR is enriched in cancer cells.
(A) CR was detectable by LC-MS/MS at higher concentrations in cancer cells compared with primary normal and immortalized cells. NHBE, normal human bronchial epithelial cells (green); immortalized NHBE, immortalized normal human bronchial epithelial cells (white); NSCLC cells (gray); HCC cells (blue). Data indicate the mean ± SD of 3–4 independent experiments. (B and C) Intracellular CR concentrations in H460 (B) and A549 (C) cell lines grown over time from the time of plating (t = 0 h), as measured by LC-MS/MS. Data indicate the mean ± SD of 3 independent experiments. *P < 0.05 compared with the 12-hour time point for that cell line, by Kruskal-Wallis test.
Figure 3
Figure 3. Creatinine is a metabolic precursor of CR.
Correlation of CR with creatine (A) and creatinine (B) within NSCLC tumor tissues (Spearman’s correlation; n = 147 tissue samples). (C and D) Fractional enrichment of CR labeling from 13C-creatine or 13C-creatinine in H460 (C) and A549 (D) cells. Data indicate the mean ± SEM of 3 independent experiments. ****P < 0.0001, by 1-way ANOVA with Holm-Šidák correction for multiple comparisons. (E and F) Fractional enrichment of CR labeling from 13C-creatinine or 13C-arginine in H460 cells (E) and A549 cells (F). Data indicate the mean ± SEM of 3 independent experiments. ****P < 0.0001, by 1-way ANOVA with Holm-Šidák correction for multiple comparisons. The 13C-creatinine treatment group is replicated from C and D. (G and H) CR levels increased with increasing creatinine supplementation as measured by the fractional enrichment of CR labeling from 13C-creatinine in H460 (G) and A549 (H) cells. Dotted line indicates endogenous serum levels of creatinine (75 μM) in humans. Data indicate the mean ± SEM of 3 independent experiments. (I) Intracellular CR concentrations in CRlo (blue) and CRhi (red) cell lines with increasing concentrations of exogenously supplied creatinine. Data indicate the mean ± SEM of 3 independent experiments (J) Intracellular creatinine concentrations in CRlo (blue) and CRhi (red) cell lines with increasing concentrations of exogenously supplied creatinine. Data indicate the mean ± SEM of 3 independent experiments. (K) Time course of the fractional enrichment of CR labeling from 13C-creatinine over 72 hours in H460 cells. Data indicate the mean ± SEM of 3 independent experiments.
Figure 4
Figure 4. PPP products are the metabolic precursors of CR.
(A) Fractional enrichment of CR labeling from 13C-glucose, 13C-ribose, or 13C-cytidine in H460 cells. Data indicate the mean ± SEM of 3 independent experiments. ****P < 0.0001, by 1-way ANOVA with Dunnett’s multiple-comparison correction. (B and C) CR levels in H460 (B) and A549 (C) cells grown under normal culture (+Glucose) conditions or under glucose starvation (–Glucose). Data indicate the mean ± SEM of 5 independent experiments. ****P < 0.0001, by Mann-Whitney U test. (D) Fractional enrichment of CR labeling from 13C-glucose over time in H460 cells treated with (black line) or without (blue line) the PGDH inhibitor 6-AN. Data indicate the mean ± SEM of 3 independent experiments. *P < 0.05, by 2-way ANOVA with Holm-Šidák multiple-comparison correction. (E) Relative abundance of unlabeled and labeled CR in the presence and absence of 12C-glucose (12C) or 13C-glucose (13C) and 6-AN in H460 cells. Data indicate the mean ± SEM of 3 independent experiments. ****P < 0.0001, by 1-way ANOVA with Dunnett’s multiple-comparison correction. (F and G) Fractional enrichment of CR labeling from unlabeled glucose (12C) or 1,2 -13C2-glucose in H460 (F) and A549 (G) cells. Data indicate the mean ± SEM of 3 independent experiments. ***P < 0.001, by Mann-Whitney U test comparison of M + 0 levels.
Figure 5
Figure 5. CR is associated with activation of the PPP and urea cycle dysfunction.
(A and B) GSEA of non–small cell lung tumor transcriptional data identified metabolic pathways that were downregulated in CRhi tumors (A) and enriched in CRhi tumors (B) compared with CRlo tumors. Black bars: –log10(P values were adjusted for multiple comparisons); red dots: normalized enrichment score (NES). (CH) Pathway GSVA of pentose phosphate (C and D), arginine (E and F), and mitochondrial urea cycle (G and H) metabolic pathways in CRhi tumors (lung, n = 44; liver, n = 58) compared with CRlo tumors (lung, n = 43; liver, n = 33) from lung (C, E, and G) and liver (D, F, and H) cancer. *P < 0.05 and ****P < 0.0001, by Mann-Whitney U test. (IN) CRhi tumors had dysregulated expression of mitochondrial urea cycle enzymes. Downregulation of CPS1 expression as well as that of its cofactor NAGS was seen in NSCLC (I and J) and intrahepatic cholangiocarcinoma (K and L), while HCC had significant upregulation of CPS1 relative to OTC (M and N). *P < 0.05, by Mann-Whitney U test.
Figure 6
Figure 6. CR is associated with arginine auxotrophy.
(A) Growth of CRhi (red) and CRlo (blue) NSCLC cell lines in response to arginine deprivation alone (–) or upon supplementation with ornithine (Orn., 1 mM), citrulline (Cit., 1 mM), or sodium nitrite (NaNO2). Growth was measured with the MTS assay and is expressed relative to growth in normal culture conditions. Data indicate the mean ± SEM of 4 independent experiments. *P < 0.05, comparing the means of CRlo and CRhi, by 2-way ANOVA with Holm-Šidák multiple-comparison correction. (B and C) Intracellular concentrations of the urea cycle metabolites ornithine (B) and citrulline (C) in CRhi (red) and CRlo (blue) NSCLC cell lines compared with immortalized bronchial epithelial cells (HBET1, black). Data indicate the mean ± SEM of 3 independent experiments. *P < 0.05, by 1-way ANOVA with Dunnett’s multiple-comparison correction. (D and E) Arginine deprivation reduced the production of CR in H460 (D) and A549 (E) NSCLC cell lines. LLOQ, lower limit of quantitation for CR (i.e., lower than the quantifiable limit for the LC-MS/MS assay). Data indicate the mean ± SEM of 2–3 independent experiments. (F and G) Inhibition of ASS1 with methyl DL-aspartate significantly reduced CR production in H460 (F) and A549 (G) NSCLC cell lines. Data indicate the mean ± SEM of 6 independent experiments. *P < 0.05 and ***P < 0.001, by 1-way ANOVA with Dunnett’s multiple-comparison correction.
Figure 7
Figure 7. Urea cycle dysregulation in CRhi tumors is associated with a nucleotide pool imbalance.
(A) Ingenuity Pathway Analysis of metabolic pathways that correlate with metabolite levels in CRhi NSCLC tumors compared with CRlo NSCLC tumors. (BD) CRhi tumors had a purine/pyrimidine nucleotide balance that was biased toward purines in NSCLC (B, low, n = 9; high, n = 8) and intrahepatic cholangiocarcinoma (C, low, n = 49; high, n = 75) and toward pyrimidines in HCC (D, low, n = 42; high, n = 17). *P < 0.05, by Mann-Whitney U test.
Figure 8
Figure 8. Urea cycle dysregulation drives a nucleotide pool imbalance and high rates of oxidative phosphorylation that promote CR production.
(A) Suppression of CPS1 expression increased CR levels in normal growth conditions but not when the pyrimidine pools were supplemented. NS, nonsilencing; CPS1 KD, CPS1 knockdown; U, uridine supplementation; T, thymidine supplementation. Data indicate the mean ± SEM of 6 independent experiments. *P < 0.05, by 1-way ANOVA with Dunnett’s multiple-comparison correction. (B and C) Fractional enrichment of unlabeled malate (B) and aspartate (C) from U-13C-glucose in CRhi and CRlo NSCLC cell lines. Data indicate the mean ± SEM of 3 independent experiments. *P < 0.05, by Mann-Whitney U test. (D) Oxygen consumption rate in CRhi (red) and CRlo (blue) NSCLC cell lines. Data indicate the mean ± SEM of 5–8 independent experiments. *P < 0.05 and **P < 0.01, by Mann-Whitney U test. (E and F) CR levels in normal growth conditions (+Glutamine) and in glutamine deprived culture conditions (–Glutamine) in H460 (E) and A549 (F) cells. Values from normal growth conditions are the same as those presented in Figure 4, B and C. Data indicate the mean ± SEM of 4–5 independent experiments. ****P < 0.0001, by Mann-Whitney U test.
Figure 9
Figure 9. CR is associated with cell proliferation.
(A) GSEA of NSCLC RNA-Seq data identified that CRhi tumors were significantly enriched in the expression of cell-cycle genes compared with CRlo tumors. P values were determined by Kolmogorov-Smirnov statistic with sample randomization. (B and C) CRhi NSCLC (B) and HCC (C) tumors had high PCNA expression. *P < 0.05, by Mann-Whitney U test. (D) Doubling time of NSCLC cell lines as measured by trypan blue dye exclusion and cell counts. Data indicate the mean ± SEM of 2 independent experiments. *P < 0.05, by Mann-Whitney U test. (E and F) Intracellular CR levels in H460 (E) and A549 (F) cell lines following cell-cycle arrest induced by 2 mM thymidine. Data indicate the mean ± SEM of 3 independent experiments. **P < 0.01, by Mann-Whitney U test. LLOQ, lower limit of quantitation, indicating that the CR concentration was lower than the quantifiable limit for the LC-MS/MS assay.
Figure 10
Figure 10. CRhi tumors are highly proliferative.
(A) Ki67 immunostaining of tumors (DAPI is shown in blue and Ki67 in gray) indicates that CRhi tumors were enriched in Ki67+ cells. Scale bars: 1000 μm (MALDI mass spectrometry imaging of creatine riboside) and 500 μm (Ki67 staining). Images are representative of 10 matched tumor and nontumor tissues. (B) High-magnification images from A. Scale bar: 100 μm. (C) Scatter plot shows a correlation (Spearman’s) of the proportion of Ki67+ cells relative to the CR signal determined by MALDI imaging MS. (D) Schematic representation of the consequences of metabolic rewiring associated with CRhi tumors.

Similar articles

Cited by

References

    1. Ward PS, Thompson CB. Metabolic reprogramming: a cancer hallmark even warburg did not anticipate. Cancer Cell. 2012;21(3):297–308. doi: 10.1016/j.ccr.2012.02.014. - DOI - PMC - PubMed
    1. Hanahan D, Weinberg RA. Hallmarks of cancer: the next generation. Cell. 2011;144(5):646–674. doi: 10.1016/j.cell.2011.02.013. - DOI - PubMed
    1. Vander Heiden MG, DeBerardinis RJ. Understanding the intersections between metabolism and cancer biology. Cell. 2017;168(4):657–669. doi: 10.1016/j.cell.2016.12.039. - DOI - PMC - PubMed
    1. Fendt SM, et al. Targeting metabolic plasticity and flexibility dynamics for cancer therapy. Cancer Discov. 2020;10(12):1797–1807. doi: 10.1158/2159-8290.CD-20-0844. - DOI - PMC - PubMed
    1. Keshet R, et al. Rewiring urea cycle metabolism in cancer to support anabolism. Nat Rev Cancer. 2018;18(10):634–645. doi: 10.1038/s41568-018-0054-z. - DOI - PubMed

Substances