. 2022 Jul 26;22(15):2869-2877.
doi: 10.1039/d2lc00384h.

Hanging drop sample preparation improves sensitivity of spatial proteomics

Affiliations

Hanging drop sample preparation improves sensitivity of spatial proteomics

Yumi Kwon et al. Lab Chip. .

Abstract

Spatial proteomics holds great promise for revealing tissue heterogeneity in both physiological and pathological conditions. However, one significant limitation of most spatial proteomics workflows is the requirement of large sample amounts that blurs cell-type-specific or microstructure-specific information. In this study, we developed an improved sample preparation approach for spatial proteomics and integrated it with our previously-established laser capture microdissection (LCM) and microfluidics sample processing platform. Specifically, we developed a hanging drop (HD) method to improve the sample recovery by positioning a nanowell chip upside-down during protein extraction and tryptic digestion steps. Compared with the commonly-used sitting-drop method, the HD method keeps the tissue pixel away from the container surface, and thus improves the accessibility of the extraction/digestion buffer to the tissue sample. The HD method can increase the MS signal by 7 fold, leading to a 66% increase in the number of identified proteins. An average of 721, 1489, and 2521 proteins can be quantitatively profiled from laser-dissected 10 μm-thick mouse liver tissue pixels with areas of 0.0025, 0.01, and 0.04 mm2, respectively. The improved system was further validated in the study of cell-type-specific proteomes of mouse uterine tissues.


Conflict of interest statement

There are no conflicts to declare.

Figures

Fig. 1
Fig. 1. LCM-nanoPOTS-based spatial proteomics with sitting drop (SD) and hanging drop (HD) approaches. (A) Illustration of the DMSO-mediated tissue pixel capture and nanoPOTS protocol for proteomic sample preparation. (B) Schematic diagram of side views showing the location of tissue pixels during the incubation steps based on SD and HD approaches. (C) Representative microscopic images of LCM-dissected tissue pixels before and after protein extraction step. The LCM tissues processed with HD approach exhibit less tissue staining color than that with SD approach, indicating improved protein extraction efficiency.
Fig. 2
Fig. 2. (A–C) Comparison of proteome coverages of hanging droplet and sitting droplet approaches. Numbers of (A) unique peptides and (B) protein groups identified from 0.2 mm × 0.2 mm fresh-frozen mouse liver tissues with a thickness of 10 μm. The error bars indicate standard deviations. (C) Venn diagram showing the overlap of total protein identifications. (D–F) The sensitivity of hanging drop-based spatial proteomics method. Numbers of (D) unique peptides and (E) protein groups identified from 0.05 mm × 0.05 mm, 0.1 mm × 0.1 mm, and 0.2 mm × 0.2 mm mouse liver tissue pixels with a thickness of 10 μm, respectively. (F) Venn diagram of total protein identifications from the three sizes.
Fig. 3
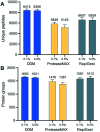
Fig. 3. Evaluation of three MS-compatible surfactants for spatial proteomics. (A) Unique peptides and (B) protein groups identified from n-dodecyl β-d-maltoside (DDM), ProteaseMAX, and RapiGest SF.
Fig. 4
Fig. 4. Spatial proteomics analysis of luminal epithelial cells (Epi) and stromal cells (Stro) from mouse uterine tissue sections. (A) An image of hematoxylin-stained tissue section. Total six tissue regions with a lateral dimension of 100 μm × 100 μm and a thickness of 12 μm were dissected and analyzed. (B) The protein identifications, (C) pairwise correlation plots with log 2-transformed LFQ intensities, and (D) PCA projection of the six samples.
Fig. 5
Fig. 5. Differentially expressed proteins from the epithelial and stromal dominant regions. (A) Volcano plots of proteins differentially expressed between the two tissue regions. (B) Gene ontology categories obtained from differentially expressed proteins.

Similar articles

Cited by

References

    1. Close J. L. Long B. R. Zeng H. Nat. Methods. 2021;18:23–25. doi: 10.1038/s41592-020-01040-z. - DOI - PubMed
    1. Larsson L. Frisen J. Lundeberg J. Nat. Methods. 2021;18:15–18. doi: 10.1038/s41592-020-01038-7. - DOI - PubMed
    1. Hu B. C. Nature. 2019;574:187–192. doi: 10.1038/s41586-019-1629-x. - DOI - PMC - PubMed
    1. Giesen C. Wang H. A. Schapiro D. Zivanovic N. Jacobs A. Hattendorf B. Schuffler P. J. Grolimund D. Buhmann J. M. Brandt S. Varga Z. Wild P. J. Gunther D. Bodenmiller B. Nat. Methods. 2014;11:417–422. doi: 10.1038/nmeth.2869. - DOI - PubMed
    1. Angelo M. Bendall S. C. Finck R. Hale M. B. Hitzman C. Borowsky A. D. Levenson R. M. Lowe J. B. Liu S. D. Zhao S. Natkunam Y. Nolan G. P. Nat. Med. 2014;20:436–442. doi: 10.1038/nm.3488. - DOI - PMC - PubMed

Publication types