

The kinectome: A comprehensive kinematic map of human motion in health and disease
- PMID: 35838306
- PMCID: PMC9796708
- DOI: 10.1111/nyas.14860
The kinectome: A comprehensive kinematic map of human motion in health and disease
Abstract
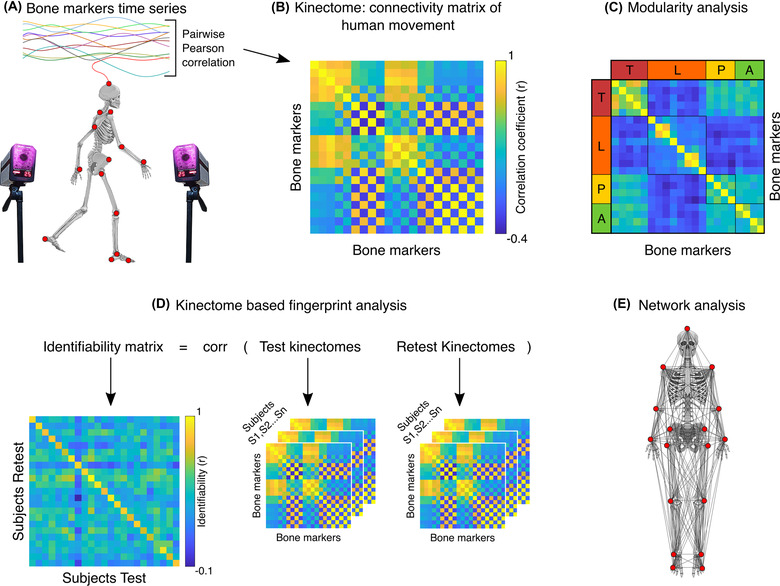
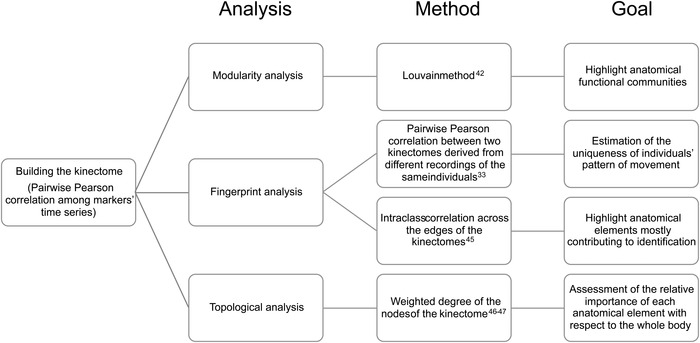
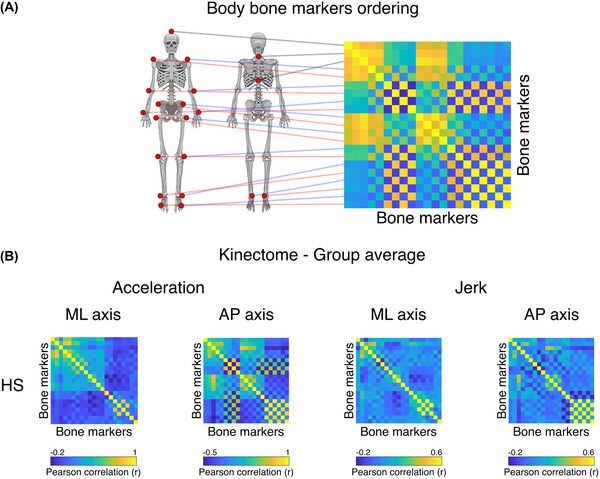
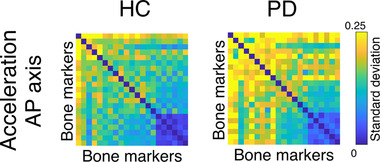
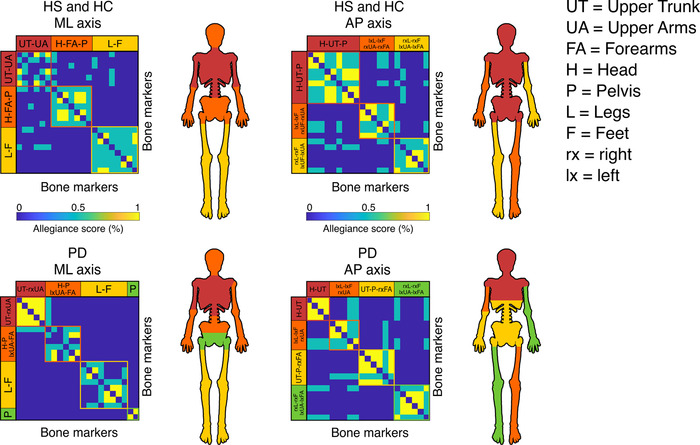
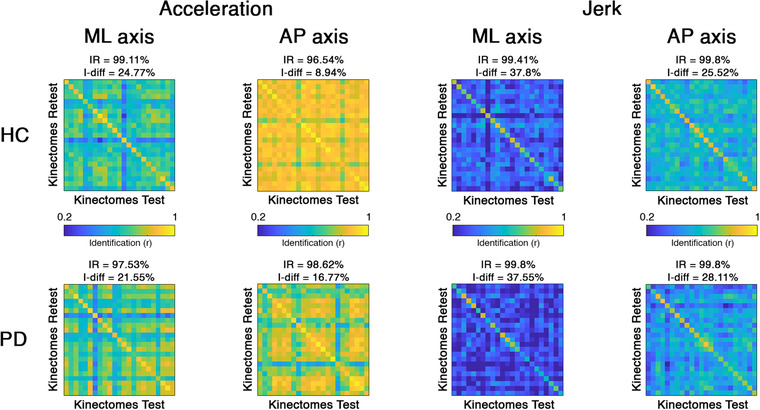
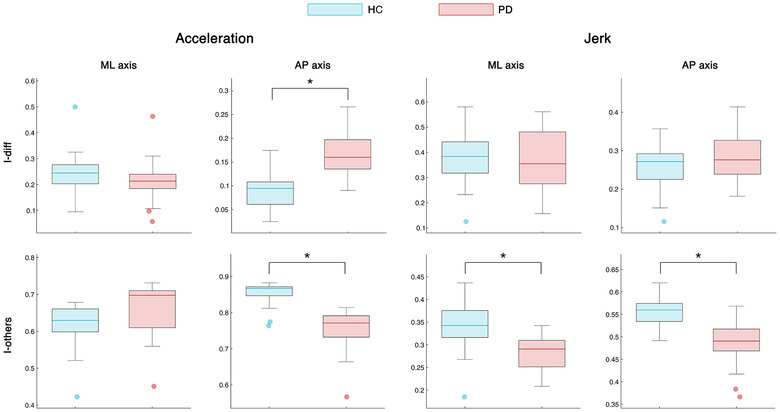
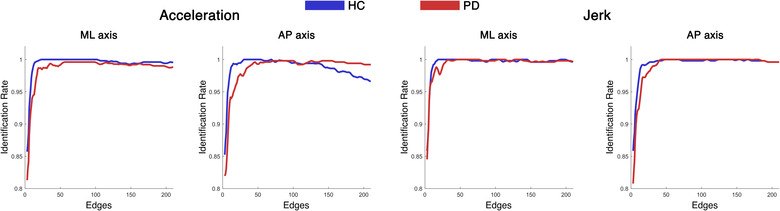
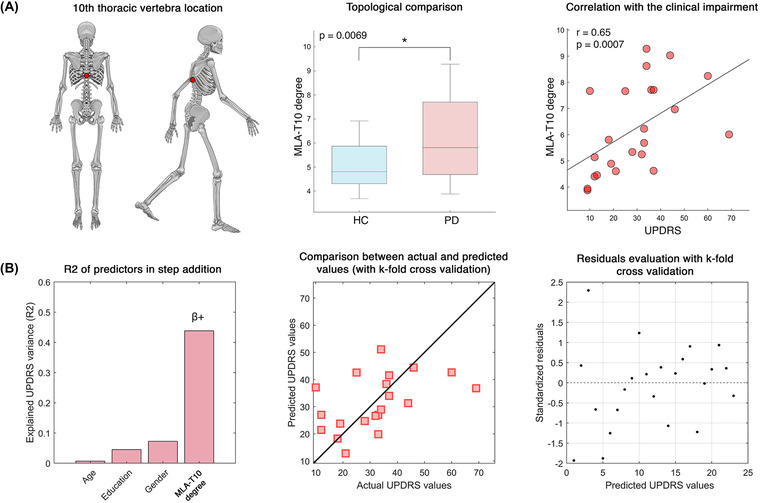
Human voluntary movement stems from the coordinated activations in space and time of many musculoskeletal segments. However, the current methodological approaches to study human movement are still limited to the evaluation of the synergies among a few body elements. Network science can be a useful approach to describe movement as a whole and to extract features that are relevant to understanding both its complex physiology and the pathophysiology of movement disorders. Here, we propose to represent human movement as a network (that we named the kinectome), where nodes represent body points, and edges are defined as the correlations of the accelerations between each pair of them. We applied this framework to healthy individuals and patients with Parkinson's disease, observing that the patients' kinectomes display less symmetrical patterns as compared to healthy controls. Furthermore, we used the kinectomes to successfully identify both healthy and diseased subjects using short gait recordings. Finally, we highlighted topological features that predict the individual clinical impairment in patients. Our results define a novel approach to study human movement. While deceptively simple, this approach is well-grounded, and represents a powerful tool that may be applied to a wide spectrum of frameworks.
Keywords: Parkinson's disease; gait analysis; movement pattern; network.
© 2022 The Authors. Annals of the New York Academy of Sciences published by Wiley Periodicals LLC on behalf of New York Academy of Sciences.
Conflict of interest statement
The authors declare no competing interests.
Figures
Similar articles
-
The effect of dopaminergic treatment on whole body kinematics explored through network theory.Sci Rep. 2024 Jan 22;14(1):1913. doi: 10.1038/s41598-023-50546-x. Sci Rep. 2024. PMID: 38253728 Free PMC article.
-
Examination of central gait control mechanisms in Parkinson's disease using movement-related potentials.Mov Disord. 2011 Nov;26(13):2347-53. doi: 10.1002/mds.23844. Epub 2011 Jul 7. Mov Disord. 2011. PMID: 21739471
-
[A rapid detection of motor block in patients with Parkinson disease during volitional movements of the hand].Srp Arh Celok Lek. 2002 Nov-Dec;130(11-12):376-81. doi: 10.2298/sarh0212376p. Srp Arh Celok Lek. 2002. PMID: 12751160 Serbian.
-
Effects of auditory cues on gait initiation and turning in patients with Parkinson's disease.Neurologia (Engl Ed). 2019 Jul-Aug;34(6):396-407. doi: 10.1016/j.nrl.2016.10.008. Epub 2016 Dec 9. Neurologia (Engl Ed). 2019. PMID: 27939113 Review. English, Spanish.
-
A multimodal Parkinson quantification by fusing eye and gait motion patterns, using covariance descriptors, from non-invasive computer vision.Comput Methods Programs Biomed. 2022 Mar;215:106607. doi: 10.1016/j.cmpb.2021.106607. Epub 2021 Dec 30. Comput Methods Programs Biomed. 2022. PMID: 34998167 Review.
Cited by
-
Kinematic network of joint motion provides insight on gait coordination: An observational study on Parkinson's disease.Heliyon. 2024 Aug 3;10(15):e35751. doi: 10.1016/j.heliyon.2024.e35751. eCollection 2024 Aug 15. Heliyon. 2024. PMID: 39170156 Free PMC article.
-
Discovering individual-specific gait signatures from data-driven models of neuromechanical dynamics.PLoS Comput Biol. 2023 Oct 27;19(10):e1011556. doi: 10.1371/journal.pcbi.1011556. eCollection 2023 Oct. PLoS Comput Biol. 2023. PMID: 37889927 Free PMC article.
-
Mapping the complexity of motor variability: From individual space of variability to motor fingerprints.Behav Res Methods. 2025 Apr 9;57(5):140. doi: 10.3758/s13428-025-02635-0. Behav Res Methods. 2025. PMID: 40205129 Free PMC article.
-
Video-based biomechanical analysis captures disease-specific movement signatures of different neuromuscular diseases.bioRxiv [Preprint]. 2025 Jul 29:2024.09.26.613967. doi: 10.1101/2024.09.26.613967. bioRxiv. 2025. PMID: 40766489 Free PMC article. Preprint.
-
Deep learning-based detection of affected body parts in Parkinson's disease and freezing of gait using time-series imaging.Sci Rep. 2024 Oct 10;14(1):23732. doi: 10.1038/s41598-024-75445-7. Sci Rep. 2024. PMID: 39390087 Free PMC article.
References
-
- Cech, D. J. (2011). Functional movement development across the life span. Elsevier Health Sciences.
-
- Jo, S. (2008). Hypothetical neural control of human bipedal walking with voluntary modulation. Medical & Biological Engineering & Computing, 46, 179–193. - PubMed
Publication types
MeSH terms
LinkOut - more resources
Full Text Sources
Medical
