. 2022 Jul 15:11:e77969.
doi: 10.7554/eLife.77969.

Immune dynamics in SARS-CoV-2 experienced immunosuppressed rheumatoid arthritis or multiple sclerosis patients vaccinated with mRNA-1273

Collaborators, Affiliations

Immune dynamics in SARS-CoV-2 experienced immunosuppressed rheumatoid arthritis or multiple sclerosis patients vaccinated with mRNA-1273

Niels J M Verstegen et al. Elife. .

Abstract

Background: Patients affected by different types of autoimmune diseases, including common conditions such as multiple sclerosis (MS) and rheumatoid arthritis (RA), are often treated with immunosuppressants to suppress disease activity. It is not fully understood how the severe acute respiratory syndrome coronavirus 2 (SARS-CoV-2)-specific humoral and cellular immunity induced by infection and/or upon vaccination is affected by immunosuppressants.

Methods: The dynamics of cellular immune reactivation upon vaccination of SARS-CoV-2 experienced MS patients treated with the humanized anti-CD20 monoclonal antibody ocrelizumab (OCR) and RA patients treated with methotrexate (MTX) monotherapy were analyzed at great depth via high-dimensional flow cytometry of whole blood samples upon vaccination with the SARS-CoV-2 mRNA-1273 (Moderna) vaccine. Longitudinal B and T cell immune responses were compared to SARS-CoV-2 experienced healthy controls (HCs) before and 7 days after the first and second vaccination.

Results: OCR-treated MS patients exhibit a preserved recall response of CD8+ T central memory cells following first vaccination compared to HCs and a similar CD4+ circulating T follicular helper 1 and T helper 1 dynamics, whereas humoral and B cell responses were strongly impaired resulting in absence of SARS-CoV-2-specific humoral immunity. MTX treatment significantly delayed antibody levels and B reactivation following the first vaccination, including sustained inhibition of overall reactivation marker dynamics of the responding CD4+ and CD8+ T cells.

Conclusions: Together, these findings indicate that SARS-CoV-2 experienced MS-OCR patients may still benefit from vaccination by inducing a broad CD8+ T cell response which has been associated with milder disease outcome. The delayed vaccine-induced IgG kinetics in RA-MTX patients indicate an increased risk after the first vaccination, which might require additional shielding or alternative strategies such as treatment interruptions in vulnerable patients.

Funding: This research project was supported by ZonMw (The Netherlands Organization for Health Research and Development, #10430072010007), the European Union's Horizon 2020 research and innovation program under the Marie Skłodowska-Curie grant agreement (#792532 and #860003), the European Commission (SUPPORT-E, #101015756) and by PPOC (#20_21 L2506), the NHMRC Leadership Investigator Grant (#1173871).

Keywords: COVID-19 mRNA vaccine; SARS-CoV-2; autoimmune disease; human; immunity; immunology; immunosuppressant; inflammation; medicine; multiple sclerosis; rheumatoid arthritis.


Conflict of interest statement

NV, RH, Jv, LK, CK, TA, LK, MS, MD, Rd, Nd, Cv, AB, EM, KK, Kv, ES, LB, GW, ST, Zv, LW, TK, FE, TR, Sv, At, Cv No competing interests declared, JK has speaking relationships with Merck, Biogen, TEVA, Sanofi, Genzyme, Roche and Novartis. AmsterdamUMC, location VUmc, MS Center Amsterdam has received financial support for research activities from Merck, Celgene, Biogen, GlaxoSmithKline, Immunic, Roche, Teva, Sanofi, Genzyme, and Novartis

Figures

Figure 1.
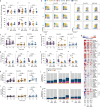
Figure 1.. Dynamics of circulating immune populations after severe acute respiratory syndrome coronavirus 2 (SARS-CoV-2) mRNA vaccination.
(a) Overview of cohort (b) distribution of time since primary infection within the different groups and (c) longitudinal study design. SARS-CoV-2 mRNA vaccination was administrated in two doses to SARS-CoV-2 experienced RA patients on methotrexate (RA-MTX) treatment, MS patients on ocrelizumab (MS-OCR) treatment, and healthy controls (HCs). Whole blood (red) or serum (yellow) was collected at indicated time points. (d–e) UMAP and cluster identification from FlowSOM analysis of two high-dimensional flow cytometry panels. The UMAP is separated across groups and major adaptive immune populations were subclustered in individual projections. (f) Schematic overview of circulating immune populations and their interactions. (g) Representation of cell count of immune populations that are affected by first (T1) and second (T3) vaccination as compared to baseline (T0) in the different groups. Each immune population is represented by a single column of colored squares, and each time point-disease group combination is represented by a single row. Color squares represent the populations that are reduced (blue), increased (red), or not affected (white). Statistical significance was determined using a Wilcoxon signed-rank test with Bonferroni-Holm multiple comparison correction.
Figure 1—figure supplement 1.
Figure 1—figure supplement 1.. Spectre analysis of circulating immune populations after severe acute respiratory syndrome coronavirus 2 (SARS-CoV-2) mRNA vaccination.
(a and c) UMAPs are colored based on the expression of surface markers included in the immune phenotype panel (a) or T cell activation panel that includes dynamic activation and exhaustion markers (c). (b and d) Heatmap representation of the surface marker expression of panel 1 (b) or panel 2 (d) within the major circulating immunocyte linages. (e) Representative flow cytometry plots showing the expression of HLA-DR, CD38, PD1, CTLA4, TIM3, TIGIT, CD137, and CD40L in CD8 T cells, circulating T follicular helper (Tfh) and T helper (Th) cells.
Figure 1—figure supplement 2.
Figure 1—figure supplement 2.. Circulating immune populations after severe acute respiratory syndrome coronavirus 2 (SARS-CoV-2) mRNA vaccination of SARS-CoV-2 experienced rheumatoid arthritis using methotrexate (RA-MTX), multiple sclerosis using ocrelizumab (MS-OCR), and healthy control (HC).
(a–d) Volcano plots represent fold-change (log2) on the x-axis and significance (p-value; log10) on the y-axis. Each dot represents a circulating immune population. Cell count per µl blood (a) and percentage (b) of circulating immune populations are analyzed after first (T1) and second (T3) vaccination as compared to baseline (T0) in the SARS-CoV-2 experienced HC, RA patients on MTX and MS patients on OCR. (c) Representation of percentage of immune populations that are affected by first (T1) and second (T3) vaccination as compared to baseline (T0). Each immune population is represented by a single column of colored squares, and each time point-disease group combination is represented by a single row. Color squares represent the populations that are significantly reduced (blue), increased (red), or not affected (white). Statistical significance was determined using a Wilcoxon matched-pairs signed-rank test with Bonferroni-Holm multiple comparison correction.
Figure 1—figure supplement 3.
Figure 1—figure supplement 3.. Innate immune cells in the blood of severe acute respiratory syndrome coronavirus 2 (SARS-CoV-2) mRNA vaccinated SARS-CoV-2 experienced rheumatoid arthritis using methotrexate (RA-MTX) and multiple sclerosis using ocrelizumab (MS-OCR) patients.
(a–c) Count per µl of blood (top) and frequency (bottom) of classical monocytes (a), non-classical monocytes (b), and neutrophils (c) before (T0) and 7 days after first (T1) and second vaccination (T3) in SARS-CoV-2 experienced RA-MTX patients, MS-OCR patients, and healthy controls (HCs). (d) Frequency of natural killer (NK) cell populations before (T0) and 7 days after first (T1) and second vaccination (T3) in SARS-CoV-2 experienced HCs, RA patients on MTX treatment and MS patients on OCR treatment. (e) Representation of the ranking metric (a score that combines fold-change and p-value) of CD38 expression within the different circulating NK cell populations after first (T1) and second (T3) vaccination as compared to baseline (T0). Each immune population is represented by a single column of colored squares, and each time point-disease group combination is represented by a single row. Color squares represent the populations in which CD38 expression is significantly reduced (blue), increased (red), or not affected (white). Statistical significance was determined using a Wilcoxon matched-pairs signed-rank test with Bonferroni-Holm multiple comparison correction.
Figure 2.
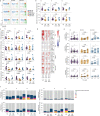
Figure 2.. Antibody and circulating B cells responses of severe acute respiratory syndrome coronavirus 2 (SARS-CoV-2) mRNA vaccinated SARS-CoV-2 experienced rheumatoid arthritis using methotrexate (RA-MTX) and multiple sclerosis using ocrelizumab (MS-OCR) patients.
(a–c) Results of ELISAs measuring antibody reactivity to RBD before vaccination (T0), 7 days after the first vaccination (T1), before second vaccination (T2), and 7 days after the second vaccination (T3) in SARS-CoV-2 experienced RA-MTX and MMS-OCR and healthy controls (HCs). The antibody titers of the time points T0, T1, and T3 were determined in plasma (P) and for time point T2 in serum (S). Anti-RBD IgG (top), anti-RBD IgM (middle), and anti-RBD IgA (bottom) levels are plotted longitudinally (a) or separated by groups across time points (b). (c) Percentage of participants seropositive for anti-RBD of the IgG, IgA, and/or IgM isotypes. (d) Count per µl of blood of total B cells. (e) Representative flow cytometry plots for the quantification of circulating B cell populations. Colors represent the populations that were identified by unbiased analysis. (f–h) Count per µl of blood of memory B cells (f), plasmablast (g), and plasma cells (h) before (T0) and 7 days after first (T1) and second vaccination (T3). Statistical significance was determined using a Wilcoxon signed-rank test (a, d, g, and h) or a Mann-Whitney test (b and f) with Bonferroni-Holm multiple comparison correction.
Figure 2—figure supplement 1.
Figure 2—figure supplement 1.. Antibody and circulating B cells responses in severe acute respiratory syndrome coronavirus 2 (SARS-CoV-2) mRNA vaccinated SARS-CoV-2 experienced rheumatoid arthritis using methotrexate (RA-MTX) and multiple sclerosis using ocrelizumab (MS-OCR) patients.
Results of ELISAs measuring antibody reactivity to RBD before vaccination (T0), 7 days after the first vaccination (T1), before second vaccination (T2), and 7 days (T3) and 28 days (T4) after the second vaccination in SARS-CoV-2 experienced RA-MTX patients, MS-OCR patients, and healthy controls (HCs). The antibody titers of the time points T0, T1, and T3 were determined in plasma (P) and for time point T2 and T4 in serum (S). (a) Percentage of participants seropositive for anti-RBD of the IgG isotypes and (b) IgG titer in time. (c–d) Count per µl of blood (top) and frequency (bottom) of B cell populations before (T0) and 7 days after first (T1) and second vaccination (T3) in SARS-CoV-2 experienced HC, RA-MTX, and MS-OCR. Statistical significance was determined using a Wilcoxon signed-rank test (c) and a Mann-Whitney test (d) with Bonferroni-Holm multiple comparison correction.
Figure 3.
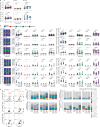
Figure 3.. Circulating CD4+ T follicular helper (Tfh) cell responses of severe acute respiratory syndrome coronavirus 2 (SARS-CoV-2) mRNA vaccinated SARS-CoV-2 experienced rheumatoid arthritis using methotrexate (RA-MTX) and multiple sclerosis using ocrelizumab (MS-OCR) patients.
(a) Count per µl of blood (top) and frequency (bottom) of circulating CD4+ Tfh (cTfh) cells before (T0) and 7 days after first (T1) and second vaccination (T3). (b) Representative flow cytometry plots for the quantification of cTfh cell populations. Colors represent the populations that were identified by unbiased analysis. (c) Number of cTfh1, cTfh2, cTfh17, cTfhTriplePos, and cTfhTripNeg cells before (T0) and 7 days after first (T1) and second vaccination (T3). (d) Heatmap representation showing the overlap in up- and down-regulated dynamic markers expression in cTfh cell subpopulations subsequent first (T1) and second (T3) vaccination as compared to baseline (T0) in the different groups. Each dynamic marker is represented by a single row of colored squares, and each time point-disease group combination is represented by a single column. Color squares represent the dynamic marker expression that is reduced (blue), increased (red), or not affected (white). (e) Frequency of responding cTfh1 cells before (T0) and 7 days after first (T1) and second vaccination (T3). (f) Stacked bar charts representing average fractions of cTfh1 cell co-expressing different dynamic molecule combinations. Statistical significance was determined using Wilcoxon signed-rank test (a, c, d, and e) with Bonferroni-Holm multiple comparison correction.
Figure 3—figure supplement 1.
Figure 3—figure supplement 1.. Circulating CD4+ T follicular helper (cTfh) cells of severe acute respiratory syndrome coronavirus 2 (SARS-CoV-2) mRNA vaccinated SARS-CoV-2 experienced rheumatoid arthritis using methotrexate (RA-MTX) and multiple sclerosis using ocrelizumab (MS-OCR) patients.
(a–b) Count per µl of blood (top) and frequency (bottom) of CD4+ cTfh populations before (T0) and 7 days after first (T1) and second vaccination (T3) in SARS-CoV-2 experienced RA-MTX patients, MS-OCR patients, and healthy controls (HCs). (c) Frequency of responding cTfh2, cTfh17, cTfhTriplePos, and cTfhTripNeg cells before (T0) and 7 days after first (T1) and second vaccination (T3). (d) Stacked bar charts representing average fractions of Tfh cell subpopulations co-expressing different dynamic molecule combinations. Statistical significance was determined using a Wilcoxon signed-rank test (a, c) and a Mann-Whitney test (b) with Bonferroni-Holm multiple comparison correction.
Figure 4.
Figure 4.. Circulating CD4+ T helper (Th) cell responses of severe acute respiratory syndrome coronavirus 2 (SARS-CoV-2) mRNA vaccinated SARS-CoV-2 experienced rheumatoid arthritis using methotrexate (RA-MTX) and multiple sclerosis using ocrelizumab (MS-OCR) patients.
(a) Count per µl of blood and frequency of CD4+ T helper (Th) cells before (T0) and 7 days after first (T1) and second vaccination (T3). (b) Representative flow cytometry plots for the quantification of circulating Th cell populations. Colors represent the populations that were identified by unbiased analysis. (c–f) Count per µl of blood of Th1 (c and d) and Th1-like (e and f) cells before (T0) and 7 days after first (T1) and second vaccination (T3). (g) Heatmap representation showing the overlap in up- and down-regulated dynamic markers expression in Th cell subpopulations subsequent first (T1) and second (T3) vaccination as compared to baseline (T0) in the different groups. Each dynamic marker is represented by a single row of colored squares, and each time point-disease group combination is represented by a single column. Color squares represent the dynamic marker expression that is reduced (blue), increased (red), or not affected (white). (h–i) Frequency of responding Th1 (h) and Th-like cells (i) before (T0) and 7 days after first (T1) and second vaccination (T3). (j–k) Stacked bar charts representing average fractions of Th1 (j) and Th1-like (k) cells co-expressing different dynamic molecules combinations. Statistical significance was determined using a Mann-Whitney test (a, d, and f) and using a Wilcoxon signed-rank test (c, e, g–i) with Bonferroni-Holm multiple comparison correction.
Figure 4—figure supplement 1.
Figure 4—figure supplement 1.. Circulating CD4+ T helper (Th) cells of severe acute respiratory syndrome coronavirus 2 (SARS-CoV-2) mRNA vaccinated SARS-CoV-2 experienced rheumatoid arthritis using methotrexate (RA-MTX) and multiple sclerosis using ocrelizumab (MS-OCR) patients.
(a–b) Count per µl of blood (top) and frequency (bottom) of CD4+ Th populations before (T0) and 7 days after first (T1) and second vaccination (T3) in SARS-CoV-2 experienced RA-MTX patients, MS-OCR patients, and healthy controls (HCs). (c) Volcano plots representing fold-change (log2) on the x-axis and significance (adjusted p-value; log10) on the y-axis. Each dot represents dynamic marker expression by the circulating immune population after first (T1) and second (T2) vaccination as compared to baseline (T0) in the SARS-CoV-2 experienced HC, RA-MTX, and MS-OCR. (d) Frequency of responding Th2, Th9, Th17, and other Th cells before (T0) and 7 days after first (T1) and second vaccination (T3). (e) Stacked bar charts representing average fractions of Th cell subpopulations co-expressing different dynamic molecules combinations. Statistical significance was determined using a Wilcoxon signed-rank test (a, c, and d) and a Mann-Whitney test (b) with Bonferroni-Holm multiple comparison correction.
Figure 5.
Figure 5.. CD8+ T cell responses of severe acute respiratory syndrome coronavirus 2 (SARS-CoV-2) mRNA vaccinated SARS-CoV-2 experienced rheumatoid arthritis using methotrexate (RA-MTX) and multiple sclerosis using ocrelizumab (MS-OCR) patients.
(a) Representative flow cytometry plots for the quantification of circulating CD8+ T cell populations. Colors represent the populations that were identified by unbiased analysis. (b–c) Count per µl of blood and frequency of total CD8+ T cells (a) and central memory (CM), effector memory (EM), effector memory CD45RA+ (EMRA), stem cell memory (SCM), naïve CD8+ T cells (c) before (T0) and 7 days after first (T1) and second vaccination (T3) in SARS-CoV-2 experienced RA-MTX patients, MS-OCR patients, and healthy control (HC). (d) Heatmap representation showing dynamic marker expression by CD8+ T cell subpopulations that are affected by first (T1) and second (T3) vaccination as compared to baseline (T0) in the different groups. Each dynamic marker is represented by a single row of colored squares, and each time point-disease group combination is represented by a single column. Color squares represent the populations that are significantly reduced (blue) or increased (red) or not affected (white). (e) Frequency of CD8 T cell subpopulations before (T0) and 7 days after first (T1) and second vaccination (T3). (f) Stacked bar charts representing average fractions of CD8 T cell subpopulations co-expressing different dynamic molecules combinations. Statistical significance was determined using a Mann-Whitney test (b and c) and using a Wilcoxon signed-rank test (d-e) with Bonferroni-Holm multiple comparison correction.
Figure 5—figure supplement 1.
Figure 5—figure supplement 1.. Circulating CD8+ T cells of severe acute respiratory syndrome coronavirus 2 (SARS-CoV-2) mRNA vaccinated SARS-CoV-2 experienced rheumatoid arthritis using methotrexate (RA-MTX) and multiple sclerosis using ocrelizumab (MS-OCR) patients.
(a–c) Count per µl of blood and frequency of total CD8+ T cell and CD8+ T cell subsets before (T0) and 7 days after first (T1) and second vaccination (T3) in SARS-CoV-2 experienced healthy controls (HCs), RA-MTX patients, MS-OCR patients, and HCs. (d) Volcano plots representing fold-change (log2) on the x-axis and significance (adjusted p-value; log10) on the y-axis. Each dot represents dynamic marker expression by CD8 T cell subsets after first (T1) and second (T3) vaccination as compared to baseline (T0) in HC, RA-MTX, and MS-OCR. (e) Stacked bar charts representing average fractions of CD8 T cell subpopulations co-expressing different dynamic molecules combinations. Statistical significance was determined using a Wilcoxon signed-rank test (a–b) and a Mann-Whitney test (c) with Bonferroni-Holm multiple comparison correction.

References

    1. Alison Tarke A, Coelho CH, Zhang Z, Dan JM, Yu ED, Methot N, Bloom NI, Goodwin B, Phillips E, Mallal S, Sidney J, Filaci G, Weiskopf D, da Silva Antunes R, Crotty S, Grifoni A, Sette A. SARS-CoV-2 Vaccination Induces Immunological Memory Able to Cross-Recognize Variants from Alpha to Omicron. bioRxiv. 2021 doi: 10.1101/2021.12.28.474333. - DOI - PMC - PubMed
    1. Apostolidis SA, Kakara M, Painter MM, Goel RR, Mathew D, Lenzi K, Rezk A, Patterson KR, Espinoza DA, Kadri JC, Markowitz DM, E Markowitz C, Mexhitaj I, Jacobs D, Babb A, Betts MR, Prak ETL, Weiskopf D, Grifoni A, Lundgreen KA, Gouma S, Sette A, Bates P, Hensley SE, Greenplate AR, Wherry EJ, Li R, Bar-Or A. Cellular and humoral immune responses following SARS-CoV-2 mRNA vaccination in patients with multiple sclerosis on anti-CD20 therapy. Nature Medicine. 2021;27:1990–2001. doi: 10.1038/s41591-021-01507-2. - DOI - PMC - PubMed
    1. Ashhurst TM, Marsh-Wakefield F, Putri GH, Spiteri AG, Shinko D, Read MN, Smith AL, King NJC. Integration, exploration, and analysis of high-dimensional single-cell cytometry data using Spectre. Cytometry. Part A. 2021;101:237–253. doi: 10.1002/cyto.a.24350. - DOI - PubMed
    1. Baden LR, El Sahly HM, Essink B, Kotloff K, Frey S, Novak R, Diemert D, Spector SA, Rouphael N, Creech CB, McGettigan J, Khetan S, Segall N, Solis J, Brosz A, Fierro C, Schwartz H, Neuzil K, Corey L, Gilbert P, Janes H, Follmann D, Marovich M, Mascola J, Polakowski L, Ledgerwood J, Graham BS, Bennett H, Pajon R, Knightly C, Leav B, Deng W, Zhou H, Han S, Ivarsson M, Miller J, Zaks T, COVE Study Group Efficacy and Safety of the mRNA-1273 SARS-CoV-2 Vaccine. The New England Journal of Medicine. 2021;384:403–416. doi: 10.1056/NEJMoa2035389. - DOI - PMC - PubMed
    1. Bouaziz JD, Yanaba K, Venturi GM, Wang Y, Tisch RM, Poe JC, Tedder TF. Therapeutic B cell depletion impairs adaptive and autoreactive CD4+ T cell activation in mice. PNAS. 2007;104:20878–20883. doi: 10.1073/pnas.0709205105. - DOI - PMC - PubMed

Publication types