Changes in Traffic Crash Rates After Legalization of Marijuana: Results by Crash Severity
- PMID: 35838426
- PMCID: PMC9318699
- DOI: 10.15288/jsad.2022.83.494
Changes in Traffic Crash Rates After Legalization of Marijuana: Results by Crash Severity
Abstract
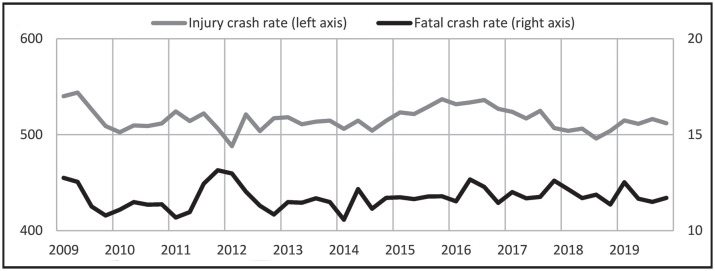
Objective: The objective of this study was to estimate the effects of marijuana legalization and the subsequent onset of retail sales on injury and fatal traffic crash rates in the United States during the period 2009-2019.
Method: State-by-state quarterly crash rates per mile of travel were modeled as a function of time, unemployment rate, maximum posted speed limit, seat belt use rate, alcohol use rate, percent of miles driven on rural roads, and indicators of legalized recreational marijuana use and sales.
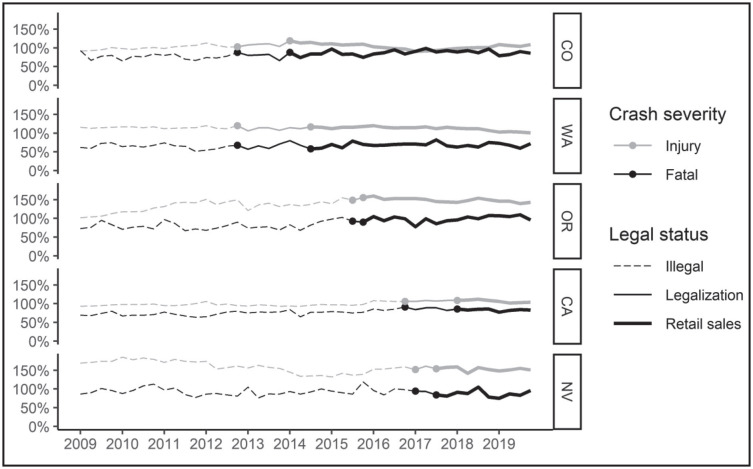
Results: Legalization of the recreational use of marijuana was associated with a 6.5% increase in injury crash rates and a 2.3% increase in fatal crash rates, but the subsequent onset of retail marijuana sales did not elicit additional substantial changes. Thus, the combined effect of legalization and retail sales was a 5.8% increase in injury crash rates and a 4.1% increase in fatal crash rates. Across states, the effects on injury crash rates ranged from a 7% decrease to an 18% increase. The effects on fatal crash rates ranged from a 10% decrease to a 4% increase.
Conclusions: The estimated increases in injury and fatal crash rates after recreational marijuana legalization are consistent with earlier studies, but the effects varied across states. Because this is an early look at the time trends, researchers and policymakers need to continue monitoring the data.
Figures
Similar articles
-
Collisions and cannabis: Measuring the effect of recreational marijuana legalization on traffic crashes in Washington State.Traffic Inj Prev. 2023;24(7):527-535. doi: 10.1080/15389588.2023.2220853. Epub 2023 Jun 22. Traffic Inj Prev. 2023. PMID: 37347154
-
An examination of relationships between cannabis legalization and fatal motor vehicle and pedestrian-involved crashes.Traffic Inj Prev. 2020;21(8):521-526. doi: 10.1080/15389588.2020.1810246. Epub 2020 Aug 28. Traffic Inj Prev. 2020. PMID: 32856949 Free PMC article.
-
Crash Fatality Rates After Recreational Marijuana Legalization in Washington and Colorado.Am J Public Health. 2017 Aug;107(8):1329-1331. doi: 10.2105/AJPH.2017.303848. Epub 2017 Jun 22. Am J Public Health. 2017. PMID: 28640679 Free PMC article.
-
Evaluating the public health impacts of legalizing recreational cannabis use in the United States.Addiction. 2016 Oct;111(10):1764-73. doi: 10.1111/add.13428. Epub 2016 Jun 7. Addiction. 2016. PMID: 27082374 Review.
-
Cannabis use among U.S. adolescents in the era of marijuana legalization: a review of changing use patterns, comorbidity, and health correlates.Int Rev Psychiatry. 2020 May;32(3):221-234. doi: 10.1080/09540261.2020.1713056. Epub 2020 Feb 6. Int Rev Psychiatry. 2020. PMID: 32026735 Free PMC article. Review.
Cited by
-
Regulation of Cannabis Retailers: Facilitating Responsible Adult Use and Promoting Health Equity While Preventing Access to Minors.Am J Public Health. 2022 Nov;112(11):1532-1534. doi: 10.2105/AJPH.2022.307102. Am J Public Health. 2022. PMID: 36223589 Free PMC article. No abstract available.
-
A study of self-reported personal cannabis use and state legal status and associations with engagement in and perceptions of cannabis-impaired driving.Traffic Inj Prev. 2022;23(sup1):S183-S186. doi: 10.1080/15389588.2022.2124803. Epub 2022 Oct 19. Traffic Inj Prev. 2022. PMID: 37014194 Free PMC article.
-
Drug use among individuals injured in non-fatal motor vehicle crashes and related policies in 2023.Traffic Inj Prev. 2025 Feb 25:1-9. doi: 10.1080/15389588.2025.2456952. Online ahead of print. Traffic Inj Prev. 2025. PMID: 39998816
-
The clouded debate: A systematic review of comparative longitudinal studies examining the impact of recreational cannabis legalization on key public health outcomes.Front Psychiatry. 2023 Jan 11;13:1060656. doi: 10.3389/fpsyt.2022.1060656. eCollection 2022. Front Psychiatry. 2023. PMID: 36713920 Free PMC article.
-
State cannabis laws and cannabis positivity among fatally injured drivers.Inj Epidemiol. 2024 Apr 11;11(1):14. doi: 10.1186/s40621-024-00498-1. Inj Epidemiol. 2024. PMID: 38605393 Free PMC article.
References
-
- Anderson D. M., Hansen B.&Rees D. I. Medical marijuana laws, traffic fatalities, and alcohol consumption. Journal of Law & Economics. 2013;56:333–369. doi:10.1086/668812.
-
- Aydelotte J. D., Mardock A. L., Mancheski C. A., Quamar S. M., Teixeira P. G., Brown C. V. R.&Brown L. H. Fatal crashes in the 5 years after recreational marijuana legalization in Colorado and Washington. Accident Analysis and Prevention. 2019;132:105284. doi:10.1016/j.aap.2019.105284. - PubMed
-
- Brooks-Russell A., Brown T., Rapp-Olsson A. M., Friedman K.&Kosnett M. Driving after cannabis use and compensatory driving behaviors among current cannabis users in Colorado. Traffic Injury Prevention. 2019;20:S199–S201. doi:10.1080/15389588.2019.1665424.
-
- Chen C., Subramanian R., Choi E.&Liu C. Washington, DC: National Highway Traffic Safety Administration; 2010. Statistical methodology to make early estimates of motor vehicle traffic fatalities. Report No. DOT HS 811 123.
Publication types
MeSH terms
LinkOut - more resources
Full Text Sources
Medical