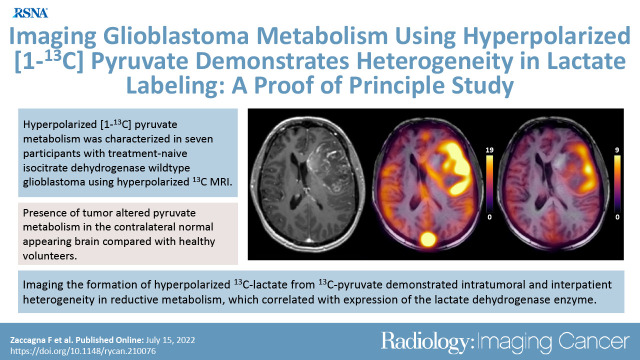
Imaging Glioblastoma Metabolism by Using Hyperpolarized [1-13C]Pyruvate Demonstrates Heterogeneity in Lactate Labeling: A Proof of Principle Study
- PMID: 35838532
- PMCID: PMC9360994
- DOI: 10.1148/rycan.210076
Imaging Glioblastoma Metabolism by Using Hyperpolarized [1-13C]Pyruvate Demonstrates Heterogeneity in Lactate Labeling: A Proof of Principle Study
Abstract
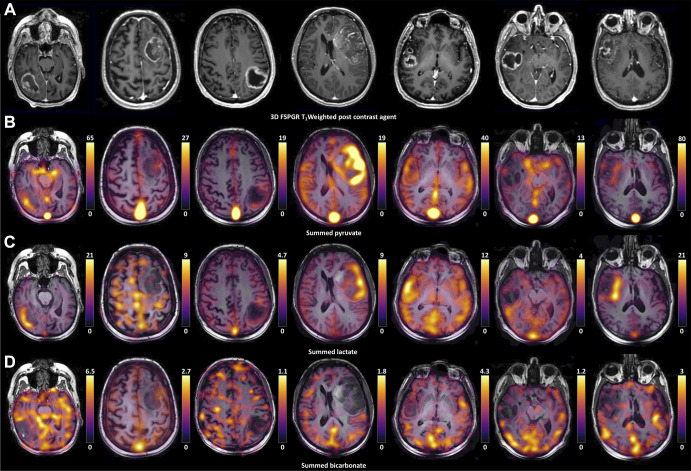
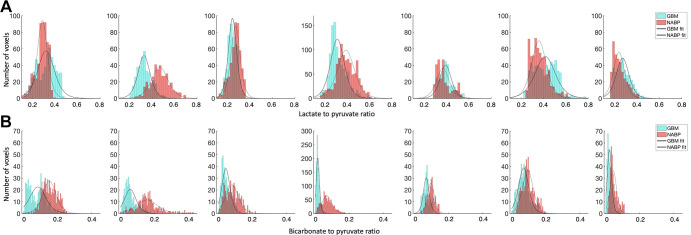
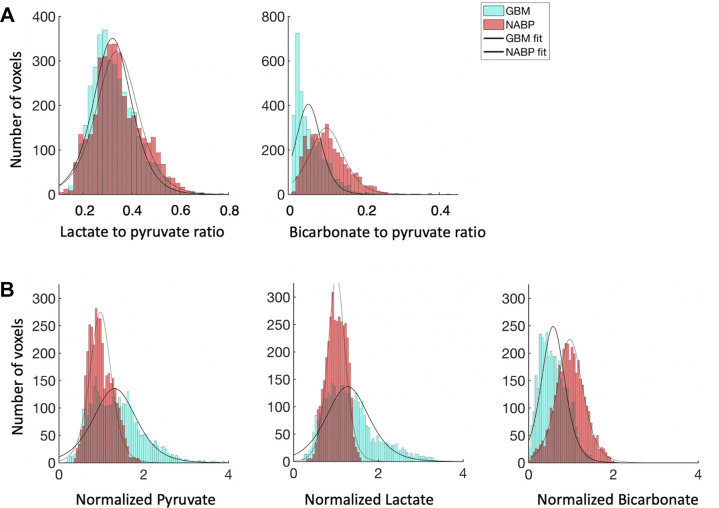
Purpose To evaluate glioblastoma (GBM) metabolism by using hyperpolarized carbon 13 (13C) MRI to monitor the exchange of the hyperpolarized 13C label between injected [1-13C]pyruvate and tumor lactate and bicarbonate. Materials and Methods In this prospective study, seven treatment-naive patients (age [mean ± SD], 60 years ± 11; five men) with GBM were imaged at 3 T by using a dual-tuned 13C-hydrogen 1 head coil. Hyperpolarized [1-13C]pyruvate was injected, and signal was acquired by using a dynamic MRI spiral sequence. Metabolism was assessed within the tumor, in the normal-appearing brain parenchyma (NABP), and in healthy volunteers by using paired or unpaired t tests and a Wilcoxon signed rank test. The Spearman ρ correlation coefficient was used to correlate metabolite labeling with lactate dehydrogenase A (LDH-A) expression and some immunohistochemical markers. The Benjamini-Hochberg procedure was used to correct for multiple comparisons. Results The bicarbonate-to-pyruvate (BP) ratio was lower in the tumor than in the contralateral NABP (P < .01). The tumor lactate-to-pyruvate (LP) ratio was not different from that in the NABP (P = .38). The LP and BP ratios in the NABP were higher than those observed previously in healthy volunteers (P < .05). Tumor lactate and bicarbonate signal intensities were strongly correlated with the pyruvate signal intensity (ρ = 0.92, P < .001, and ρ = 0.66, P < .001, respectively), and the LP ratio was weakly correlated with LDH-A expression in biopsy samples (ρ = 0.43, P = .04). Conclusion Hyperpolarized 13C MRI demonstrated variation in lactate labeling in GBM, both within and between tumors. In contrast, bicarbonate labeling was consistently lower in tumors than in the surrounding NABP. Keywords: Hyperpolarized 13C MRI, Glioblastoma, Metabolism, Cancer, MRI, Neuro-oncology Supplemental material is available for this article. Published under a CC BY 4.0 license.
Keywords: Cancer; Glioblastoma; Hyperpolarized 13C MRI; MRI; Metabolism; Neuro-oncology.
Conflict of interest statement
Figures
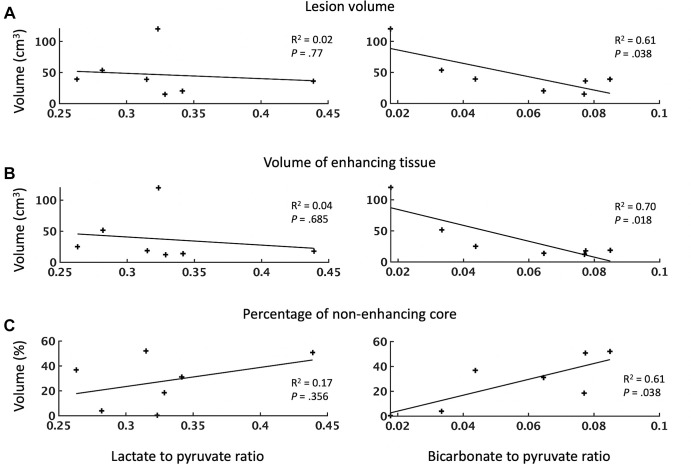
![Relationship between lactate dehydrogenase A (LDH-A) expression and
labeling of lactate and pyruvate following injection of hyperpolarized
[1-13C]pyruvate. Scatterplots show the relationship between LDH-A expression
and the lactate-to-pyruvate and bicarbonate-to-pyruvate ratios. Each point
represents a tissue sample. The R2 values, representing the goodness of fit,
and P values for each regression are shown.](https://cdn.ncbi.nlm.nih.gov/pmc/blobs/d92b/9360994/d219213ca25b/rycan.210076.fig5.jpg)
References
-
- Bi J , Chowdhry S , Wu S , Zhang W , Masui K , Mischel PS . Altered cellular metabolism in gliomas—an emerging landscape of actionable co-dependency targets . Nat Rev Cancer 2020. ; 20 ( 1 ): 57 – 70 . - PubMed
-
- Corbin Z , Spielman D , Recht L . A metabolic therapy for malignant glioma requires a clinical measure . Curr Oncol Rep 2017. ; 19 ( 12 ): 84 . - PubMed
-
- Kathagen A , Schulte A , Balcke G , et al. . Hypoxia and oxygenation induce a metabolic switch between pentose phosphate pathway and glycolysis in glioma stem-like cells . Acta Neuropathol (Berl) 2013. ; 126 ( 5 ): 763 – 780 . - PubMed
Publication types
MeSH terms
Substances
Grants and funding
- BRC-1215-20014/DH_/Department of Health/United Kingdom
- C9685/A25177/CRUK_/Cancer Research UK/United Kingdom
- C197/A16465/CRUK_/Cancer Research UK/United Kingdom
- C19212/A911376/CRUK_/Cancer Research UK/United Kingdom
- C19212/A16628/CRUK_/Cancer Research UK/United Kingdom
- A25040/CRUK_/Cancer Research UK/United Kingdom
- 28289/CRUK_/Cancer Research UK/United Kingdom
- C8742/A18097/CRUK_/Cancer Research UK/United Kingdom
- WT_/Wellcome Trust/United Kingdom
- J 4025/FWF_/Austrian Science Fund FWF/Austria
- A29580/CRUK_/Cancer Research UK/United Kingdom
- 16465/CRUK_/Cancer Research UK/United Kingdom
LinkOut - more resources
Full Text Sources
Miscellaneous