. 2022 Sep;144(3):589-601.
doi: 10.1007/s00401-022-02467-8. Epub 2022 Jul 15.

Distinct tau neuropathology and cellular profiles of an APOE3 Christchurch homozygote protected against autosomal dominant Alzheimer's dementia

Affiliations

Distinct tau neuropathology and cellular profiles of an APOE3 Christchurch homozygote protected against autosomal dominant Alzheimer's dementia

Diego Sepulveda-Falla et al. Acta Neuropathol. 2022 Sep.

Abstract

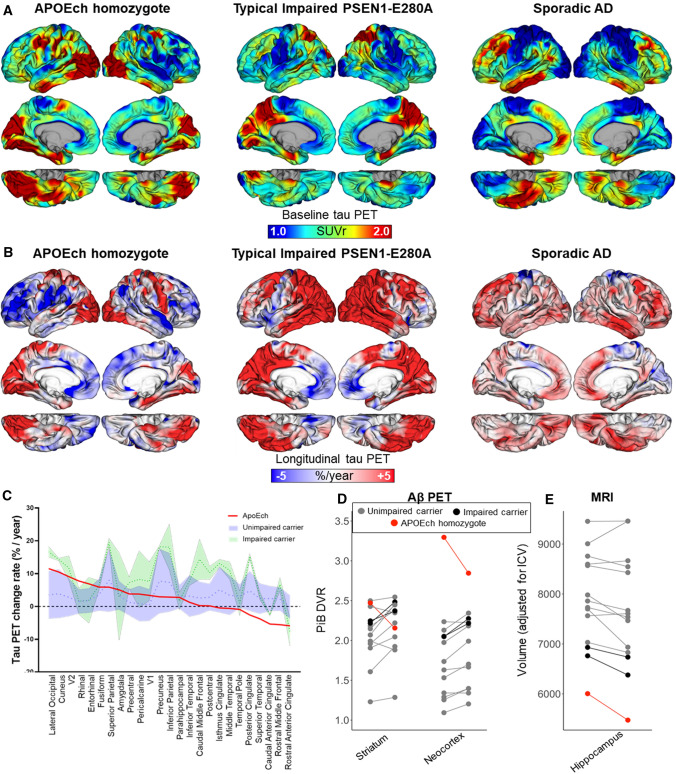
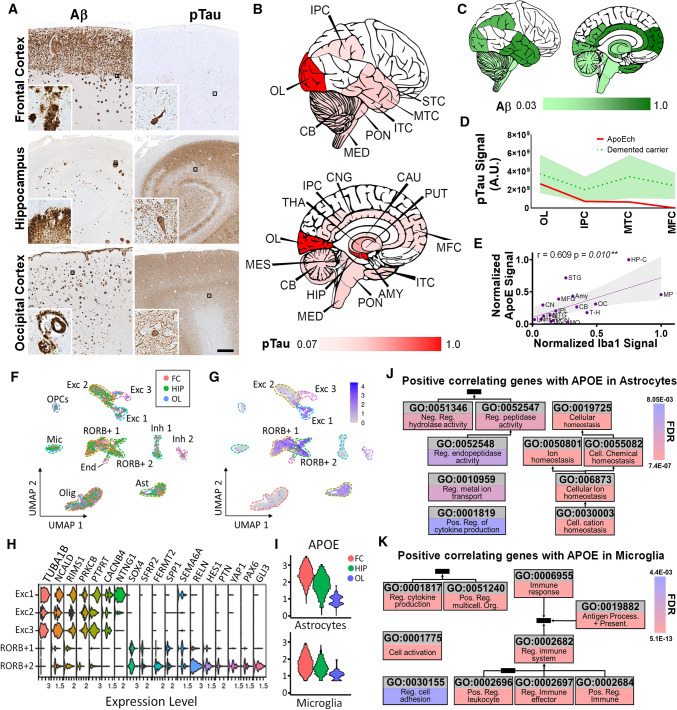
We describe in vivo follow-up PET imaging and postmortem findings from an autosomal dominant Alzheimer's disease (ADAD) PSEN1 E280A carrier who was also homozygous for the APOE3 Christchurch (APOE3ch) variant and was protected against Alzheimer's symptoms for almost three decades beyond the expected age of onset. We identified a distinct anatomical pattern of tau pathology with atypical accumulation in vivo and unusual postmortem regional distribution characterized by sparing in the frontal cortex and severe pathology in the occipital cortex. The frontal cortex and the hippocampus, less affected than the occipital cortex by tau pathology, contained Related Orphan Receptor B (RORB) positive neurons, homeostatic astrocytes and higher APOE expression. The occipital cortex, the only cortical region showing cerebral amyloid angiopathy (CAA), exhibited a distinctive chronic inflammatory microglial profile and lower APOE expression. Thus, the Christchurch variant may impact the distribution of tau pathology, modulate age at onset, severity, progression, and clinical presentation of ADAD, suggesting possible therapeutic strategies.

Keywords: APOE; Alzheimer’s disease; Dementia; PET; Tau; Transcriptomics.


Conflict of interest statement

RAS has received personal compensation from AC Immune, Eisai, Roche, and Takeda, and research grant support from Eli Lilly and Janssen. YTQ, JFAV, EMR, FL are listed as co-inventors of a patent application for therapeutics modulating interactions between APOE and HSPG filed by MGB. All other authors have no competing interests.

Figures

Fig. 1
Fig. 1
Longitudinal tau PET imaging measures in an APOE3ch homozygote. A Surface rendering of tau PET (Flortaucipir) images (standardized uptake value ratio, SUVr), at baseline, 3-year follow-up (center), and B rate of change (expressed as %/year), in the APOE3ch homozygote, (left) a typical PSEN1-E280A impaired carrier (center) and a sporadic AD case (right). C Distribution area plot showing annualized percent change rates in tau PET for APOE3ch homozygote (red line) relative to unimpaired (blue) and impaired (green) PSEN1-E280A carriers. Regions along the x-axis are ordered from highest to lowest change rate observed in the APOE3ch homozygote. D Spaghetti plots of Aβ PET (Pittsburgh Compound B, PiB) measurements at baseline and 2-year follow-up, E Structural MRI measurements at baseline and 2-year follow-up of hippocampal volume
Fig. 2
Fig. 2
Neuropathological and molecular characterization of an ADAD PSEN1E280A mutation carrier with two copies of the APOE3ch variant. A Representative panels for tau and Aβ pathology in frontal cortex, hippocampus, and occipital cortex. Insets show specific pathological features found in each brain area, such as NFT, dystrophic neurites and diffuse tau pathology, together with diffuse, core Aβ plaques and CAA. Bar = 500 µm. B Graphic representation of general distribution and intensity of tau pathology signal with normalized lower and maximum values represented in red intensity. MFC medial frontal cortex, STC superior temporal cortex, MTC middle temporal cortex, ITC inferior temporal cortex, HIP hippocampus, AMY amygdala, CNG cingulate cortex, PUT putamen, CAU caudate, THA thalamus, IPC inferior parietal cortex, OL occipital lobe, CB cerebellum, MES mesencephalon, PON pons, MED medulla oblongata. C Graphic representation of distribution and intensity of Aβ signal with normalized lower and maximum values represented in green intensity. D Distribution area plot showing tau integrated density signal in cortical areas in APOE3ch homozygote (red line) relative to impaired (green) PSEN1-E280A carriers. Areas are ordered according to the highest to lowest tau integrated density in the APOE3ch homozygote. E Correlation scatter plot for ApoE signal intensity against Iba1 signal intensity in all areas studied in B. A positive correlation was identified as statistically significant. (**p ≤ 0.01). F UMAP clustering plot of snRNA sequencing data from the frontal cortex (FC, red dots), hippocampus (HIP, green dots) and occipital cortex (OL, blue dots). Identified clusters include excitatory neurons (Exc 1, 2 and 3), oligodendrocyte precursor cells (OPCs), microglia (Mic), RORB positive neurons (RORB + 1 and 2), inhibitory neurons (Inh 1 and 2), endothelial cells (End), oligodendrocytes (Olig) and astrocytes (Ast). G UMAP clustering plot of snRNA sequencing data from the analyzed areas depicting RORB expression levels in the different clusters. H Violin plots for differential expression of representative genes between excitatory neurons and RORB + neurons clusters. Excitatory clusters differentially express functional synaptic genes while RORB1 clusters express neuronal development genes. I Violin plots for APOE expression in FC, HIP and OL in astrocytes and microglia. J Top gene ontology terms from overrepresented genes positively correlating with APOE expression in astrocytes from frontal cortex, hippocampus and occipital cortex. K Top gene ontology terms from overrepresented genes positively correlating with APOE expression in microglia from frontal cortex, hippocampus and occipital cortex

References

    1. Arboleda-Velasquez JF, Lopera F, O’Hare M, Delgado-Tirado S, Marino C, Chmielewska N, et al. Resistance to autosomal dominant Alzheimer’s disease in an APOE3 Christchurch homozygote: a case report. Nat Med. 2019;25:1680–1683. doi: 10.1038/s41591-019-0611-3. - DOI - PMC - PubMed
    1. Attems J, Jellinger KA, Lintner F. Alzheimer’s disease pathology influences severity and topographical distribution of cerebral amyloid angiopathy. Acta Neuropathol. 2005;110:222–231. doi: 10.1007/s00401-005-1064-y. - DOI - PubMed
    1. Bahl E, Koomar T, Michaelson JJ. cerebroViz: an R package for anatomical visualization of spatiotemporal brain data. Bioinformatics. 2017;33:762–763. doi: 10.1093/bioinformatics/btw726. - DOI - PMC - PubMed
    1. Braak H, Braak E. Neuropathological stageing of Alzheimer-related changes. Acta Neuropathol. 1991;82:239–259. doi: 10.1007/bf00308809. - DOI - PubMed
    1. Crutch SJ, Schott JM, Rabinovici GD, Murray M, Snowden JS, van der Flier WM, et al. Consensus classification of posterior cortical atrophy. Alzheimers Dement. 2017;13:870–884. doi: 10.1016/j.jalz.2017.01.014. - DOI - PMC - PubMed

Publication types