Best-Worst Scaling and the Prioritization of Objects in Health: A Systematic Review
- PMID: 35838889
- PMCID: PMC9363399
- DOI: 10.1007/s40273-022-01167-1
Best-Worst Scaling and the Prioritization of Objects in Health: A Systematic Review
Abstract
Background and objective: Best-worst scaling is a theory-driven method that can be used to prioritize objects in health. We sought to characterize all studies of best-worst scaling to prioritize objects in health, to assess trends of using best-worst scaling in prioritization over time, and to assess the relationship between a legacy measure of quality (PREFS) and a novel assessment of subjective quality and policy relevance.
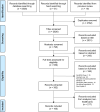
Methods: A systematic review identified studies published through to the end of 2021 that applied best-worst scaling to study priorities in health (PROSPERO CRD42020209745), updating a prior review published in 2016. The PubMed, EBSCOhost, Embase, Scopus, APA PsychInfo, Web of Science, and Google Scholar databases were used and were supplemented by a hand search. Data describing the application, development, design, administration/analysis, quality, and policy relevance were summarized and we tested for trends by comparing articles before and after 1 January, 2017. Multivariate statistics were then used to assess the relationships between PREFS, subjective quality, policy relevance, and other possible indicators.
Results: From a total of 2826 unique papers identified, 165 best-worst scaling studies were included in this review. Applications of best-worst scaling to study priorities in health have continued to grow (p < 0.01) and are now used in all regions of the world, most often to study the priorities of patients/consumers (67%). Several key trends can be observed over time: increased use of pretesting (p < 0.05); increased use of online administration (p < 0.01), and decreased use of paper self-administered surveys (p = 0.02); increased use of heterogeneity analysis (p = 0.02); an increase in having a clearly stated purpose (p < 0.01); and a decrease in comparing respondents to non-respondents (p = 0.01). The average sample size has more than doubled, from 228 to 472 respondents, but formal sample size justifications remain low (5.3%) and unchanged over time (p = 0.68). While the average PREFS score remained unchanged at 3.1/5, both subjective quality and policy relevance trended up, but changes were not statistically significant (p = 0.06 and p = 0.13). Most of the variation in subjective quality was driven by PREFS (R2 = 0.42), but it was also positively assosciated with policy relevance, heterogeneity analysis, and using a balanced incomplete block design, and was negatively associated with not using developmental methods and an increasing sample size.
Conclusions: Using best-worst scaling to prioritize objects is now commonly used around the world to assess the priorities of patients and other stakeholders in health. Best practices are clearly emerging for best-worst scaling. Although legacy measures (PREFS) to measure study quality are reasonable, there may need to be new tools to assess both study quality and policy relevance.
© 2022. The Author(s).
Conflict of interest statement
Ilene L. Hollin, Jonathan Paskett, Anne L.R. Schuster, Norah L. Crossnohere, and John F.P. Bridges have no conflicts of interest that are directly relevant to the content of this article.
Figures
References
Publication types
MeSH terms
LinkOut - more resources
Full Text Sources


