. 2022 Oct 27;140(17):1875-1890.
doi: 10.1182/blood.2021015036.

Epigenetic regulator genes direct lineage switching in MLL/AF4 leukemia

Affiliations

Epigenetic regulator genes direct lineage switching in MLL/AF4 leukemia

Ricky Tirtakusuma et al. Blood. .

Abstract

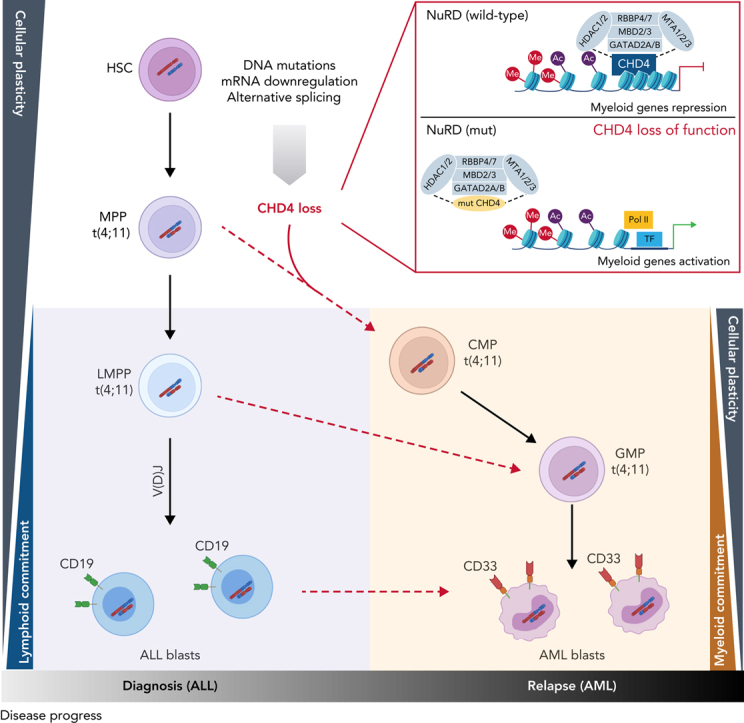
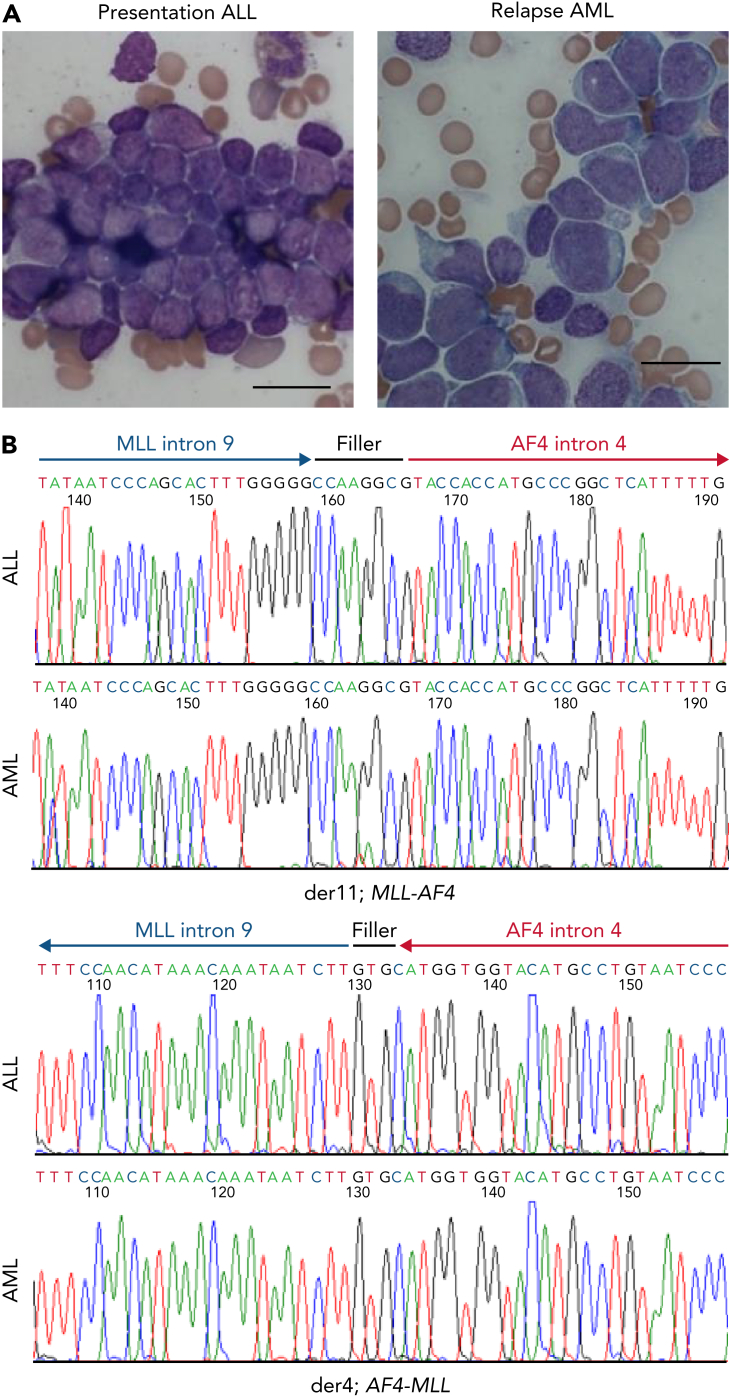
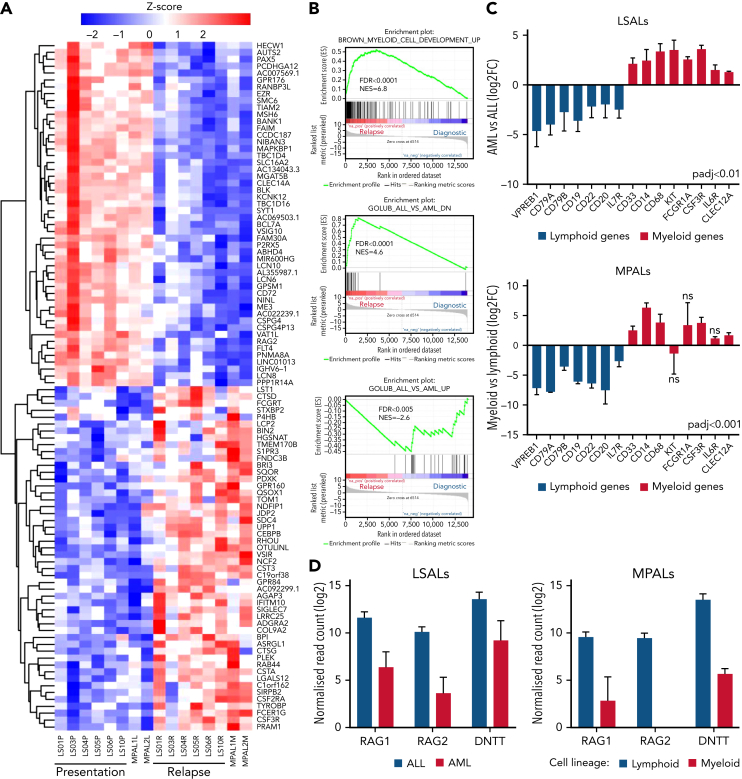
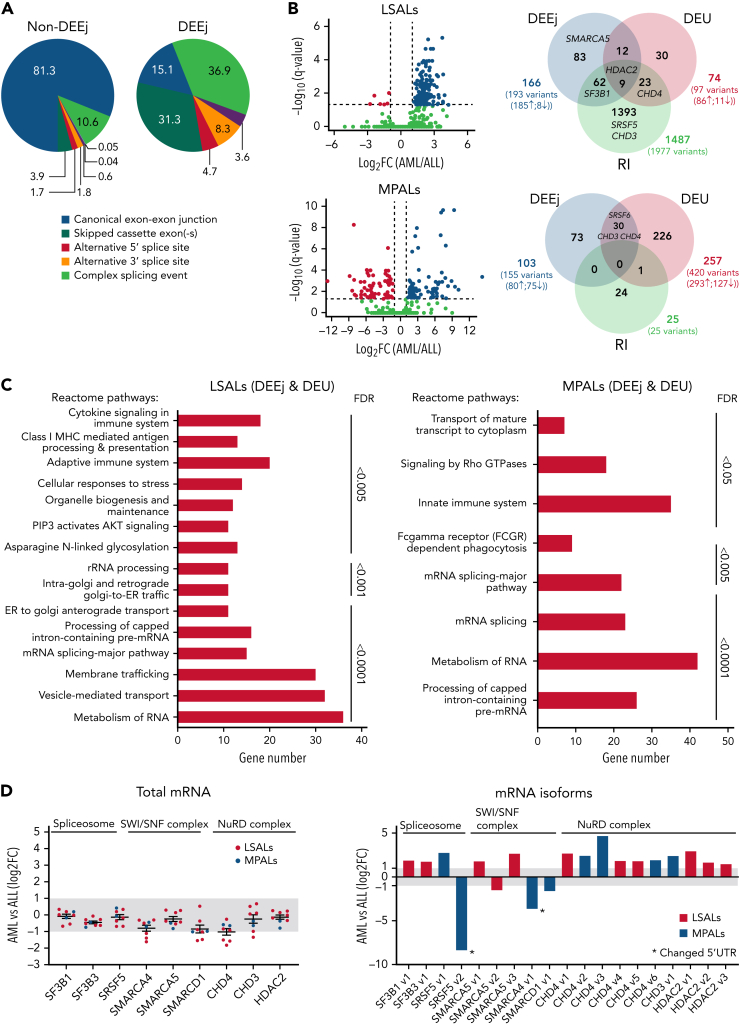
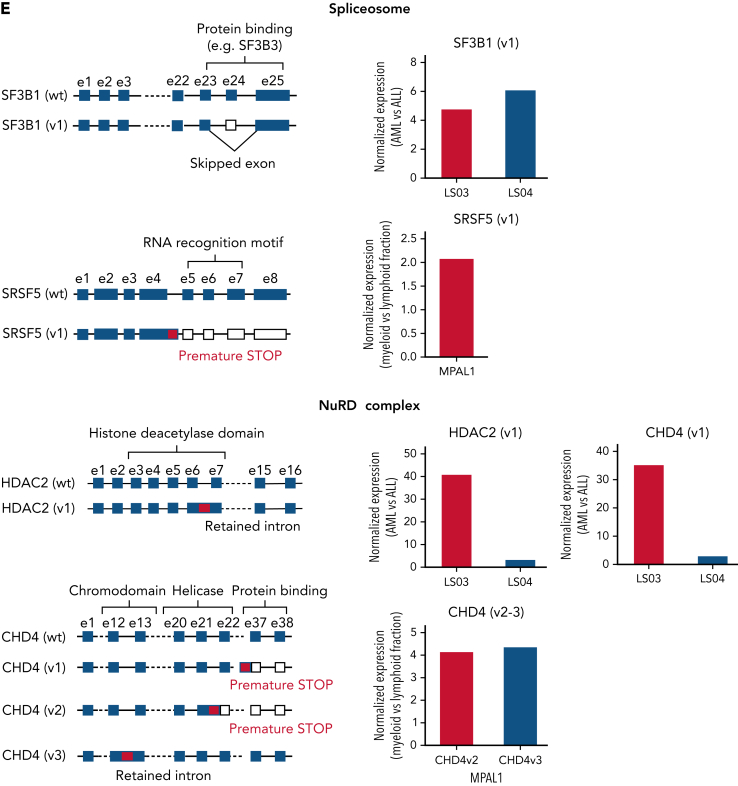
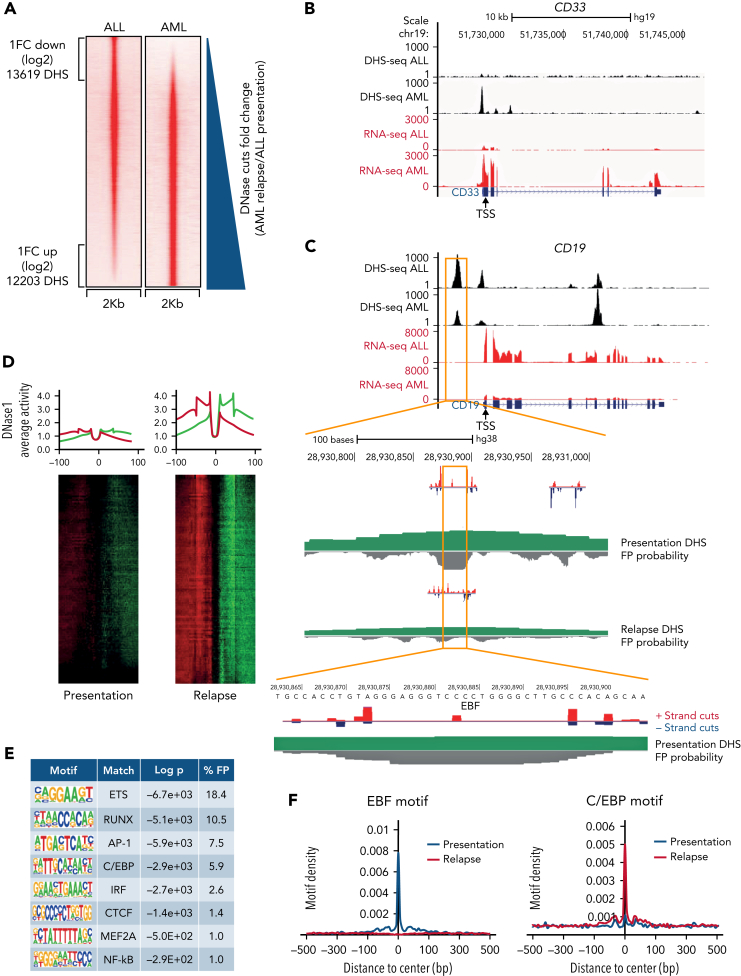
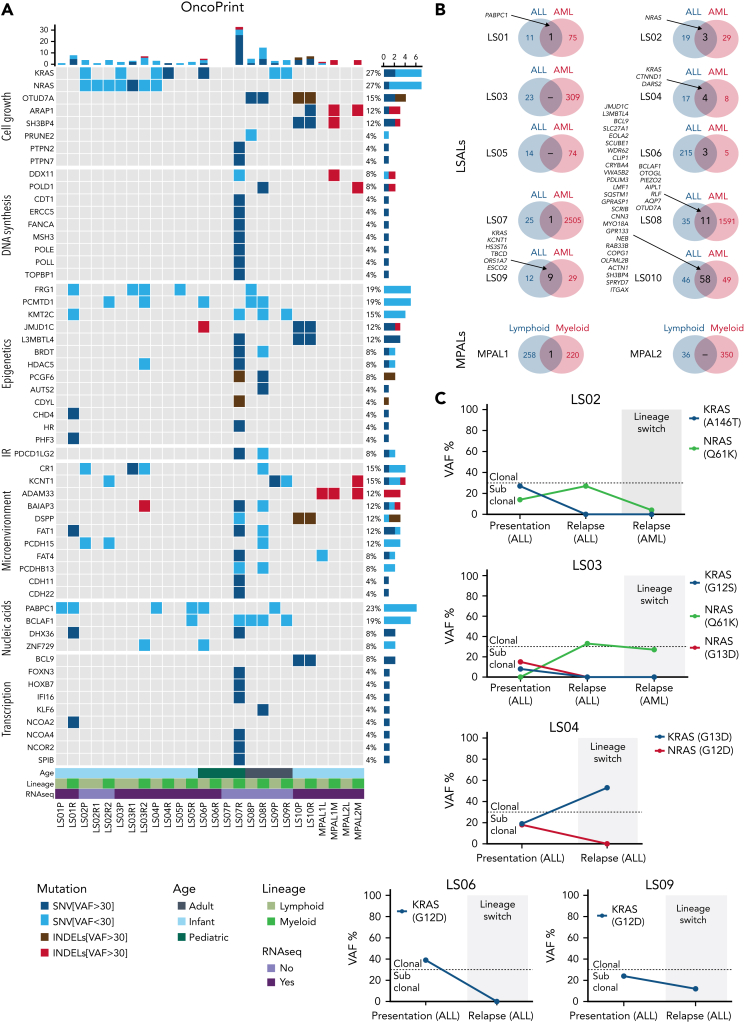
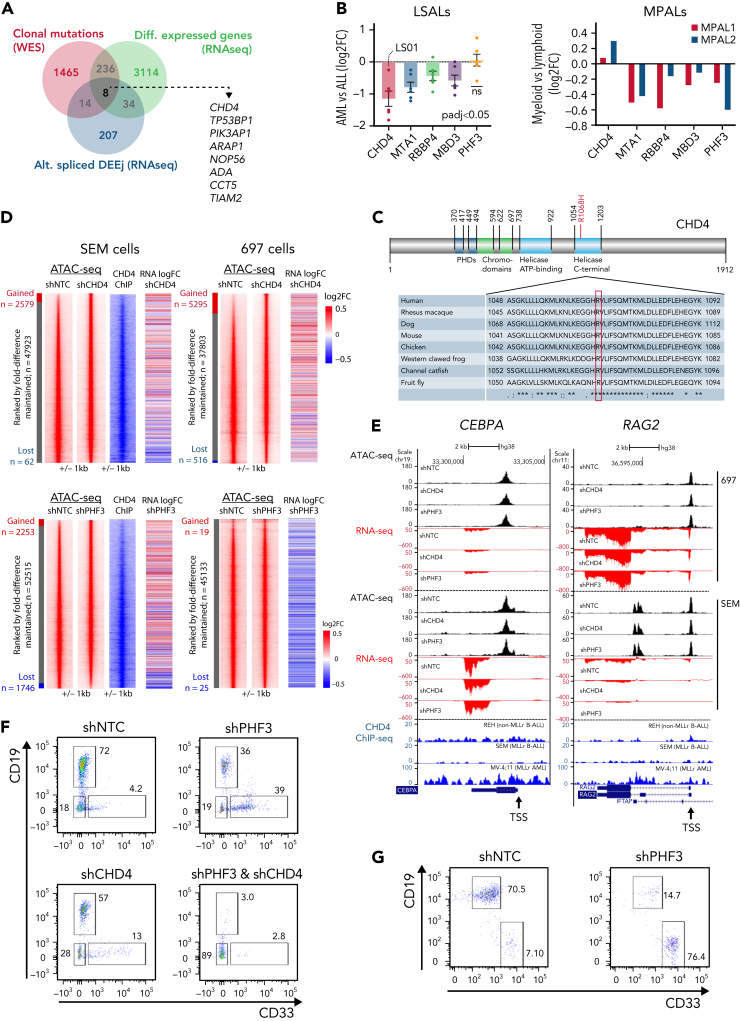
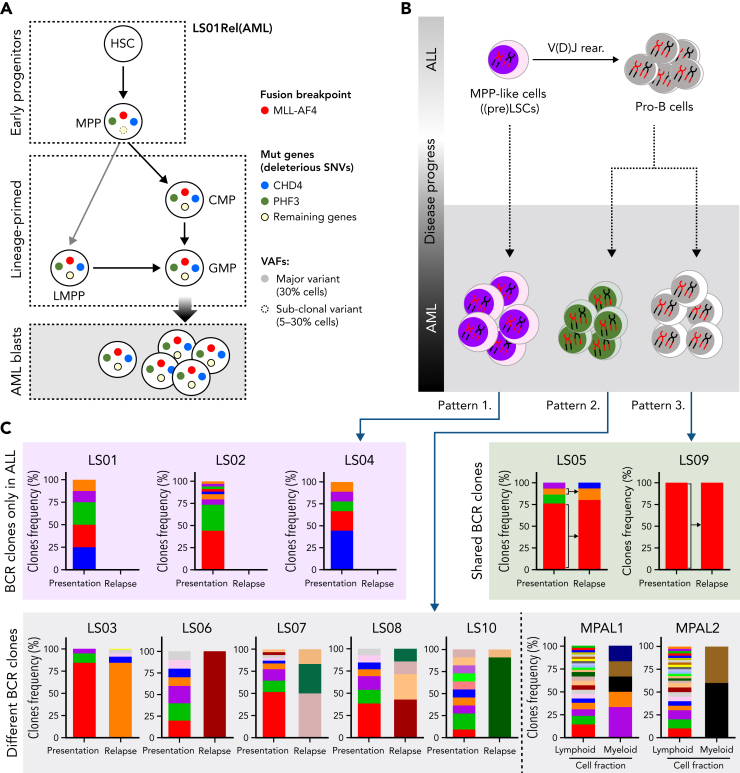
The fusion gene MLL/AF4 defines a high-risk subtype of pro-B acute lymphoblastic leukemia. Relapse can be associated with a lineage switch from acute lymphoblastic to acute myeloid leukemia, resulting in poor clinical outcomes caused by resistance to chemotherapies and immunotherapies. In this study, the myeloid relapses shared oncogene fusion breakpoints with their matched lymphoid presentations and originated from various differentiation stages from immature progenitors through to committed B-cell precursors. Lineage switching is linked to substantial changes in chromatin accessibility and rewiring of transcriptional programs, including alternative splicing. These findings indicate that the execution and maintenance of lymphoid lineage differentiation is impaired. The relapsed myeloid phenotype is recurrently associated with the altered expression, splicing, or mutation of chromatin modifiers, including CHD4 coding for the ATPase/helicase of the nucleosome remodelling and deacetylation complex. Perturbation of CHD4 alone or in combination with other mutated epigenetic modifiers induces myeloid gene expression in MLL/AF4+ cell models, indicating that lineage switching in MLL/AF4 leukemia is driven and maintained by disrupted epigenetic regulation.


Conflict of interest statement

Conflict-of-interest disclosure: Z.K. and J.B. are employees of Illumina, a public company that develops and markets systems for genetic analysis. The remaining authors declare no competing financial interests.

Figures

None
Graphical abstract
Figure 1.
Figure 1.
Characterization of MLL/AF4 lineage-switched cases. (A) Morphological change from lymphoblastic leukemia (left) to acute monoblastic/monocytic leukemia (right) in patient LS01. Bar represents 20 μm. (B) Sanger sequencing of MLL/AF4 and reciprocal AF4/MLL fusions in LS01 presentation ALL (top) and relapsed AML (bottom) identifies a common breakpoint with identical filler sequences in the ALL and AML samples.
Figure 2.
Figure 2.
Transcriptional reprogramming in lineage-switched and MPAL cases. (A) Heat map showing the top 100 differentially expressed genes between ALL and AML from 6 lineage-switched (LS01, LS03, LS04, LS05, LS06, and LS10) and 2 MPAL cases, ranked by Wald statistics. (B) Enrichment of myeloid growth and differentiation signature in relapse samples (left) identified by gene set enrichment analyses (GSEA), also pointing to downregulation of genes highly correlating with acute lymphoblastic leukemia (middle and right). GSEAs were performed based on data derived from 6 lineage-switched samples. FDR, false-discovery rate; NES, normalized enrichment score. Differential expression of lineage-specific (C) and immunoglobulin recombination machinery genes (D) in lineage-switched and MPAL cases. Error bars show standard error of the mean for lineage-switched cases and ranges for 2 MPAL cases.
Figure 3.
Figure 3.
Alternative splicing in lineage-switched and MPAL cases. (A) Pie charts showing the classification of nondifferential (non-DEEj) and differential (DEEj) exon-exon junctions. Shown are the percentages of splicing events assigned to a particular mode of splicing. A complex splicing event corresponds to several (2 or more) alternative splicing incidents occurring simultaneously in the same sample. (B) Volcano plots demonstrating differential usage of exon-exon junctions in the transcriptome of AML/myeloid vs ALL/lymphoid cells of cases of lineage switching (LS01, LS03, and LS04) or MPAL. The vertical dashed lines represent twofold differences between the AML and ALL cells, and the horizontal dashed line shows the FDR-adjusted q-value threshold of .05 (left). Venn diagrams (right) showing distribution of splice variants identified as significantly changed in AML (or myeloid fraction of patients with MPAL), including DEEjs, differential exon usage (DEU), and retained introns (RI). (C) Enrichment analysis of affected signaling pathways by the DEEjs and DEU in the lineage-switched acute leukemia (LSAL) AML relapse and myeloid compartment of patients with MPAL. Pathway enrichment analysis was performed with g:Profiler (https://biit.cs.ut.ee/gprofiler/gost) at the highest significance threshold, with multiple-testing correction (g:SCS algorithm). (D) Fold log2 change of total transcript levels among genes affected by alternative splicing (left) and of differentially spliced variants in lineage-switched and myeloid compartments of patients with MPAL (right). (E) Representation of impact of alternative splicing on mRNA composition and open reading frames (ORFs) of select genes. Column graphs on the right indicate corresponding fold changes of variant expression between AML (or myeloid) and ALL (or lymphoid) populations in 2 tested lineage-switched cases (LS03 and LS04) and 1 case of MPAL.
Figure 3.
Figure 3.
Alternative splicing in lineage-switched and MPAL cases. (A) Pie charts showing the classification of nondifferential (non-DEEj) and differential (DEEj) exon-exon junctions. Shown are the percentages of splicing events assigned to a particular mode of splicing. A complex splicing event corresponds to several (2 or more) alternative splicing incidents occurring simultaneously in the same sample. (B) Volcano plots demonstrating differential usage of exon-exon junctions in the transcriptome of AML/myeloid vs ALL/lymphoid cells of cases of lineage switching (LS01, LS03, and LS04) or MPAL. The vertical dashed lines represent twofold differences between the AML and ALL cells, and the horizontal dashed line shows the FDR-adjusted q-value threshold of .05 (left). Venn diagrams (right) showing distribution of splice variants identified as significantly changed in AML (or myeloid fraction of patients with MPAL), including DEEjs, differential exon usage (DEU), and retained introns (RI). (C) Enrichment analysis of affected signaling pathways by the DEEjs and DEU in the lineage-switched acute leukemia (LSAL) AML relapse and myeloid compartment of patients with MPAL. Pathway enrichment analysis was performed with g:Profiler (https://biit.cs.ut.ee/gprofiler/gost) at the highest significance threshold, with multiple-testing correction (g:SCS algorithm). (D) Fold log2 change of total transcript levels among genes affected by alternative splicing (left) and of differentially spliced variants in lineage-switched and myeloid compartments of patients with MPAL (right). (E) Representation of impact of alternative splicing on mRNA composition and open reading frames (ORFs) of select genes. Column graphs on the right indicate corresponding fold changes of variant expression between AML (or myeloid) and ALL (or lymphoid) populations in 2 tested lineage-switched cases (LS03 and LS04) and 1 case of MPAL.
Figure 4.
Figure 4.
Chromatin reorganization and differential transcription factor binding underpins lineage switching. (A) DNase I hypersensitive site sequencing identified 13 619 sites with a log2-fold reduction and 12 203 sites with a log2-fold increase after lineage switching to AML. Relative peak heights in the AML sample were plotted against those of the ALL sample. (B) A University of California, Santa Cruz (UCSC) Genome Browser screenshot displaying differential expression at lineage-specific loci (red tracks) accompanied by altered DNase I hypersensitivity (black tracks) proximal to the transcriptional start site (TSS) of CD33. (C) UCSC Genome Browser screenshot for CD19 zoomed in on an ALL-associated DHS with EBF occupation as indicated by high-resolution DHS-seq and Wellington analysis. FP, footprint. (D) Heat maps showing distal DHS regions specific for AML relapse on a genomic scale. Red and green indicate excess of positive and negative strand cuts, respectively, per nucleotide position. Sites are sorted from top to bottom in order of decreasing footprint occupancy score. (E) De novo motif discovery in distal DHSs unique to AML relapse as compared with ALL relapse, as shown in panel D. (F) EBF1 and C/EBP binding motifs demonstrate differential motif density in presentation ALL and relapsed AML. DHS, DNase-hypersensitive site.
Figure 5.
Figure 5.
Molecular characterization of lineage-switched MLL/AF4 leukemias. (A) Whole-exome–sequencing data showing genes recurrently mutated within the analyzed cohort and genes clonally mutated in relapsed cases belonging to the same function protein complexes (eg, DNA polymerases, epigenetic complexes, and transcriptional regulators). Data are presented according to the disease time point/cell lineage and age of the patient. Depicted are major SNVs/indels that were found in >30% of reads and minor SNVs/indels present in <30% reads. (B) Comparison of total mutation load (SNVs and indels) identified in patients at presentation (ALL) and relapse (AML) disease stage or lymphoid and myeloid fraction in MPALs. Listed are common SNVs predicted (by Condel scoring) to have deleterious effects. (C) Evolution of KRAS/NRAS mutation–carrying cells during the lineage-switching process. Clonal vs subclonal mutations were defined based on variant allele frequencies (VAFs) of identified hits at setup cutoff of 30%.
Figure 6.
Figure 6.
Epigenetic modulatory genes influence lineage-specific expression profiles. (A) Intersection between identified hits of clonal mutations (variant allelic frequency [VAF] >30%), differentially expressed genes and alternatively spliced, differentially used exon-exon junctions (adj. P < .01) in lineage-switched myeloid relapse/myeloid fraction of MPALs, present in the analyzed cohort. (B) Fold change in expression of NuRD complex members (CHD4, MTA1, RBBP4, and MBD3) and PHF3, after lineage-switched relapse (left) and in MPAL cases (right). (C) CHD4 structure; the R1068H mutation (red) is located in the critical helicase domain of CHD4 at a highly conserved residue. ∗Number of positions that have a single, fully conserved residue; colon, conservation between groups of strongly similar properties, scoring >.5 in the Gonnet PAM 250 matrix; period, conservation between groups of weakly similar properties, scoring ≤0.5 in the Gonnet PAM 250 matrix. (D) Identification of regions of differential chromatin accessibility before and after knockdown of CHD4 and PHF3 depicted in red in MLLr SEM cells (left) and non-MLLr 697 cells (right). For all reads, the fold change in ATAC-peak height was calculated relative to the control (shNTC) and ATAC peaks from knockdown cells were plotted according to their fold change vs the control signals. CHD4 ChIP density plots from SEM cells (depicted in blue) were plotted along with the corresponding DNA regions of the shNTC control. Differentially expressed genes associated with changing ATAC peaks (log2FC analyzed vs shNTC) identified in each cellular variant are represented by heat maps included at the right side of each gene (for SEM and 697 cells). (E) UCSC genome browser screenshots representing differential chromatin accessibility (ATAC-seq) and gene expression level (RNA-seq) in the myeloid CEBPA and the lymphoid RAG2 loci after CHD4 and PHF3 knockdown in MLLr SEM cells and non-MLLr 697 cells. ChIP-seq traces representing normal CHD4 occupancy in non-MLLr B-ALL (REH cells), MLLr B-ALL (SEM cells) and MLLr AML cells (MV-4;11) are shown as a reference at the bottom of each screenshot. TSS, transcriptional start site is depicted for each gene. (F) Expression of the lineage-specific cell surface markers CD19 (lymphoid) and CD33 (myeloid) after culture of MLL/Af4-transformed hCD34+ cord blood progenitor cells in lymphoid-permissive conditions. Knockdown of PHF3, CHD4, or a combination disrupts the dominant lymphoid differentiation pattern in nontargeting control (shNTC). (G) PHF3 knockdown is capable of influencing the surface marker expression after a longer incubation period (33 days). CHD4 knockdown impaired cellular survival upon longer in vitro culture (data not shown). ChIP, chromatin immunoprecipitation.
Figure 7.
Figure 7.
Hematopoietic stem/progenitor populations carry MLL/AF4. (A) Summary of MLL/AF4 positivity and 12 SNVs exclusive for the AML relapse, within different populations analyzed in patient LS01RAML. Circles with solid colors indicate VAF >30%, light dashed circle indicates VAF 5% to 30%. Remaining genes (open circle) represent the 10 other SNVs (of 12 SNVs) which showed the same pattern in the frequency of mutation acquisition (described in supplemental Table 8). (B) Summary of the proposed model of the origin of lineage switched relapse. Evaluation of B-cell receptor repertoires on ALL (presentation) and AML (relapse) lineage switched, and MPAL cases identified 3 different patterns. Pattern 1, with clonotypes on the ALL only. Pattern 2, B-cell receptor-containing clones on ALL and AML, but distinct to each other. Pattern 3, B-cell receptor-containing clones shared between ALL and AML. (C) BCR clone frequencies identified in whole-exome–seq data with application of MiXCR software in all lineage-switched acute leukemia (LSAL) and MPAL cases. VAF, variant allele frequency.

Comment in

References

    1. Meyer C, Burmeister T, Gröger D, et al. The MLL recombinome of acute leukemias in 2017. Leukemia. 2018;32(2):273–284. - PMC - PubMed
    1. Moorman AV, Ensor HM, Richards SM, et al. Prognostic effect of chromosomal abnormalities in childhood B-cell precursor acute lymphoblastic leukaemia: results from the UK Medical Research Council ALL97/99 randomised trial. Lancet Oncol. 2010;11(5):429–438. - PubMed
    1. Germano G, Pigazzi M, del Giudice L, et al. Two consecutive immunophenotypic switches in a child with MLL-rearranged acute lymphoblastic leukemia. Haematologica. 2006;91(5 suppl):ECR09. - PubMed
    1. Jiang JG, Roman E, Nandula SV, Murty VV, Bhagat G, Alobeid B. Congenital MLL-positive B-cell acute lymphoblastic leukemia (B-ALL) switched lineage at relapse to acute myelocytic leukemia (AML) with persistent t(4;11) and t(1;6) translocations and JH gene rearrangement. Leuk Lymphoma. 2005;46(8):1223–1227. - PubMed
    1. Rossi JG, Bernasconi AR, Alonso CN, et al. Lineage switch in childhood acute leukemia: an unusual event with poor outcome. Am J Hematol. 2012;87(9):890–897. - PubMed

MeSH terms