. 2022 Aug 2;34(8):1151-1167.e7.
doi: 10.1016/j.cmet.2022.06.010. Epub 2022 Jul 14.

GCN2 inhibition sensitizes arginine-deprived hepatocellular carcinoma cells to senolytic treatment

Affiliations

GCN2 inhibition sensitizes arginine-deprived hepatocellular carcinoma cells to senolytic treatment

Rindert Missiaen et al. Cell Metab. .

Abstract

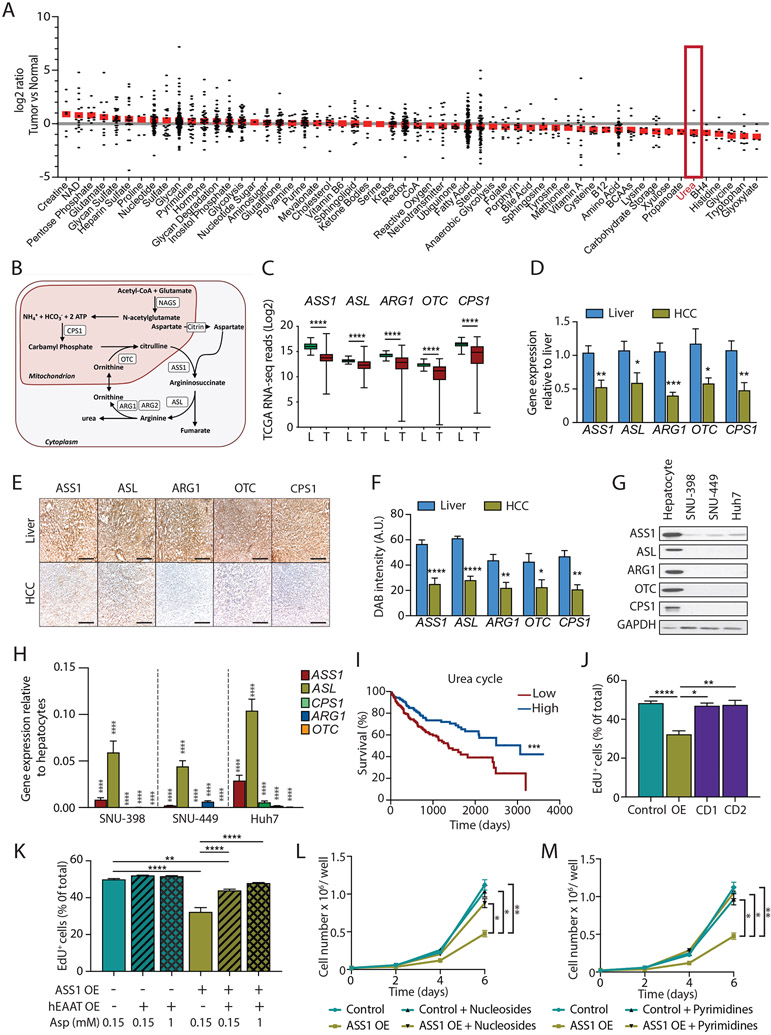
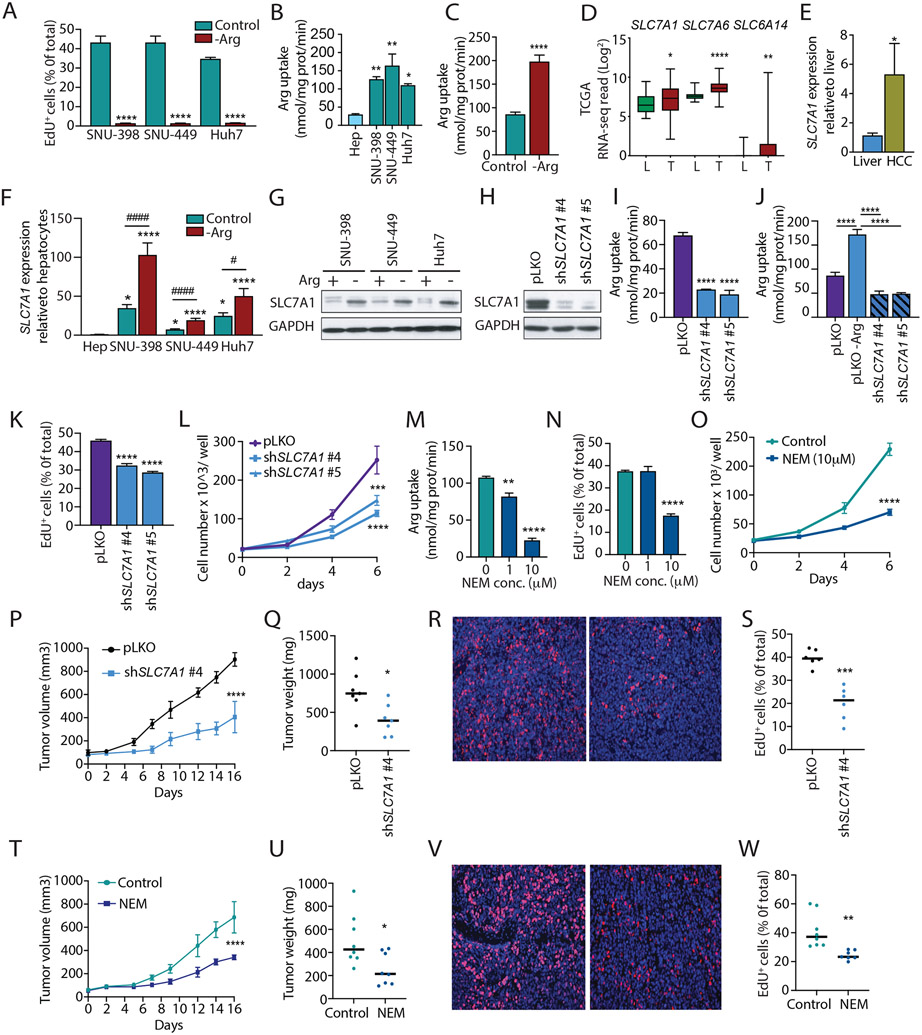
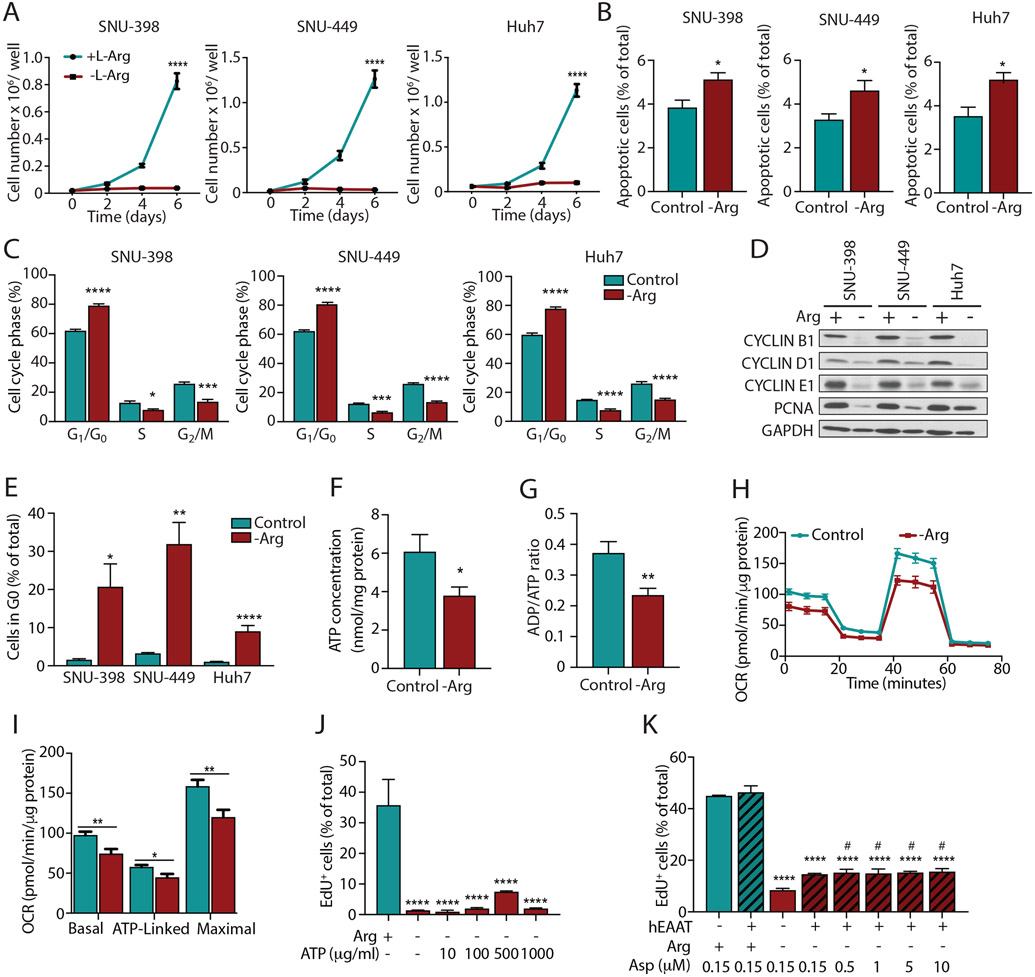
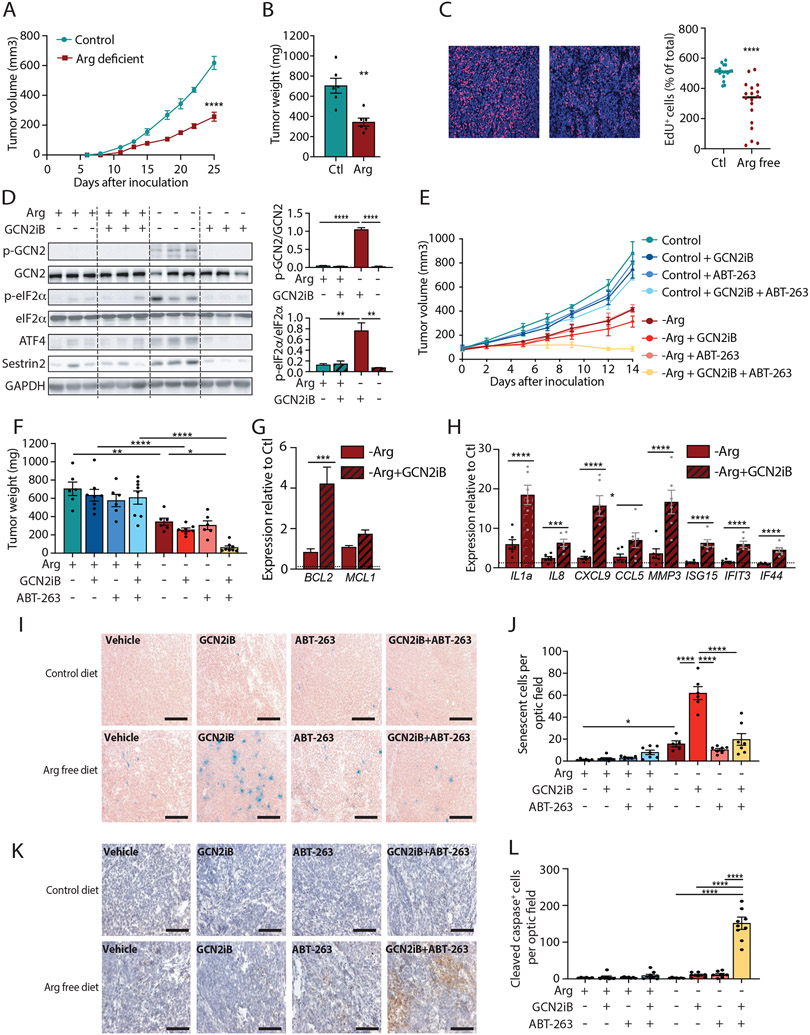
Hepatocellular carcinoma (HCC) is a typically fatal malignancy exhibiting genetic heterogeneity and limited therapy responses. We demonstrate here that HCCs consistently repress urea cycle gene expression and thereby become auxotrophic for exogenous arginine. Surprisingly, arginine import is uniquely dependent on the cationic amino acid transporter SLC7A1, whose inhibition slows HCC cell growth in vitro and in vivo. Moreover, arginine deprivation engages an integrated stress response that promotes HCC cell-cycle arrest and quiescence, dependent on the general control nonderepressible 2 (GCN2) kinase. Inhibiting GCN2 in arginine-deprived HCC cells promotes a senescent phenotype instead, rendering these cells vulnerable to senolytic compounds. Preclinical models confirm that combined dietary arginine deprivation, GCN2 inhibition, and senotherapy promote HCC cell apoptosis and tumor regression. These data suggest novel strategies to treat human liver cancers through targeting SLC7A1 and/or a combination of arginine restriction, inhibition of GCN2, and senolytic agents.

Keywords: GCN2; arginine; hepatocellular carcinoma; senescence; urea cycle.


Conflict of interest statement

Declaration of interests M.C.S. is a member of the Cell Metabolism advisory board.

Figures

Figure 1:
Figure 1:. Characterization of the urea cycle in HCC.
A, Metabolic gene set analysis of TCGA RNA-sequencing data in HCC tumors (n=374) and normal liver tissues (n=50), and 2752 genes encoding all known human metabolic enzymes and transporters according to the Kyoto Encyclopedia of Genes and Genomes (KEGG). Metabolic genes were ranked based on their median fold expression changes in HCC tumors vs normal tissue. B, Schematic overview of the hepatic urea cycle. C, RNA-seq reads of urea cycle genes in normal liver [L] and tumor tissues [T] from TCGA dataset. D, mRNA expression of urea cycle enzymes in healthy liver (n=9) and human HCC tumor samples (n=7). E, F, Representative micrographs of immunohistochemical staining (E) of urea cycle enzymes in patient HCC vs healthy liver samples and quantification (F). Scalebar = 100 μm. G, H, Western blot (G) and mRNA expression (H) analysis of urea cycle enzymes in HCC cell lines and human primary hepatocytes. I, Kaplan-Meier survival curve of average urea cycle TCGA gene expression (CPS1, ASS1, ASL, ARG1, and OTC) using KM-plotter with automatically selected cut-off of 50% (Nagy et al., 2018). J, Flow cytometric analysis of EdU incorporation in SNU-398 cells with ectopic ASS1 expression, as well as catalytically dead versions of ASS1 (Khare et al., 2021). K, EdU incorporation analyses in cultured SNU-398 (control and ASS1 expressing) cells treated with various doses of aspartate. Aspartate supplementation was combined with expression of the hEAAT1 surface protein. L, Growth curves of SNU-398 cells in control conditions and upon ASS1 re-expression in the presence of all four nucleosides. M, SNU-398 cell growth in control conditions and upon ASS1 re-expression in the presence of pyrimidines exclusively. GAPDH is used as loading control for all westerns in this study. For all figures, data are presented as mean ± SEM. **** or #### (p < 0.0001), *** or ### (p < 0.001), ** or ## (p < 0.01), * or # (p < 0.05). Student’s two-tailed unpaired t-test for pairwise comparisons, one-way ANOVA for multiple comparisons, or log-rank test for comparisons of survival distributions of two groups. See also Figure S1.
Figure 2:
Figure 2:. HCC relies on SLC7A1 mediated Arg uptake to ensure proliferation.
A, EdU incorporation in control and Arg free cultured HCC cell lines. B, Arg uptake rate of HCC cells compared to primary hepatocytes estimated by radioisotope labeled 3H-Arg uptake. C, 3H-Arg uptake rate of SNU-398 cells cultured in Arg free compared to control conditions. D, RNA-seq of Arg transporters with increased expression in tumor [T] compared to healthy liver tissue [L] reads extracted from TCGA dataset. E, SLC7A1 expression analysis in primary human HCC tumors and healthy liver samples. F, SLC7A1 levels in primary human hepatocytes and several HCC cell lines in control and Arg restricted conditions. G, SLC7A1 protein levels in HCC cell lines in control and Arg restricted conditions. H, Knock-down efficiency of two independent SLC7A1 shRNAs in SNU-398 cells. I, 3H-Arg uptake rate in control (pLKO) and SLC7A1 shRNA treated SNU-398 cells. J, 3H-Arg uptake rate of control (pLKO), Arg restricted control SNU-398 cells (pLKO -Arg), and SLC7A1 shRNA treated SNU-398 cells after culture in Arg free media for 72 hrs. K, EdU incorporation upon SLC7A1 silencing in SNU-398 cells. L, Growth curves of SNU- 398 cells in control (pLKO) conditions and upon SLC7A1 loss. M, 3H-Arg uptake rate of SNU-398 cells treated with N-ethylmaleimide (NEM). N, EdU incorporation in SNU-398 cells after NEM treatment. O, Growth curves of SNU-398 cells treated with NEM. P, Q, Effect of SLC7A1 silencing (n=8), compared to pLKO (n=8), on subcutaneously xenografted SNU-398 cells, measured by tumor volume (P) and end-point tumor weight (Q). R, S, Representative micrographs (R) showing EdU incorporation in tumors derived from pLKO or SLC7A1 #4 shRNA SNU-398 cells and corresponding quantification (S). Scalebar = 100 μm. T, U, Effect of 5 mg/kg NEM treatment on SNU-398 xenograft progression (control n=10, NEM n=10), measured by tumor volume (T) and end-point tumor weight (U). V, W, Representative micrographs (V) showing EdU incorporation in tumors treated with vehicle (Control) or 5 mg/kg NEM, and corresponding quantification (W). Scalebar = 100 μm. See also Figure S2.
Figure 3:
Figure 3:. Arg restriction induces cell cycle arrest in HCC.
A, Growth curves of HCC cell lines in control and Arg depleted conditions. B, AnnexinV/PI assessment of apoptosis in HCC cell lines cultured in control and Arg depleted conditions. C, PI mediated flow cytometric cell cycle analysis of HCC cell lines cultured in control and Arg free conditions. D, CYCLIN B1, CYCLIN D1, CYCLIN E1 and PCNA levels in control and Arg free cultured HCC cell lines. E, PI/Ki67 stained HCC cells, detecting cells in the G0 cell cycle phase in control and Arg depleted conditions. F, Intracellular ATP levels in control and Arg restricted SNU-398 cells at 72 hrs. G, ADP/ATP ratios in control and Arg restricted SNU-398 cells at 72 hrs. H-I, Oxygen consumption rates (OCR) of control and Arg restricted SNU-398 cells cultured under similar conditions as described for panels F and G. J, EdU incorporation by control and Arg restricted SNU-398 cells supplemented with indicated doses of ATP. K, EdU incorporation of control and Arg restricted SNU-398 cells (including those expressing the hEAAT1 transporter) supplemented with indicated doses of aspartate. See also Figure S3.
Figure 4:
Figure 4:. Arg restriction induces a GNC2 mediated cell cycle arrest.
A, Schematic representation of GCN2 activation upon Arg restriction and p21 mediated induction of cell cycle arrest. B-D, GCN2 signaling analyses: phospho-GCN2 (p-GCN2), total GCN2, phospho-eIF2α (p-eIF2α), total eIF2α, and ATF4 in HCC cells cultured in control and Arg free conditions (72 hrs) (B). Densitometric quantification of p-GCN2/GCN2 ratio (C) and p-eIF2α/eIF2α ratios (D). E-G, GCN2 signaling in HCC cells cultured in control and Arg free conditions after 1 μM GCN2iB or DMSO treatment (E). Densitometric quantification of p-GCN2/GCN2 ratio (F) and p-eIF2α/eIF2α ratios (G). H, EdU incorporation in SNU-398 cell in control and Arg free conditions cultured after 1 μM GCN2iB or DMSO treatment. I, p21 levels in HCC cells cultured in control and Arg free conditions. J, Analysis of p21 in SNU-398 cells cultured in control, Arg free, and Arg repleted conditions. K, p21 levels in SNU-398 cells, cultured in control and Arg free conditions after 1μM GCN2iB or DMSO treatment. L, p21 expression in control (pLKO) SNU-398 cells and those treated with two p21 shRNAs. M, p21 mRNA expression in control (pLKO) SNU-398 cells and those treated with two p21 shRNAs. N, EdU incorporation in HCC cells in control and Arg free conditions after genetic silencing of p21. O, SLC7A1 accumulation in SNU-398 cells, cultured in control and Arg free conditions after 1 μM GCN2iB or DMSO treatment. P, SLC7A1 levels in SNU-398 cells in control and Arg free conditions in the presence and absence of GCN2iB. Q-R, Western blot (Q) and quantification (R) of GCN2 signaling in control (pLKO) and shSLC7A1 expressing SNU-398 cells. See also Figure S4.
Figure 5:
Figure 5:. Arg restriction induces a GNC2-mTORC1 mediated inhibition of protein synthesis.
A, Schematic representation of GCN2-SESTRIN2-mTOR mediated regulation of protein synthesis. B, C, Protein synthesis (assessed by puromycin pulse-chase) in SNU-398 cells cultured in control or Arg free conditions treated with 1 μM GCN2iB (B), and densitometric quantification (C). D, E, Western blot (D) and mRNA expression analysis (E) of SESTRIN2 (SESN2) in HCC cells cultured in control and Arg free conditions. F, G, Protein (F) and mRNA (G) levels of SESTRIN2 (SESN2) in HCC cells cultured in control and Arg free conditions after 1 μM GCN2iB treatment. H, I, Phospho-mTOR (p-mTOR) and total mTOR levels in control and Arg free cultured HCC cells (H) and p-mTOR/mTOR-total ratios determined by densitometric analysis (I). J-L, Phospho-S6K (p-S6K), total S6K, phospho-S6 (p-S6), and total S6 in HCC cells cultured in control and Arg free conditions (J). Densitometric quantification of p-S6K/S6K ratio (K) and p-S6/S6 ratios (L). M-P, Phospho-mTOR (p-mTOR), total mTOR, phospho-S6K (p-S6K), total S6K, phosphorS6 (p-S6), and total S6 in SNU-398 cells cultured in control and Arg free conditions after 1 μM GCN2iB or DMSO treatment (M). Densitometric quantification of p-mTOR/mTOR (N), p-S6K/S6K (O), and p-S6/S6 (P). See also Figure S5.
Figure 6:
Figure 6:. Arg restriction induces GCN2 dependent autophagy.
A, Schematic representation of autophagy inducing mechanisms during Arg deprivation via either mTOR or AMPK. B, C, LC3B and p62 levels in control and Arg free cultured HCC cells (B) and quantified LC3BII/LC3BI ratios (C). D, Flow cytometric analysis of autophagy in HCC cell lines. E, F, LC3B in control and Arg free cultured SNU-386 cells after 1 μM GCN2iB or DMSO treatment (E) and LC3BII/LC3BI ratios (F). G, p62 levels in control and Arg free cultured SNU-398 cells after 1 μM GCN2iB or DMSO treatment. H, Autophagy levels in control and Arg free cultured SNU-386 cells after 1μM GCN2iB or DMSO treatment. I, J, Phospho-AMPK (p-AMPK) and total AMPK in control and Arg free cultured HCC cells (I) and p-AMPK/AMPK-tot ratios (J). K, AnnexinV/PI assessment of apoptosis in SNU-398 cells cultured in control and Arg depleted conditions after 1 μM GCN2iB or DMSO treatment for 7 days. L, p16, p21, and p27 levels in control and Arg free cultured HCC cells. M, Quantification of β-galactosidase+ cells in control and Arg free cultured SNU-398 cells after 1 μM GCN2iB or DMSO treatment for 7 days. N, EdU incorporation in HCC cells cultured in control or Arg free medium for 7 days and 24 hrs after re-supplementation of Arg. O, Growth curves of 1 μM GCN2iB or DMSO treated SNU-398 cells in control and Arg free conditions for 8 days. P, mRNA levels of genes associated with senescence associated secretory phenotypes (SASP) in SNU-398 cells cultured in control and Arg free media, treated with 1 μM GCN2iB or DMSO for 7 days. Data are presented as fold change relative to expression levels of cells cultured in control + DMSO conditions. Q, AnnexinV/ PI assessment of apoptosis in SNU-398 cells, cultured in control and Arg depleted conditions after 1 μM GCN2iB, 1 μM ABT-263, or DMSO treatment for 8 days. See also Figure S6.
Figure 7:
Figure 7:. GCN2 inhibition sensitizes Arg restricted HCC cells to senolytic treatment in vivo.
A, B, Effect of an Arg free diet (n=6), compared to the matched control diet (Ctrl, n=6), on subcutaneously engrafted SNU-398 cells measured by tumor volume (A) and tumor weight (B). C, Representative micrographs (left) and corresponding quantification (right), showing EdU incorporation in tumors from mice fed an Arg free diet, compared to the matched control diet (Ctrl). Scalebar = 100 μM. D, Phospho-GCN2 (p-GCN2), total GCN2, phospho-eIF2α (p-eIF2α), total eIF2α, ATF4, and SESTRIN2 in HCC tumors from mice fed with an Arg free diet or matched control diet (Ctrl), treated with either vehicle or 10 mg/kg GCN2iB. Image of three representative tumors per treatment condition. Densitometric quantification of p-GCN2/GCN2 ratios (upper right) and p-eIF2a/eIF2a ratios (lower right). E, F, Growth curves (E) and end-point tumor weights (F) of SNU-398 xenograft tumors from mice fed an Arg free diet, or matched control diet, and treated with either vehicle (control, n=6), 10 mg/kg GCN2iB (n=8) and/or 50 mg/kg ABT-263 (n=8). For p-values, see Suppl. Fig. S7B. G, H BCL-2 and MCL1 (G), or SASP gene (H) mRNA levels in HCC tumors from mice fed with an Arg free diet, treated with either vehicle or 10 mg/kg GCN2iB. Data presented as fold change relative to control conditions (control diet + vehicle). I, J, Representative micrographs (I) and quantification (J) of β-galactosidase staining (blue) of cryosections from SNU-398 xenograft tumors treated with either vehicle (control), 10 mg/kg GCN2iB and/or 50 mg/kg ABT-263. Counterstained with Nuclear Fast Red staining. K, L, Representative micrographs (K) and quantification (L) of Cleaved Caspase 3 (brown) staining of cryosections from SNU-398 xenograft tumors treated with either vehicle (control), 10 mg/kg GCN2iB and/or 50 mg/kg ABT-263. Counterstained with Hematoxylin. See also Figure S7.

Comment in

  • Making liver cancer cells go ARGh!
    Henneberg AL, Opitz CA. Henneberg AL, et al. EMBO J. 2022 Nov 2;41(21):e112415. doi: 10.15252/embj.2022112415. Epub 2022 Oct 12. EMBO J. 2022. PMID: 36222348 Free PMC article.

Similar articles

Cited by

References

    1. Abou-Alfa GK, Qin S, Ryoo BY, Lu SN, Yen CJ, Feng YH, Lim HY, Izzo F, Colombo M, Sarker D, et al. (2018). Phase III randomized study of second line ADI-PEG 20 plus best supportive care versus placebo plus best supportive care in patients with advanced hepatocellular carcinoma. Ann. Oncol 29, 1402–1408. - PubMed
    1. Agrawal V, Alpini SE, Stone EM, Frenkel EP, and Frankel AE (2012). Targeting methionine auxotrophy in cancer: discovery & exploration. Expert Opin Biol Ther 12, 53–61. - PubMed
    1. Anda S, Zach R, and Grallert B (2017). Activation of Gcn2 in response to different stresses. PLoS One 12. - PMC - PubMed
    1. Augusto L, Amin PH, Wek RC, and Sullivan WJ (2019). Regulation of arginine transport by GCN2 eiF2 kinase is important for replication of the intracellular parasite toxoplasma gondii. PLoS Pathog. 15. - PMC - PubMed
    1. Averous J, Lambert-Langlais S, Mesclon F, Carraro V, Parry L, Jousse C, Bruhat A, Maurin AC, Pierre P, Proud CG, et al. (2016). GCN2 contributes to mTORC1 inhibition by leucine deprivation through an ATF4 independent mechanism. Sci. Rep 6. - PMC - PubMed

Publication types