. 2022 Jul 19;40(3):111088.
doi: 10.1016/j.celrep.2022.111088. Epub 2022 Jun 27.

Viral E protein neutralizes BET protein-mediated post-entry antagonism of SARS-CoV-2

Affiliations

Viral E protein neutralizes BET protein-mediated post-entry antagonism of SARS-CoV-2

Irene P Chen et al. Cell Rep. .

Abstract

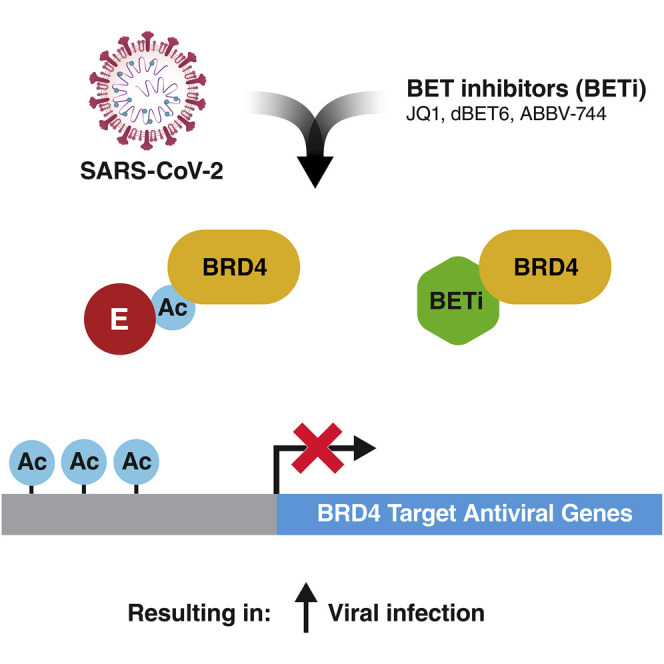
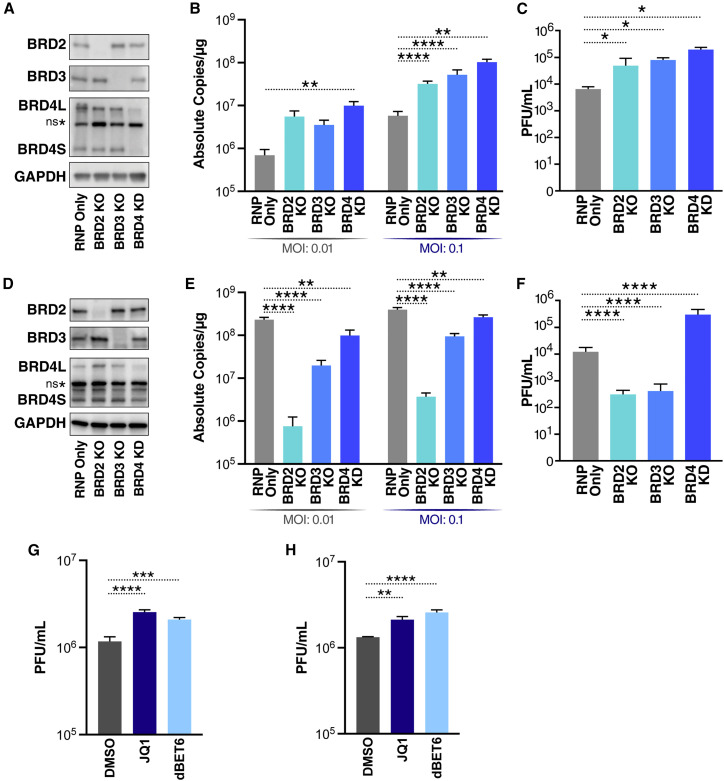
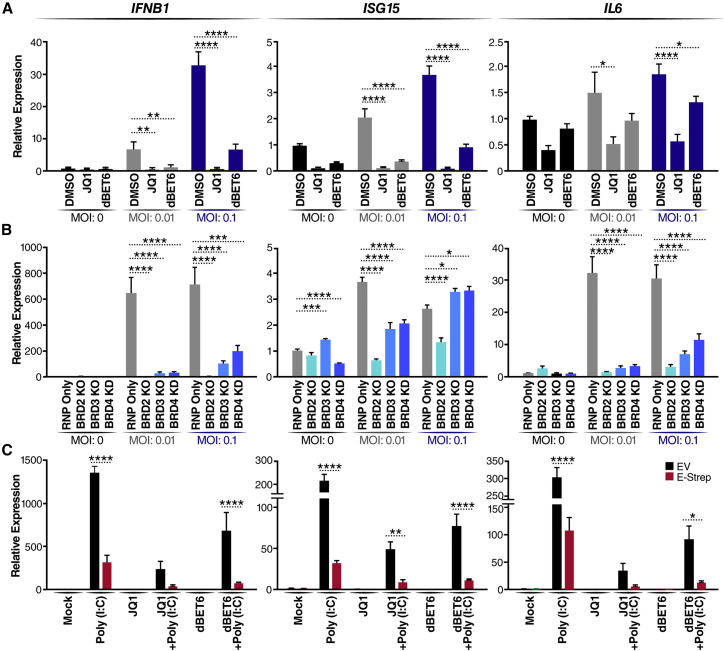
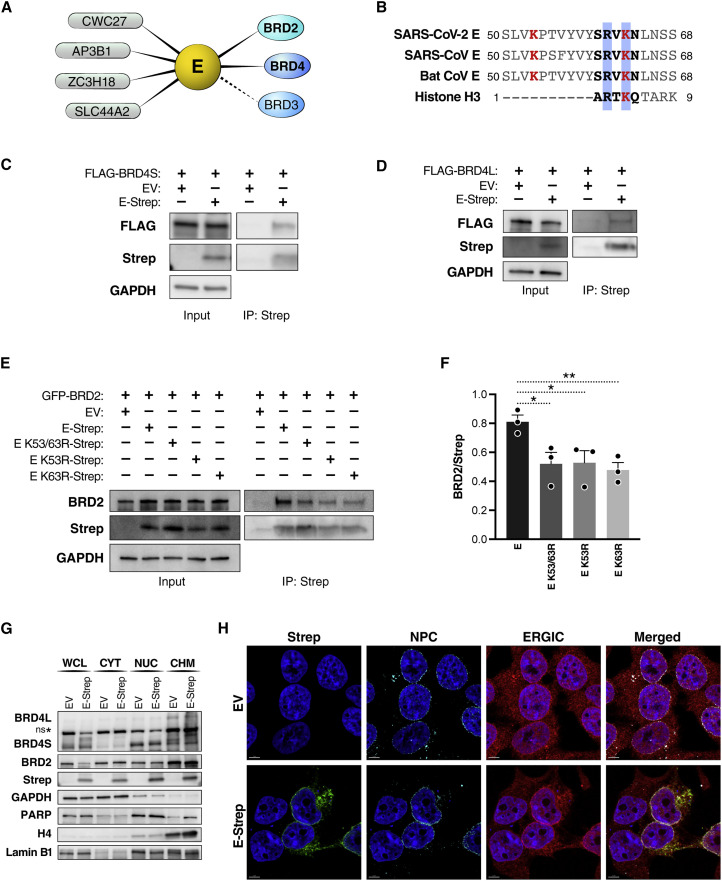
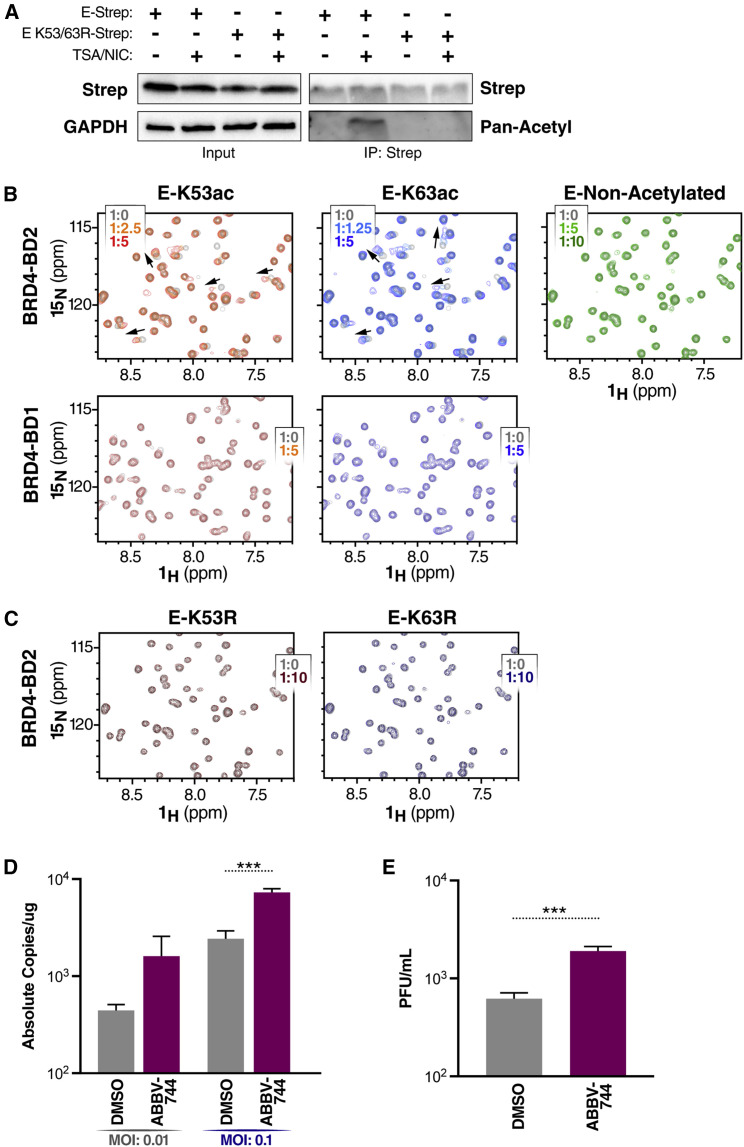
Inhibitors of bromodomain and extraterminal domain (BET) proteins are possible anti-severe acute respiratory syndrome coronavirus 2 (SARS-CoV-2) prophylactics as they downregulate angiotensin-converting enzyme 2 (ACE2). Here we show that BET proteins should not be inactivated therapeutically because they are critical antiviral factors at the post-entry level. Depletion of BRD3 or BRD4 in cells overexpressing ACE2 exacerbates SARS-CoV-2 infection; the same is observed when cells with endogenous ACE2 expression are treated with BET inhibitors during infection and not before. Viral replication and mortality are also enhanced in BET inhibitor-treated mice overexpressing ACE2. BET inactivation suppresses interferon production induced by SARS-CoV-2, a process phenocopied by the envelope (E) protein previously identified as a possible "histone mimetic." E protein, in an acetylated form, directly binds the second bromodomain of BRD4. Our data support a model where SARS-CoV-2 E protein evolved to antagonize interferon responses via BET protein inhibition; this neutralization should not be further enhanced with BET inhibitor treatment.

Keywords: BET inhibitors; BET proteins; BRD2; BRD3; BRD4; COVID-19; CP: Microbiology; SARS-CoV-2; antiviral response; histone mimetic; viral replication.


Conflict of interest statement

Declaration of interests J.C.-S., J.O., and K.H. are employees and shareholders of Synthego Corporation.

Figures

None
Graphical abstract
Figure 1
Figure 1
BRD2, BRD3, and BRD4 differentially affect SARS-CoV-2 infection (A) Representative western blots from A549-ACE2 cells with the indicated BET protein KOs and KD. Lysates were probed for the epitope indicated beside each panel. ns denotes a non-specific band. (B) qRT-PCR of SARS-CoV-2 E RNA isolated 48 h post infection (hpi) from A549-ACE2 cells with the indicated BET protein KO or KD infected with SARS-CoV-2 (MOI of 0.01 or 0.1). Data are expressed in absolute copies per microgram based on a standard curve of the E gene with known copy number. The average of three independent experiments analyzed in triplicate ± SEM is shown and compared with RNP-only samples by ANOVA: p = 0.0397, ∗∗p = 0.0026, ∗∗∗∗p < 0.0001. (C) Plaque assay titers from supernatant of infected A549-ACE2 cells with the indicated BET protein KOs and KD at MOI of 0.1. The average of three independent experiments analyzed in duplicate ± SEM is shown and compared with the RNP-only condition by Student’s t test: p < 0.5. (D) Representative western blots from Calu3 cells with the indicated BET protein KOs and KD. Lysates were probed for the epitope indicated beside each panel. (E) qRT-PCR of SARS-CoV-2 E RNA isolated 48 hpi from Calu3 cells with the indicated BET protein KOs or KD infected with SARS-CoV-2 (MOI of 0.01 or 0.1). Data are expressed in absolute copies per microgram based on a standard curve of the E gene with known copy number. The average of three independent experiments analyzed in triplicate ± SEM is shown and compared with RNP-only samples by ANOVA: ∗∗p < 0.005, ∗∗∗∗p < 0.0001. (F) Plaque assay titers from supernatant of infected Calu3 cells with the indicated BET protein KOs and KD at MOI of 0.1. Average of three independent experiments analyzed in duplicate ±SEM are shown and compared with the RNP-only condition by Student’s t test: ∗∗∗∗p < 0.0001. (G) Plaque assay titers from supernatant of infected A549-ACE2 cells treated with JQ1 (500 nM) and dBET6 (500 nM) at MOI of 0.1. The average of three independent experiments analyzed in duplicate ± SEM is shown and compared with the DMSO condition by ANOVA: ∗∗∗p = 0.0005, ∗∗∗∗p < 0.0001. (H) Plaque assay titers from supernatant of infected Calu3 cells treated with JQ1 (500 nM) and dBET6 (500 nM) at MOI of 0.1. The average of three independent experiments analyzed in duplicate ± SEM is shown and compared with the DMSO condition by ANOVA: ∗∗p = 0.0059, ∗∗∗∗p < 0.0001.
Figure 2
Figure 2
Loss of BET proteins reduces IFN and proinflammatory cytokine expression (A) qRT-PCR of RNA isolated 48 hpi from Calu3 cells infected with SARS-CoV-2 (MOI of 0.01 or 0.1) and concurrently treated with JQ1 (500 nM) or dBET6 (500 nM). Data are expressed relative to DMSO-treated cells for each respective MOI. The average of three independent experiments analyzed in triplicate ± SEM is shown and compared with the DMSO condition by ANOVA for each MOI: p < 0.05, ∗∗p < 0.005, ∗∗∗∗p < 0.0001. (B) qRT-PCR of RNA isolated 48 hpi from Calu3 cells with the indicated BET protein KO or KD infected with SARS-CoV-2 (MOI of 0.01 or 0.1). Data are expressed relative to RNP-only cells for each respective MOI. The average of three independent experiments analyzed in triplicate ± SEM is shown and compared with RNP-only samples by ANOVA for each MOI: p < 0.05, ∗∗p < 0.005,∗∗∗p < 0.001,∗∗∗∗p < 0.0001. (C) qRT-PCR of RNA isolated from A549 cells transfected with empty vector (EV) or the SARS-CoV-2 E (E-Strep) plasmid and treated with 10 ng/mL poly(I:C) for 24 h with and without JQ1 (500 nM) or dBET6 (500 nM). Mock refers to mock transfection and DMSO treatment to mimic poly(I:C) transfection and JQ1 or dBET6 treatment. Data are expressed relative to mock-treated cells. The average of three independent experiments analyzed in triplicate ± SEM is shown with ANOVA compared with mock: p = 0.0139, ∗∗p = 0.0097, ∗∗∗∗p < 0.0001.
Figure 3
Figure 3
SARS-CoV-2 E protein interacts with BET proteins at the nuclear periphery (A) Host protein interactors, including members of the BET protein family (BRD2, BRD3, and BRD4), of the SARS-CoV-2 E protein (Gordon et al., 2020). High-confidence interactors above the MiST threshold are shown as solid lines, and interactors below the threshold are shown as dashed lines. (B) The E protein sequences from human and bat (RsHC014) coronaviruses share a histone H3-like motif. Lysine residues at position 53 and 63 are shown in red, and the histone H3-like motif is bolded in black, with the RXK motif highlighted in blue. Shown are SARS-CoV (GenBank: YP_009724392.1), SARS-CoV-2 (GenBank: NP_828854.1), bat CoV (GenBank: AGZ48809.1), and histone H3 (UniProt: P68431). (C) Representative immunoprecipitation of overexpressed Strep-tagged SARS-CoV-2 E (E-Strep) protein with FLAG-tagged BRD4S from co-transfected HEK293T whole-cell lysates, followed by western blotting using FLAG, Strep, and GAPDH antibodies. EV, empty vector. (D) Representative immunoprecipitation of overexpressed E-Strep protein with FLAG-tagged BRD4L from co-transfected HEK293T whole-cell lysates, followed by western blotting using FLAG, Strep, and GAPDH antibodies. EVEV, empty vector. (E) Representative immunoprecipitation of overexpressed E-Strep protein constructs with GFP-tagged BRD2 from co-transfected HEK293T whole-cell lysates, followed by western blotting using BRD2, Strep, and GAPDH antibodies. EV, empty vector. (F) Densitometry of Figure 3E showing the ratio of GFP-BRD2 to different Strep-tagged E constructs. The average of three independent experiments analyzed in triplicate ± SEM is shown and analyzed by Student’s t test: p < 0.05, ∗∗p = 0.009. (G) Representative western blotting of whole-cell lysate (WCL), cytoplasmic (CYT), nuclear (NUC), and chromatin (CHM) fractions from HEK293T cells transfected with EV or E-Strep with the indicated antibodies. (H) Representative confocal microscopy images of HEK293T cells transfected with E-Strep or empty vector control (EV). Cells were processed for immunostaining with Strep (SARS-CoV-2 E, green), ERGIC-53 (endoplasmic reticulum-Golgi intermediate compartment; red), NPCs (nuclear pore complexes; turquoise), and Hoechst (nuclei, blue). Scale bars, 5 μm.
Figure 4
Figure 4
Acetylated SARS-CoV-2 E peptide predominantly binds the second BD of BRD4 (A) Representative immunoprecipitation of overexpressed E-Strep constructs (E-Strep and E K53/63R-Strep) from co-transfected HEK293T WCLs with and without trichostatin A (TSA) (1 μM) and nicotinamide (NIC) (1 mM), followed by western blotting using Strep, pan-acetyl lysine, and GAPDH antibodies. (B) 2D 1H 15N HSQC spectra measured after addition of E-K53ac (residues 48–58, acetylated), E-K63ac (residues 58–68, acetylated) or non-acetylated (residues 58–70) peptides to 15N-labeled BD1 or BD2. Arrows indicate chemical shift perturbations of peaks. The protein-to-ligand ratio is indicated. (C) 2D 1H 15N HSQC spectra measured after addition of E-K53R (residues 48–58) and E-K63R (residues 58–68) peptides to 15N-labeled BD2. The protein-to-ligand ratio is indicated. (D) qRT-PCR of SARS-CoV-2 E RNA isolated 48 hpi from A549-ACE2 cells infected with SARS-CoV-2 (MOI of 0.01 or 0.1) and concurrently treated with the BD2-selective inhibitor ABBV-744 (500 nM). Data are expressed in absolute copies per microgram based on a standard curve of the E gene with known copy number. The average of three independent experiments analyzed in triplicate ± SEM is shown and compared with DMSO by Student’s t test: ∗∗∗p = 0.0004. (E) Plaque assay titers from supernatant of infected A549-ACE2 cells at MOI of 0.1 treated with ABBV-744 (500 nM). The average of three independent experiments analyzed in duplicate ± SEM is shown and compared with DMSO by Student’s t test: ∗∗∗p = 0.0001.
Figure 5
Figure 5
BET inhibitors enhance SARS-CoV-2 infection in K18-hACE2 mice (A) Schematic of the experiment. (B) Representative images of plaque assays at the same dilution from infected mice lungs 2 and 4 days post infection (dpi). (C) Plaque assay titers from the lungs of infected mice. An average of 5 mice per group were analyzed, and average ± SD is shown and compared with DMSO by Student’s t test. 2 dpi: ∗∗p = 0.0041, ∗∗∗∗p < 0.0001. 4 dpi: ∗∗p = 0.0021. (D) Representative images of H&E staining of lung tissue 7 days after infection. A box indicates the region of the inset. Scale bars, 600 μm (left panels) and 200 μm (right panels). (E) Survival curve of mock (uninfected) and infected DMSO-treated (n = 15), JQ1-treated (n = 15), and ABBV-744-treated (n = 15) mice.

Update of

References

    1. Andrieu G.P., Denis G.V. BET proteins exhibit transcriptional and functional opposition in the epithelial-to-mesenchymal transition. Mol. Cancer Res. 2018;16:580–586. doi: 10.1158/1541-7786.mcr-17-0568. - DOI - PMC - PubMed
    1. Bisgrove D.A., Mahmoudi T., Henklein P., Verdin E. Conserved P-TEFb-interacting domain of BRD4 inhibits HIV transcription. Proc. Natl. Acad. Sci. USA. 2007;104:13690–13695. doi: 10.1073/pnas.0705053104. - DOI - PMC - PubMed
    1. Blanco-Melo D., Nilsson-Payant B.E., Liu W.-C., Uhl S., Hoagland D., Møller R., Jordan T.X., Oishi K., Panis M., Sachs D., et al. Imbalanced host response to SARS-CoV-2 drives development of COVID-19. Cell. 2020;181:1036–1045.e9. doi: 10.1016/j.cell.2020.04.026. - DOI - PMC - PubMed
    1. Cheung K.L., Zhang F., Jaganathan A., Sharma R., Zhang Q., Konuma T., Shen T., Lee J.-Y., Ren C., Chen C.-H., et al. Distinct roles of Brd2 and Brd4 in potentiating the transcriptional program for Th17 cell differentiation. Mol. Cell. 2017;65:1068–1080.e5. doi: 10.1016/j.molcel.2016.12.022. - DOI - PMC - PubMed
    1. Conant D., Hsiau T., Rossi N., Oki J., Maures T., Waite K., Yang J., Joshi S., Kelso R., Holden K., et al. Inference of CRISPR Edits from sanger trace data. CRISPR J. 2022;5:123–130. doi: 10.1089/crispr.2021.0113. - DOI - PubMed

Publication types